Discovering and Visualizing Patterns in EEG Data Erik W. Anderson∗
Catherine Chong†
Gilbert A. Preston‡
´ Claudio T. Silva§
University of Utah
Barrow Neurological Institute
University of Utah
New York University
Figure 1: Our system is composed of many linked views. Structural MRI data is presented in a 3D visualization (top left) whose transfer function is manipulated using 2D widgets (bottom right). Users may select individual EEG sensors (yellow sphere) in the 3D visualization to explore its raw signal (bottom left) and time-frequency representation (middle right). The user also interacts with the time-frequency query area (top right) to generate spectral queries. The time-frequency display and query area are colormapped using an interactive widget (middle left). Combined with the settings in the parameter dialog, the query is issued and relevant sensors are colored blue according to their correlation with the query.
A BSTRACT Brain activity data is often collected through the use of electroencephalography (EEG). In this data acquisition modality, the electric fields generated by neurons are measured at the scalp. Although this technology is capable of measuring activity from a group of neurons, recent efforts provide evidence that these small neuronal collections communicate with other, distant assemblies in the brain’s cortex. These collaborative neural assemblies are often found by examining the EEG record to find shared activity patterns. In this paper, we present a system that focuses on extracting and visualizing potential neural activity patterns directly from EEG data. Using our system, neuroscientists may investigate the spectral dynamics of signals generated by individual electrodes or groups of sensors. Additionally, users may interactively generate queries which are processed to reveal which areas of the brain may exhibit common activation patterns across time and frequency. The utility of this system is highlighted in a case study in which it is used to analyze EEG data collected during a working memory experiment. ∗ e-mail:
[email protected] [email protected] ‡ e-mail:
[email protected] § e-mail:
[email protected] † e-mail:
Index Terms: Computer Graphics [I.3.4]: Graphics Utilities— Application Packages, Electroencephalography 1
I NTRODUCTION
Electroencephalography (EEG) is a technology developed to investigate the alert and working brain by reading the electric fields generated by small neuron groups in the cortex [29]. Since its first use in humans in 1924, EEG has had a profound impact on our understanding of the brain [9, 41]. The processing and analysis of EEG data falls into two general categories: time domain analysis and spectral analysis. Analysis of EEG data in terms of its signal amplitude has lead to many discoveries regarding the functional characteristics of various areas of the brain [6]. However, exploration of EEG data in the frequency domain has provided additional insight into brain function [2]. Although interpreting EEG data in the time domain remains a powerful tool for neuroscientists, we focus on the benefits and difficulties of spectral analysis. Our system (Figure 1) focuses on exploring spectral patterns generated by the brain by examining the collection of time-frequency decompositions generated by an EEG electrode array. One important utilization of EEG analysis is for the study of brain function expressed as coordinated neural activity. Identification of these activity patterns allow scientists to develop new theories regarding neurological disorders [32], overall brain function [11], as well as identify potential new treatments for devastating diseases [31].
Determining neural activation patterns sub-serving a specific brain function is a difficult problem. Functional imaging techniques, such as functional magnetic resonance imaging (fMRI), have provided insight into areas of the brain that are connected. fMRI studies remain powerful mechanisms to examine coordination between different areas of the brain. Buccino et al. provide just one example of fMRI used to uncover functional connections within the brain [8]. These functional studies have revealed that many processes in the brain are spread across cortical regions throughout the brain, as shown in Figure 2. Unfortunately, fMRI studies are limited in temporal resolution and, because it measures metabolic rates, cannot provide insights into spectral dynamics. Discovering important activity characteristics has several uses in the field of neuroscience. These relationships may be monitored and manipulated to diagnose and treat psychological disorders, respectively [30]. Additionally, insights generated from exploring the various functions of different spatio-temporal patterns from EEG often lead to a better understanding of brain function that can be exploited to create new and more effective drug therapy regimens [22]. Finally, understanding the temporal and spectral underpinnings of different brain functions is useful when determining the processing and analysis parameters used to properly interpret neurophysiological data. Ilmoniemi et al. have shown that patterns present in EEG data may be used to identify potential neural circuits [20]. Our system extends this concept by allowing users to query EEG records using time-frequency patterns of their own design. This querying paradigm enhances the flexibility of the system, allowing scientists to explore EEG data in a new way. Contributions. In this paper, we make the following contributions: • We demonstrate that the ability to query collections of timefrequency planes with user-generated examples provides scientists with an effective new tool for the exploration of EEG data. • We present a novel technique for the exploration of timefrequency patterns through the use of filtered, normalized cross-correlogram images. • We show that our system enhances the analysis of EEG data during working memory studies, expediting the validation of stated hypotheses. This paper is organized as follows. After a brief discussion of related work in Section 2, Section 3 discusses the details of our system. Section 4 presents the process of generating time-frequency queries, while Section 5 shows how these queries are used to extract patterns across EEG data. In Sections 6 and 7 we present features in the data elucidated by the use of our technique in the context of a working memory study. A robust discussion of this technique is found in Sections 8 and 9. 2
R ELATED W ORK
Due to the maturity of EEG technology, many analysis techniques have been developed to process the associated signal data. Some studies use event-related potential (ERP) analysis [25] in which the processing and interpretation of EEG data occurs in the time domain. However, many studies forgo ERP analysis and use processing techniques in the frequency domain [14]. Insights gained from the spectral dynamics computed from EEG data have lead to a richer understanding of overall brain functions [16]. Finding a collection of EEG sensors that record similar activity is useful for neuroscientists. Often, this analysis consists of forming a graph where the vertices represent individual electrodes and the edges are generated by examining coherence between its two
Figure 2: Brain activity related to working memory is generated in more than just one part of the brain. Almost every part of the brain exhibits various patterns of activation spanning the temporal cortex (green), the parietal cortex (blue), the frontal cortex (light red) and the prefrontal cortex (dark red).
nodes. However, these methods are often plagued with visualization difficulties, including excessive clutter and computation time. To address these issues, ten Caat et al. introduced coherence analysis using data-driven functional units [42]. To begin exploring the rhythms of brain function, raw EEG data must be processed. Several EEG processing environments have been created to support spectral analysis of EEG signals. The Matlab package EEGLab [12] is a well-used EEG processing suite providing powerful tools to neuroscientists. Although EEGLab implements several advanced analysis tools, it is a more general tool whereas our system focuses on investigating spectral patterns expressed across multiple EEG electrodes. Identifying important signals and sources to explore EEG time series remains an important problem. Ilmoniemi et al. use transcranial magnetic stimulation (TMS) as a known signal for the interrogation of EEG data [20]. However, signal source separation using independent component analysis (ICA) [45] may also be a useful mechanism to determine relevant patterns to search for when exploring EEG data holistically [39]. As recent studies have suggested that the spectral dynamics associated with neural processes are important, we focus our efforts in the frequency domain. With the advent of robust time-frequency decompositions, investigating the evolution of brain activity in the frequency domain is possible [26,40]. Evidence suggesting that the spectral dynamics of brain activity is mounting [2, 37]. Blanco et al. introduced pioneering new methods for time-frequency analysis for EEG data [5]. In their work, they applied the Gabor transform to investigate the spectral dynamics of EEG data using robust visualization to enhance their analyses. In this work, we enhance some of their techniques with interactive visualization and exploration of both the spectral dynamics as well as the spatial characteristics associated with EEG. Our system is a step to extend more traditional spatio-temporal ERP analysis techniques [43] with additional information regarding the frequency content of EEG signals. Aggregating collections of time-frequency planes into a single concise visualization or analysis is difficult. Dimensionality reduction techniques such as Locally Linear Embedding [34] and IsoMap [44] are able to organize these data into local neighborhood relationships. However, if only a measure of similarity is required, Gonzalez and Woods argue that correlation provides an acceptable estimation of similarity between two different images [17].
Explore EEG Data
Extract Time-frequency Patterns
Frequency
Visualize Time-frequency Data
Scalar Value to Add
Visualize Raw EEG Data
Generate Time-frequency Query Compute Cross-Correlogram Filter Cross-Correlograms Highlight Similar Sensor Data
Figure 3: Our system supports two primary functions: exploring EEG data and extracting neural circuits. Users interact with the system primarily to extract and visualize neural circuits. To achieve the best results, users iteratively refine time-frequency queries and set filter parameters for the results. Here, yellow ovals represent steps that users have direct control over.
Time Figure 4: Creating a time-frequency query. The user interacts primarily with a 2D time-frequency plane in which a circular brush (blue outline) controls the scalar field being painted. When paint strokes overlap, their respective values are either additave or subtractive, allowing scientists to gradually change the time-frequency query being constructed. The time and frequency coordinates along with their supports of the kernel are displayed during interaction to ensure the user knows exactly how the query is being manipulated.
between the query and the data from each EEG sensor. However, in order to use these mechanics, the user must first construct the appropriate query to use. 4.1
3
S YSTEM OVERVIEW
Our system is designed to facilitate the exploration of EEG data with respect to the identification of functionally important timefrequency patterns. Figure 1 shows the user interface provided by our application. The choices made during the development of our system were designed to enhance the application’s intuitive usability while maintaining flexibility and functionality. The general workflow for the use of our system is illustrated in Figure 3. Our system begins with the user loading EEG and MRI data. Each EEG sensor is displayed as a sphere in a 3D visualization. In this case, each sensor is rigidly registered to the structural MRI data. Next, the user sets the upper and lower frequencies to parametrize time-frequency decompositions. The user then explores both the raw time series data as well as its spectral representation. At this time, the user sets a query to issue to the system; this may be created from a time series present in the EEG collection or through a brushable canvas. Once the query is defined (Sec. 4), cross-correlograms are computed between the query and the timefrequency planes derived from each EEG electrode (Sec. 5). Each cross-correlogram is an image representing the cross-correlation statistics of the query and the time-frequency plane being analyzed. The resulting images are then filtered to provide sensitivity to shifts in both frequency and time. After filtering, the maximum correlations are displayed by coloring each sensor by its similarity with the query. Higher correlation values are represented in the final visualization by more saturated color than lower values. In this way, coordinated areas of the brain, as seen by the sensor collection, are highlighted and may influence future processing and analysis parameters. 4
EEG Q UERY B Y E XAMPLE
Highlighting patterns of interest is performed in our system through the use of interactive, user-driven queries. The goal of our query interface is to allow the user to construct a pattern for which the system will search for without the need to manipulate a raw time series. The result of this computation is a measure of similarity
EEG Spectral Dynamics
As more is learned about brain activity patterns, it is becoming clearer that EEG analysis in the frequency domain is important. To take advantage of a signal’s frequency content, without losing its temporal dynamics, we employ a time-frequency decomposition for all incoming EEG data. While there exist many applicable timefrequency transforms to choose from, we have chosen to use the STransform [40]. The S-Transform may be thought of as both a generalization of the Short-Time Fourier Transform and an extension of the Continuous Wavelet Transform. The transform generates a complex time-frequency plane by integrating a gaussian window at each time point as follows: (t−τ)2 f 2 |f| h(τ) √ e− 2 e−i2π f τ dτ −∞ 2π
Z ∞
ST (t, f ) =
where h(τ) is the EEG signal, f is frequency, t is a dyadic translation in time, the first exponential is the gaussian window function, and the second is a harmonic function. We use an implementation of the S-Transform provided by the National Institute of Mental Health (NIMH) MEG Core Facility (http://kurage.nimh.nih.gov/meglab/Meg/Stockwell). 4.2
Creating Time-Frequency Queries
The result of the S-Transform is a complex plane composed of phasors at each time-frequency coordinate. By taking the magnitude of each phasor, we generate an image of spectral power across time and frequency. Although it is possible to create images of phase from S-Transformed planes, we restrict ourselves to the better understood dynamics of power. Creating time-frequency queries in our system is equivalent to creating univariate images representing power changes where one axis is time and the other is frequency. To form a time-frequency query, users interact with time-frequency images. Allowing interaction with both images derived from the data of a single EEG sensor as well as images created from a blank canvas affords additional flexibility to the user. All interactions with queries are performed
Query
Sensor Data
Cross-Correlogram
Filter Mask
Filtered Cross-Correlogram
Figure 5: Finding the similarity between an input query and a sensor’s time-frequency data begins with computing the correlation image through convolution. A filter mask is then formed using the usercontrolled sensitivity and lag parameters. This mask is then multiplied with the correlation image. The maximum value of this filtered image represents the filtered similarity between the input query and sensor data.
on a brushable canvas, allowing users to directly modify the timefrequency patterns they wish to search for. Figure 4 shows the result of user interaction to add to and subtract from a time-frequency query using our painting interface. To create a query, the user begins with a time-frequency plane with the same dimensions as the transformed EEG data. Each value on this plane is initially set to zero. The user adds values to this scalar field by applying brush strokes similar to the airbrush tool in popular image editing software. Our system uses a circular gaussian kernel for the brush by default, but provides various brush sizes and shapes to increase flexibility (Figure 4). The ability to manipulate user specified queries provides our system the flexibility to be used to analyze EEG experiments eliciting a variety of responses rather than focusing exclusively on the working memory patterns described by Klimesch [21]. Creating a time-frequency query requires the user to have an idea what patterns are interesting to the phenomenon being studied. Allowing users to interact directly with a time-frequency image enables powerful modification techniques, such as painting with brushes. This interaction mechanic is ubiquitous across both commercial and open-source image manipulation tools. In addition to the concepts of brushes and painting common to image editing environments, global image properties are understood and changed more easily. Like pictures whose lighting and exposure conditions can drastically change their appearance, the overall power contained in a time-frequency image can alter the similarity measure between a query and the EEG input. To account for these differences, we normalize each image by subtracting its mean from each element, then dividing that quantity by the image’s standard deviation. This method of normalization prepares the images for similarity computations using normalized cross-correlation. 5
C ORRELATION S PACE PATTERN M ATCHING
We take advantage of the work by Gonzalez and Nu˜nez to use quickly computed cross-correlations as an acceptable measure of similarity [17]. The notion of using normalized cross correlation as a means for determining similarity between two images stems from its use as a global approach for template based pattern matching [7].
Figure 6: Large collections of time-frequency planes may be projected to a plane to reduce the overall dimensionality of the dataset. Here, IsoMap has been used to position individual planes while attempting to conserve the relative differences between the various data points.
To measure similarity, we first compute cross-correlograms for each pair of time-frequency query and transformed EEG data. We then filter these images to reduce the impact of template matches outside the user-specified time and frequency envelopes. Finally, we determine the similarity by inspecting the filtered cross-correlogram to extract the maximum value indicating the degree to which the query matches the EEG data. 5.1 Pairwise Image Cross-Correlograms Once the user has defined a time-frequency query, we compute the cross-correlogram of the query with each EEG sensor’s timefrequency image. The normalized cross-correlogram, C(u, v), may be computed by introducing normalization terms to the crosscorrelation term discussed by Lewis [23] as follows:
C(u, v) =
1 ( f (x, y) − f¯)(q(x − u, y − v) − q) ¯ ∑ ∑ n−1 x y σ f σq
where f (x, y) is an EEG sensor’s time-frequency image, q(x, y) is the time-frequency query, f¯ and q¯ are the means of the EEG and query data respectively, and σ f and σq are the standard deviations of the EEG and query data, respectively. However, by separating the normalization of each image from the convolution, we can take advantage of Fourier transforms to compute the cross correlations for the entire image domain. Our system uses the FFTW libraries [15] to quickly compute Fourier transforms during this process. 5.2 Filtering Cross-Correlogram Images Once a cross-correlogram image is computed for a query and EEG time-frequency plane, it must be filtered to ensure that the points of maximum correlations lie in the appropriate time and frequency windows. A cross-correlogram is defined on a plane of time and frequency. However, unlike its inputs, the origin of the crosscorrelogram is at the center of the image. These details gives rise to the realization that high values of correlation offset from the origin in the temporal domain represent strong query matches that lag in time. Likewise, departures from the origin in the other dimension reflect patterns undergoing frequency drift, that is they appear at slightly higher or lower frequencies than the query. To ensure that patterns exhibited in both the query image as well as in an EEG sensor’s time-frequency representation occur in appropriate time lags and frequency shifts, we allow the user to control the filtering parameters. The user sets the minimum and maximum time lag as well as the size of the frequency envelope. These parameters define a mask used to filter each cross-correlogram. In Figure 5, we see how an input query and time-frequency image from an EEG sensor are combined to first form a cross-correlogram. The user settings define a filter mask that is then multiplied with the cross-correlogram image to form the filtered cross-correlogram.
Figure 7: Using a data driven query to extract a neural circuit results in an overall high correlation because the query exists exactly in the data. However, carefully constructed user generated queries may yield similar results. Here, the differences between data driven and user generated queries are explored. On the left is the result of a user-generated query (top inset), while the rendering on the right is driven by a time-frequency image from the EEG collection (bottom inset).
Since we multiply the filter mask with the cross-correlogram, we ensure the range of the filter is [0,1] by composing it as the maximum of two separable filters. In practice, we have found that linear (tent) filters in both time and frequency provide appropriate results. 5.3
Computing Similarity
Although the visualization and analysis of small collections of time-frequency planes is straightforward, examining large groups remains difficult. To address this problem, techniques such as IsoMap [44] may be employed as in Figure 6. While organizing image collections in this way strives to maintain a notion of similarity between neighboring points, fine control over differences is lost. The construction and application of the filter mask acts as a user-specified weighting function specifying acceptable shifts in the query pattern in both time and frequency. Our solution, using filtered cross-correlogram images, allows us to selectively tune our filtering process in both the temporal and spectral domains. Once the filter is parametrized by the user and applied, determining the degree of similarity between the query and the EEG data is straightforward. Because the cross-correlogram is formed by convolution, we know that the point of highest intensity represents the point of maximum similarity. 6
S PECTRAL DYNAMICS
IN
W ORKING M EMORY
Working memory, sometimes referred to as short-term memory, is responsible for temporarily storing and retrieving information. It has been described as the short-term retention of information that no longer exists in the environment and the manipulation of this information for subsequent use in guiding behavior [3, 13]. For example, memorizing a new telephone number while trying to find a pen and paper to write it down exercises working memory. Previous studies have discovered that working memory performance is governed by specific oscillation patterns [36]. Of particular interest are the frequency bands of theta (3–7 Hz) and alpha (8–13 Hz) [21]. Additional studies have shown that working memory also relies on a functional neural circuit [19, 35]. These studies highlight the advantages of coupling circuit-based approaches with spectral analysis. Although the brain is a highly distributed system, it is organized into spatial regions that play roles in various functions. Figure 2 shows that almost all areas of the brain are involved with working memory processing and performance. Unfortunately, discovering
the precise functional circuitry of the brain is a difficult task. Investigating cortical areas using more metabolic resources than others through functional magnetic resonance imaging (fMRI) is a common technique [8]. However, Ilmoniemi et al. found that using EEG to track signals induced by transcranial magnetic stimulation (TMS) uncovered coordinated areas of the brain [20]. This work relied on using EEG recordings and the locations of the sensors to investigate the spatio-temporal relationships of coordinated areas of the brain. This type of analysis strengthens the more complicated process of localizing the signal’s source on the cortical surface. 7
A S TUDY
OF
W ORKING M EMORY
Our system has been used in the analysis of a working memory experiment similar to that performed by Ilmoniemi et al. [20]. In this experiment, a verbal working memory task was given to each participant while 64 channel EEG was collected at 500 Hz using an Electrical Geodesics GES 300 System (http://www.egi.com). Repetitive transcranial magnetic stimulation (rTMS) was then applied to the dorsal lateral prefrontal cortex (DLPFC) in the experimental group, while the control group received sham stimulation, the simulated application of rTMS. The goal of this experiment was to explore the effects of rTMS on working memory. This study of verbal working memory performance was conducted using the Sternberg paradigm as the basic task [38]. The Sternberg task presents a string of consonants, followed by a brief (1.5 sec) maintenance period in which nothing is displayed. After the maintenance period, a single letter is presented. The participant must determine whether the probe letter was present in the original string as quickly and accurately as possible. Measuring Working Memory Performance During the working memory task, EEG data is collected. Clark et al. have shown that working memory performance can be predicted from the spectral evolution of the alpha band of frequencies [10]. Similarly, Klimesch showed that working memory performance may be estimated by monitoring the oscillation of theta and alpha frequency bands [21]. We use the S-Transform [40] to decompose the raw EEG signal into a complex time-frequency plane to investigate its spectral evolution. The collection of time-frequency planes computed from raw EEG data are further processed to extract energies (phasor magnitude) in the theta and alpha band of frequencies, commonly between 3 and 7 Hz and 8 and 13 Hz, respectively. Individual mean alpha frequencies are computed from EEG collected during a rest period.
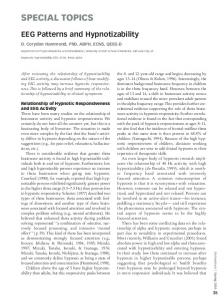
Figure 8: Our system helps provide evidence supporting the hypothesis that the application of rTMS enhances the performance of working memory. Using the query pictured above, we extracted a working memory circuit before stimulation with rTMS (left) and then after (right). Although the circuit extracted is similar in both cases, the overall similarity measure is markedly different. The expected spectral evolution is more evident after stimulation.
These individualized measurements are then compared to the same measures taken during the experiment. As Klimesch points out, the shifts in the mean frequency and the energy densities indicate working memory performance during the task [21]. Manipulating Working Memory rTMS has shown the ability to manipulate the performance of various neural substrates [33]. In fact, previous work indicates that careful application of TMS may either enhance or disrupt working memory processes [24, 31]. Our experimental approach applied 10Hz rTMS to facilitate working memory performance. Although the details through which rTMS improves working memory performance are still unknown, previous studies show that its effects are robust [31]. Here, we use the application of rTMS within the study to validate the findings presented by Ilmoniemi et al. [20]. We then show that our system is capable of using carefully crafted queries to reproduce the same results without the benefit of a known, induced signal. Visualizing Working Memory Performance Although this task focuses on verbal working memory, prior work shows that verbal and spatial memory tasks activate similar cortical regions - the prefrontal, frontal, parietal and temporal cortices [4, 27]. These works rely primarily on fMRI and positron emission tomography (PET) to reveal functionally connected regions of the brain by examining blood flow and changes in localized metabolism. To explore EEG data associated with working memory performance, queries expressing power in the theta and alpha bands of frequencies are created. After the user generates and submits a time-frequency query (Section 4), time-frequency images for each EEG sensor are correlated with it (Section 5). Following this, the user interacts with sliders representing the filtering parameters used to determine sensitivity in the frequency and temporal domains (See Figure 5). Finally, the maximum value of the filtered crosscorrelogram image is found and used as the similarity of the time frequency image to the user’s query (Section 5.3). This filtered cross-correlation measure of similarity is then presented in the three-dimensional representation of the sensor network registered to an MRI. The degree of similarity is indicated by blue spheres with highly saturated color representing high levels of similarity and unsaturated spheres representing low similarity. To
reduce clutter in the final visualization, the user may further filter the coloring of EEG sensors by thresholding the similarity measures to display. The results of the user’s queries represent the similarity of each EEG sensor’s time-frequency transform with the input query. Figure 7 shows that cortical regions activated during a working memory task are extracted using both known patterns found within the EEG record (data-driven query) as well as user-supplied patterns (user-driven query). The sensor collection is composed of electrodes over the temporal, parietal, frontal, and prefrontal cortices, validating previous findings by Hampson et al. [19] and Ilmoniemi et al. [20]. Providing evidence to support or refute a hypothesis is one of the goals of scientific visualization. To this end, our system has been helpful. One of the stated hypotheses tested in the experiment was the application of rTMS enhances the performance of working memory [31]. While this hypothesis is supported by other data collected and analyzed during the experiment, our visualizations provide additional evidence. We formulated a user-generated query based on the spectral dynamics of a strong working memory [21]. Issuing this query to both the pre-stimulation and post-stimulation datasets extracted similar results. However, as Figure 8 shows, the sensor collection highlighted from the post-stimulation data exhibits a stronger similarity to the query than the pre-stimulation data. Since the query was constructed based on the spectral dynamics of an archetypal working memory system, it is reasonable to conclude that rTMS played a role in increasing the performance of working memory. This boost in performance is typified by more energy contained in the theta and alpha bands [21]. 8
R ESULTS
AND
D ISCUSSION
Our system has served as a new tool to extract and visualize potential functionally relevant time-frequency patterns as measured by EEG sensors. While other techniques have been developed to leverage advances in functional brain imaging modalities such as fMRI and PET, we use EEG. The ability of our system to extract relevant patterns existing in data across many EEG electrodes has been shown by reproducing the work of Ilmoniemi et al. [20].
However, unlike the work of Ilmoniemi et al., our technique does not depend on the injection of a known source pattern via current or magnetic stimulation. The ability of our system to find arbitrary, or pre-existing, time-frequency patterns through filtered cross-correlograms sets us apart from existing analysis environments. To extend the system, we provided users the ability to create their own time-frequency queries. In this way, we enable searches for patterns not induced by external means. To exercise this functionality, we carefully crafted time-frequency queries to reflect the expected behavior during a working memory task. These usergenerated queries were also able to extract the known neural activity patterns subserving verbal working memory processes. However, it should be mentioned that arbitrary queries may not yield expected results. Extracting specific activity patterns relies on exercising the brain with an appropriate experimental paradigm. For instance, the neural circuit defining motion planning may not sufficiently be expressed during a working memory task, and thus, cannot be explored. However, analysis of EEG data with respect to neural circuits exercised during the experiment provides neuroscientists with a richer understanding of their results. 9
C ONCLUSIONS
We have demonstrated that correlating time-frequency images associated with EEG data is capable of extracting neural circuits. While other functional imaging modalities such as fMRI and PET examine changes in blood flow, our system relies on electric fields generated at the cortical surface. Although fMRI and PET are technologies that localize activity in the brain with high fidelity, they suffer from low temporal resolution. On the other hand, EEG provides high temporal resolution, but determining the location of signal sources is a difficult problem currently being researched [18]. These source localization methods have the potential to help determine which areas of the brain are responsible for generating the various signals and how they are connected to one another. Our system makes extensive use of the importance of the spectral evolution of EEG data. However, identifying appropriate and robust spectral components is not easy. Shackman et al. present a method for determining appropriate frequency bands for study [37]. In this work, the authors also advocate for the use of scientific visualization to assist in the analysis and interpretation of data. Our system takes steps to advance the visualization and interpretation of large collections of EEG data. Our system relies on the ability to compute pair-wise crosscorrelograms. By extending the work by Mueen et al. [28], it may be possible for our system to more quickly correlate larger time series from higher density EEG systems. The current implementation relies on FFTW to create cross-correlograms, limiting the dataset sizes. 10
F UTURE W ORK
Source identification techniques may be able to provide a powerful tool in the exploration of brain activity. Independent component analysis (ICA) has long been a tool used by neuroscientists to identify important waveforms generated in the brain [45]. Since our application supports arbitrary time-frequency queries, we may use the results from ICA to inform our system with relevant query images. In this way, potential new activity patterns may be identified for additional study. This would lead to a more complete understanding of the various spectral dynamics subserving various tasks. Our system may provide a good basis for the construction of spatial weighting kernels used to analyze EEG data for higher level processes. Anderson et al. used gaussian kernels parametrized to highlight activity from an accepted cortical region associated
(a)
(b)
Figure 9: Volumetric datasets have high correlation between adjacent slices, giving rise to features that exist in all three dimensions of the volume. Here, a synthetic dataset composed of three concentric spheres (a) is shown. By re-ordering slices in this symmetric volume using a correlation measure with the mid-volume plane as the query image (b), the symmetry is exploited to form a different volumetric dataset with high correlation between slices.
with working memory [1]. Extracting sensors associated with specific time-frequency expression may better inform the use of spatial weighting strategies. Additionally, the concept of ordering time-frequency images through correlation may be applied to three dimensional rendering. Using correlation to impose an artificial order of two-dimensional images may allow the visualization of large collections of images. Figure 9 shows an example of this possibility. Although this type of application would suffer from well-known disadvantages associated with volume rendering (occlusion, transfer function specification difficulties, etc), it may help to reveal interesting relationships useful to determine the neural substrates used to perform a complex task. Acknowledgements. The authors would like to thank Dr. Steven Callahan who graciously made his data public for use in this paper. This work was supported in part by grants from the National Science Foundation (IIS-0905385, CNS-0855167, IIS-0844546) the Department of Energy, the Center for Integrative Biomedical Computing, and IBM Faculty Awards. R EFERENCES [1] E. W. Anderson, K. C. Potter, L. E. Matzen, J. F. Shepherd, G. A. Preston, and C. T. Silva. A user study of visualization effectiveness using EEG and cognitive load. Computer Graphics Forum, 30(3), 2011. [2] E. Angelakis and J. Stathopoulou. Electroencephalographic peak alpha frequency correlates of cognitive traits. Neuroscience Letters, 371(1):60–63, 2004. [3] A. Baddeley. Working memory: The interface between memory and cognition. J. of Cognitive Neuroscience, 4(3):281–288, 1992. [4] D. M. Barch, T. S. Braver, L. E. Nystrom, S. D. Forman, D. C. noll, and J. D. Cohen. Dissociating working memory from task difficulty in human prefrontal cortex. Neuropsychologia, 35(10):1373–1380, 1997. [5] S. Blanco, R. Q. Quiroga, O. A. Rosso, and S. Kochen. Timefrequency analysis of electroencephalography series. Physical Review E, 51(3):2624–2631, 1995. [6] B. Blankertz, G. Dornhege, C. Schafer, R. Krepki, J. Kohlmorgen, K.-R. Muller, V. Kunzmann, F. Losch, and G. Curio. Boosting bit rates and error detection for the classification of fast-paced motor commands based on single-trial eeg analysis. Neural Systems and Rehabilitation Engineering, IEEE Transactions on, 11(2):127 –131, june 2003. [7] R. Brunelli. Template Matching Techniques in Computer Vision: Theory and Practice. Wiley Publishing, 2009. [8] G. Buccino, S. Vogt, A. Ritzl, G. R. Fink, K. Zilles, H.-J. Freund, and G. Rizzolatti. Neural circuits underlying imitation learning of hand actions: An event-related fmri study. Neuron, 42(2):323 – 334, 2004.
[9] G. Buzs´aki. Rhythms of the brain. Oxford University Press, 2006. [10] C. Clark, M. Veltmeyer, R. Hamilton, E. Simms, R. Paul, D. Hermens, and E. Gordon. Spontaneous alpha peak frequency predicts working memory performance across the age span. International Journal of Psychophysiology, 43(1):1–9, 2004. [11] C. Constantinidis and X.-J. Wang. A neural circuit basis for spatial working memory. The Neuroscientist, 10(6):553–565, 2004. [12] A. Delorme and S. Makeig. EEGLAB: An open source toolbox for analysis of single-trial EEG dynamics. Journal of Neuroscience Methods, 134(1):9–21, 2004. [13] M. D’Esposito, B. R. Postle, and B. Rypma. Prefrontal cortical contributions to working memory: Evidence from event-related fMRI studies. Experimental Brain Research, 133:3–11, 2000. [14] G. Dumermuth and L. Molinari. Spectral analysis of the eeg: Some fundamentals revisited and some open problems. Neuropsychobiology, 17(2):85–99, 1987. [15] M. Frigo and S. Johnson. FFTW: an adaptive software architecture for the FFT. 3:1381 –1384 vol.3, may 1998. [16] G.Fuggetta, E. F. Pavone, A. Fiaschi, and P. Manganotti. Acute modulation of cortical oscillatory activities during short trains of highfrequency repetitive transcranial magnetic stimulation of the human motor cortex: A combined EEG and TMS study. Human Brain Mapping, 29:1–13, 2008. [17] R. C. Gonzalez and R. E. Woods. Digital Image Processing, 3rd Edition. Prentice Hall, 2007. [18] D. Hammond and B. Scherrer. EEG source estimation via cortical graph smoothing. INCF NeuroInformatics, 2011. [19] M. Hampson, N. R. Driesen, P. Skudlarski, J. C. Gore, and R. T. Constable. Brain connectivity related to working memory performance. Journal of Neuroscience, 26(51):13338–13343, 2006. [20] R. Ilmoniemi, J. Virtanen, J. Ruohonen, J. Karhu, H. Aronen, R. N¨aa¨ t¨anen, and T. Katila. Neuronal responses to magnetic stimulation reveal cortical reactivity and connectivity. NeuroReport, 8(16):3537–3540, 1997. [21] W. Klimesch. EEG alpha and theta oscillations reflect cognitive and memory performance: A review and analysis. Brain Research Reviews, 29:169–195, 1999. [22] D. Lacroix, Y. Chaput, J.-P. Rodriguez, M. Filion, D. Morrison, P. StDenis, and J.-M. Albert. Quantified eeg changes associated with a positive clinical response to clozapine in schizophrenia. Progress in Neuro-Psychopharmacology and Biological Psychiatry, 19(5):861 – 876, 1995. [23] J. Lewis. Fast template matching. Vision Interface, pages 120–123, 1995. [24] B. Luber, L. H. Kinnunen, B. C. Rakitin, R. Ellsasser, Y. Stern, and S. H. Lisanby. Facilitation of performance in a working memory task with rTMS stimulation of the precuneus: Frequency- and timedependent effects. Brain Research, 1128:120–129, 2007. [25] S. J. Luck. An introduction to the event-related potential technique. MIT Press, 2005. [26] S. Mallat. A theory for multiresolution signal decomposition: The Wavelet representation. IEEE Transactions on Pattern Analysis and Machine Intelligence, 11(7):674–693, Jul 1989. [27] F. M. Mottaghy, B. J. Krause, L. J. Kemna, R. T¨opper, L. Tellmann, and M. Beu. Modulation of the neuronal circuitry subserving working memory in healthy human subjects by repetitive transcranial magnetic stimulation. Neuroscience Letters, 280:167–170, 2000. [28] A. Mueen, S. Nath, and J. Liu. Fast approximate correlation for massive time-series data. In Proceedings of the 2010 ACM SIGMOD International Conference on Management of data, SIGMOD ’10, pages 171–182, New York, NY, USA, 2010. ACM. [29] E. Niedermeyer and F. L. da Silva. Electroencephalography: Basic Principles, Clinical Applications, and Related Fields. Lippincott Williams and Wilkins, 2005. [30] J. P. O’Reardon, H. B. Solvason, P. G. Janicak, S. Sampson, K. E. Isenberg, and Z. Nahas. Efficacy and safety of transcranial magnetic stimulation in the acute treatment of major depression: A multisite randomized controlled trial. Biological Psychiatry, 62:1208–1216, 2007. [31] G. A. Preston, E. W. Anderson, T. Goldberg, E. Wassermann, D. Wein-
[32]
[33]
[34] [35]
[36]
[37]
[38] [39]
[40] [41]
[42]
[43]
[44]
[45]
berger, and C. T. Silva. Effects of 10Hz rTMS on the neural efficiency of working memory. Journal of Cognitive Neuroscience, 2009. K. Ressler and H. Mayberg. Targeting abnormal neural circuits in mood and anxiety disorders: from the laboratory to the clinic. Nature Neuroscience, 10:1116–1124, 2007. E. Rounis, K. Yarrow, and J. C. Rothwell. Effects of rTMS conditioning over the fronto-parietal network on motor versus visual attention. Journal of Cognitive Neuroscience, 19:513–524, 2007. S. T. Roweis and L. K. Saul. Nonlinear dimensionality reduction by locally linear embedding. Science, 290(22):2323–2326, 200. B. Rypma, J. S. Berger, and M. D’Esposito. The influence of working memory demand on subject performance on prefrontal cortical activity. Journal of Cognitive Neuroscience, 14:721–731, 2002. P. Sauseng and W. Klimesch. EEG alpha synchronization and functional coupling during top-down processing in a working memory task. Human Brain Mapping, 26(1):148–155, 2005. A. Shackman, B. McMenamin, J. Maxwell, L. Greischar, and R. Davison. Identifying robust and sensitive frequency bands for interrogating neural oscillations. NeuroImage, 54(4):1319–1333, 2010. S. Sternberg. High-speed scanning in human memory. Science, 153(3736):652–654, 1966. M. C. Stevens, K. A. Kiehl, G. Pearlson, and V. D. Calhoun. Functional neural circuits for mental timekeeping. Human Brain Mapping, 28(5):394–408, 2007. R. G. Stockwell. A basis for efficient representation of the s-transform. Digital Signal Processing, 17(1):371–393, 2007. B. Swartz and E. Goldensohn. Timeline of the history of EEG and associated fields. Electroencephalography and clinical Neurophysiology, 106(2):173–176, 1998. M. ten Caat, N. M. Maurits, and J. Roerdink. Functional unit maps for data-driven visualization of high-density EEG coherence. In Proc. Eurographics/IEEE VGTC Symposium on Visualization (EuroVis), pages 259–266, 2007. M. ten Caat, N. M. Maurits, and J. B. Roerdink. Design and evaluation of tiled parallel coordinate visualization of multichannel EEG data. IEEE Transactions on Visualization and Computer Graphics, 13(1):70–79, 2007. J. B. Tenenbaum, V. de Silva, and J. C. Langford. A global geometric framework for nonlinear dimensionality reduction. Science, 290(22):2319–2323, 200. R. Vigario, J. Sarela, V. Jousmiki, M. Hamalainen, and E. Oja. Independent component approach to the analysis of eeg and meg recordings. IEEE Transactions on Biomedical Engineering, 47(5):589 –593, may 2000.