DISCOVERING EDUCATIONAL VALUE OF INTERACTIVE ANNOTATED EXAMPLES IN A BUSINESS PROGRAMMING COURSE Michael V. Yudelson, University of Pittsburgh,
[email protected] Natalya Goreva, Indiana University of Pennsylvania,
[email protected] Bryan A. Marshall, Georgia College & State University,
[email protected] Douglas Goings, Georgia College & State University,
[email protected]
of this would be programming IDE that uses different colors for the code and the explanations. Teacher explanations in lectures are not always captured in handouts and computer generated presentations; inclass explanations, therefore, can be easily forgotten, and students cannot access them.
ABSTRACT In this paper, researchers report the results of a study of interactive annotated examples (IAEs) in the context of a business programming course. Using code examples is a key element in most course that cover programming, and providing students with asneeded assistance in the form of code annotations is extremely beneficial. In this experiment, a set of nonmandatory examples were made available to students for self-study. Students were able to access the examples at their own pace on their own time. This study confirms results from previous studies that student browsing of annotated coding examples by them to develop programming skill more readily. This paper contributes to the literature on programming pedagogy and traits of successful student.
A number of tools have been developed to compliment lecture and textbook presentations of programming concepts and examples. They differ in the purpose they serve and in their method of delivery [2], to their capacity for student selfassessment [8], to their capacity to provide cognitive tutoring [1,9]. The more involving and the more intellectually challenging a tool, the better it serves its purpose of aiding student learning. Teachers should not underestimate, however, the value of providing well documented examples. It is, after all, understanding of the code that is the first and most important prerequisite for student mastery of a programming language.
Keywords: MIS education, adaptive hypermedia, e-learning, programming languages, example-based learning, VB.NET
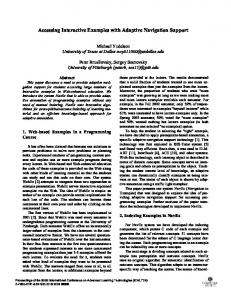
WebEx, short for Web-based tool for exploring programming examples, was developed as an interactive tool to facilitate student understanding of programming code. WebEx presents code examples, marking lines that offer to teacher annotations. Students can access teacher annotations by clicking on icons next to the lines of code. An illustration of WebEx is presented in Figure 1 below. The first version of WebEx was released in 2003. Since then, WebEx has been used in many classes primarily as a snapshot of the teacher’s line-by-line explanation of programming code. At first, WebEx covered only C language. Later, Java, HTML, XML, Visual Basic .NET, and SQL were added as WebEx tools [3].
INTRODUCTION Scrutinizing code examples is the key activity in learning and developing skill in a programming language. Programming language textbooks include collections of code accompanied by explanations. Instructors in programming courses also have code collections to use in their demonstration of particular languages. These collections show both good and bad examples—code efficiency and weaknesses in code design, for example. Although reading textbooks and listening to lectures are the two most commonly methods used to study a programming language, they have major limitations.
It is quite challenging to determine the value of exploratory browsing of annotated examples as it relates to student success as it is to ascertain which annotated examples were most accessed for review. In this study, researchers limited student learning experienced to lectures, textbook coverage of programming concepts, and annotated examples made available through WebEx was used as the only
Code examples in textbooks are usually separated from accompanying explanations. This separation causes some students confusion, and there is a misconnect between code and explanations. Even when explanations are provided in the form of in-line comments, they may not be easily distinguished from the code they were intended to illustrate. An example
Vol. IX, No. 1, 2008
181
Issues in Information Systems
Discovering Educational Value Of Interactive Annotated Examples
Despite these encouraging results, there were several limitations to that study. First, there were fewer student subjects than would be desirable for an experiment (only ten students participated in the study published in 2007). This limited the number of things that could have been detected that resulted from the application of WebEx usage. Second, all student activity was treated equally without regard to focus of the class at that time. Students could devote, for example, their time to browsing code examples to address basic needs in their assignments, while advanced topics are discussed in class. In this study, researchers wished to address these and some other questions as well.
learning tool, with the exception of the course textbook and lectures. This paradigm is the same as reported by Goreva, Yudelson, & Marshall [6]. In this study, researchers have taken a closer look to better determine whether the impact that browsing annotated code examples has on student achievement. Figure 1. Illustration of Interactive Annotated Examples in WebEx
RESEARCH HYPOTHESES The first goal of this research was to confirm the results from the previous study [6] and to check whether the use of interactive annotated examples has a positive impact on student performance in programming courses. Hypothesis 1: The more actively students work with interactive annotated examples, the more successful they will be in a programming course. The second goal of the research was to investigate the impact of relevance while interacting with examples.
This paper presents a review of WebEx and other examples of annotated code browsing. Following the summary of previous research, four research hypotheses are presented as a prelude to a description of the study’s research design. The design includes a description of experimental settings and tools used to collect data. The results section lays out variables and findings, and discussion and conclusions complete the paper.
Hypothesis 2: Working with the examples that are relevant to the current topic of the class is more beneficial to students’ success with this topic than working with other examples. The third goal was to see beyond previously used metrics: number of clicks and breadth of coverage (number of examples). For this purpose, researchers devised a third metric—depth of coverage. This metric is used to determine if students explore teacher’s comments for examples in full or in part. It is through this new metric that the researchers try to refine their model of student learning.
PREVIOUS RESULTS In a previous study, Goreva, Yudelson, & Marshall [6], attempted to determine whether the use of annotated examples was beneficial to students. Of interest was student achievement on final examination grades, as we as absolute and relative grade improvement between midterm and finals. Analysis focuses on the number of clicks made by students to uncover teacher annotations and the number of times clicks occurred (a.k.a. course coverage). Both the number of clicks and the number of examples covered have a positive impact on the student improvement. The more examples students browsed and the more annotations to lines of code they read, the greater their was the improvement in the course was based on both their absolute grade (final grade-midterm grade) and relative ((final grade-midterm grade)/midterm grade).
Vol. IX, No. 1, 2008
Hypothesis 3: The more interactive annotated examples students explore, the more successful they are in the course. Related to the previous goal finally, researchers wanted to see whether the usefulness of students’ interaction with a particular interactive annotated example would be related to the depth at which they explored an interactive annotated example. Hypothesis 4: There is a certain depth of exploration that students have to achieve for the interaction to be
182
Issues in Information Systems
Discovering Educational Value Of Interactive Annotated Examples
understanding. The instructor made students aware that they were not required to use interactive annotated examples in WebEx. The instructor also emphasized to students that they could find code examples with teacher comments in other sources, such as handouts.
beneficial. Specifically, shallow exploration of examples should not be considered. STUDY DESIGN Researchers designed the study as an experiment. The following subsections detail the research design.
Tools Subjects and Classroom Setting To access individual interactive annotated examples from WebEx, students used the Knowledge Tree portal [7]. An illustration of the Knowledge Tree interface is shown in Figure 2. Knowledge Tree provided authorization and authentication of the users and aggregated all examples available in the course into three topic folders:
The subjects for this study were a convenience sample of students in a business programming class at Indiana University of Pennsylvania during the spring and fall semesters of 2007. Forty students in two classes participated in this study; of those, 18 were in the experimental group who used WebEx.
VB .NET Basics Desktop Applications Web-based Applications
The course in business programming was designed to developed students’ skills in programming with Visual Basic.NET. Students had access to the course textbook and the instructor’s handouts for each lecture. In addition, at the beginning of the course, students in the experimental group were given access to interactive annotated examples from WebEx. During the course of the study, two examinations were administered: a midterm (given roughly halfway through the course) and a final. Both exams had a tangible section with questions related to code
Each WebEx topic folder contained links to relevant interactive annotated examples. The optional left frame of the Knowledge Tree interface included a tree structure of course folders and related interactive annotated examples. In the illustration, main frame, the current view on a folder or an example was shown.
Figure 2. Illustration of the Knowledge Tree Portal Showing Course Topics Tree and WebEx Links
Students were able to access of 38 interactive annotated examples. Each interactive annotated examples consisted of a sequence of code lines, potentially with annotations, as shown in at the top. Square bullets (not icons) to the left of each code line indicate a clickable link to an annotation.
Vol. IX, No. 1, 2008
As students interacted with WebEx, their responses were recorded by CUMULATE, a user modeling server [4,5]. The CUMULATE server maintained a history of user activity that was available via a set of HTTP protocols. WebEx exploited those protocols to retrieve user interactivity with interactive annotated examples and then to visualize the interactivity in the form of line-by-line annotations. An illustration of
183
Issues in Information Systems
Discovering Educational Value Of Interactive Annotated Examples
analysis here focuses only on the period between midterm and final exams.
this feedback is show in Figure 3. Interaction logs kept by CUMULATE were later exported for subsequent analysis.
Metrics Figure 3. Illustration of Interactive Annotated Examples with Interface Legend
In the analysis of student interaction with WebEx, the following metrics (independent variables) were used. 1. Number of clicks—the number of times a student clicked to open an interactive annotated example. Navigation clicks between examples that did not result in the opening of annotations were also counted. 2. Number of interactive annotated examples or width of coverage—the number of times individual interactive annotated examples were accessed. 3. Average depth of example exploration or depth of coverage—the average percentage of lines in covered interactive annotated examples that students reviewed. Because almost all student activity occurred after midterm and before the final, researchers computed metrics for that period of the course only. Observables The following observable parameters were used: 1. Final grade 2. Absolute grade increment—the number of points students gained (or lost) on the final exam compared with the score on the midterm exam (final grade - midterm grade). 3. Relative grade increment—growth (or drop) of the final grade in terms of midterm grade in percent ((final grade-midterm grade)/midterm grade). The relative grade increment is a very important variable because it shows not only the improvement in the score (absolute increment), but also allows to compare the level of the subject’s knowledge before the midterm and the improvement during the second half of the course (between the midterm and the final tests). In other words, this variable shows the rate of improvement.
RESULTS The following phenomena were discovered when researchers began to analyze the data. In Spring 2007, students made 1,359 clicks and explored the 25 interactive annotated examples available to them. Before midterm, students had made no clicks, all of their activity occurred between midterm and final exams. In Fall 2007, students made 1,211 clicks and explored all 38 interactive annotated examples. Before midterm, students made 109 clicks and explored 19 examples; between midterm and final exams, they had made 1,102 clicks and had explored 33 interactive annotated examples.
Data Filtering For our analysis we aggregated the data the following way. 1. All of the clicks between midterm and final exam – no filtering. 2. Only the clicks relevant to the topic of the final exam, eliminating the exploration of the examples that were not in the focus of the class at the time. This filtering would help us address our second hypothesis.
From the beginning of the classes until midterm, students were not particularly active or not active at all. Most of the browsing, although scarce, in Fall 2007 occured just before the midterm exam. CUMULATE recorded the bulk of student activity during in the last two weeks before the final exam. Because of the lack of activity before midterm,
Vol. IX, No. 1, 2008
184
Issues in Information Systems
Discovering Educational Value Of Interactive Annotated Examples
3. Only the clicks on “sufficiently explored” examples, eliminating cursory scans. This filter condition would help us to address third and fourth hypotheses. The threshold for sufficiency was set empirically. Figure 4 shows a histogram of all user-example depths of exploration. As we can see the distribution is positively skewed with a sizable peek around depth 10%. The tail of the distribution is quite heavy as well. The peek drops at about 13%. We will use this value as our threshold for deep enough exploration of example.
conditions in a stepwise fashion for entering metrics into the models. The results of regressions with significant results are shown in Table 1.
Figure 4. Histogram of Depths of Student Exploration of Interactive Annotated Examples
The more active students are in browsing the interactive annotated examples, the better they scored on the final test. It does not matter whether they concentrated on the current topic of the upcoming final exam or not. Any interaction with interactive annotated examples helped them to build their grades. Students needed to scan a broad area of interactive annotated examples in order to build their grade. A cursory (shallow) scanning of the interactive annotated examples may be helpful here as well.
In general, working with annotated interactive annotated examples helped students to score higher as shown in Columns 1 and 2 of Row 1 of Table 1. This conclusion supports Hypothesis 1, as well as the results of the previous study [6]. Results are statistically significant, and all factors have a positive effect (regression coefficients B are all positive).
Researchers discovered that not all student activity was equally helpful in building grades. If a student clicked more on the interactive annotated examples related to the exam topics only, then his or her activity started to have a positive impact on improvement (Columns 1 and 2 of Rows 2 and 3 in Table 1). This conclusion supports Hypothesis 2.
Explanations of the Results Table
There are two types of the interactive annotated example viewing in terms of the depth: a shallow view (with less than 13% of the interactive annotated examples viewed) and a deeper view (with 13% or more with the interactive annotated examples viewed). Researchers found a significant impact of the depth on students’ improvement. In Rows 2 and 3 of Table 1, R2 values improve from Column 1 to Column 3 and from Column 2 to Column 4; correspondingly, p-values decrease. This supports the research Hypothesis 3.
Table 1 includes the results of the statistical tests in the following three dimensions: 1.
Filtered versus non-filtered activity (data shown in the first two columns verses data shown in the last two columns). The non-filtered activity includes all types of clicks on interactive annotated examples or on lines of code. Filtered activity includes only that activity with a depth >=13% (meaning that 13% or more of the code in the example was viewed).
2.
All types of activity (Columns 1 and 3) versus activity on interactive annotated examples relevant to exam topics (Columns 2 and 4).
3.
Observed values (rows), which include the final grade, the absolute and the relative grade increment on the final test compared to the midterm test.
Everywhere in these rows, coverage depth was used as the independent variable, except the case of the absolute grade increment and the topic-related activity (Row 2, Column 2). In that case, the coverage depth did not give a statistically significant result, and coverage width was used instead. It may have been an anomaly, which could be corrected by increasing the sample size or changing the number of examples.
Analysis
The values of R2 in the last two columns were higher than the same values in the first two columns; it may be concluded that in order to improve scores more,
Regression models were computed for each of the three observed variables and for all data filtering
Vol. IX, No. 1, 2008
185
Issues in Information Systems
Discovering Educational Value Of Interactive Annotated Examples
Table 1. Summary of Regression Analysis
Row 3
Row 2
Row 1
No “sufficiently explored” filtering All activity Topic-related activity Observable Column 1 Column 2 Coverage width Coverage width Final Variable(s) Grade .027 .040 p-value 6.045 5.055 F .829 1.084 B* .287 .252 R2 Coverage width Absolute Variable(s) Grade .004 p-value Increment F N/S 11.919 1.411 B* .443 R2 Coverage depth Relative Variable(s) Grade .013 p-value Increment F N/S 7.924 .292 B* .346 R2 * Regression coefficient, †N/S – no significant results found
Sufficiently explored filtering >=13% All filtered Filtered topicactivity related activity Column 3 Column 4
N/S†
N/S
Coverage depth .020 6.792 25.932 .312 Coverage depth .040 5.030 .267 .251
Coverage depth .002 13.929 28.234 .481 Coverage depth .006 10.465 .299 .411
been viewed by other students. There is interest for a third study here: to discover which browsing behaviors are the most helpful for building the grades.
students need to achieve a certain depth of interactive annotated example coverage (Rows 2 and 3, Columns 3 and 4 of Table 1); this Hypothesis 4. DISCUSSION AND CONCLUSIONS
REFERENCES One of the most curious facts uncovered in this research was the tremendous increase in subjects’ activity after the midterm, as compared to the time period before the midterm. Most likely, this can be explained by the fact they were not aware of the exact type of questions on the tests and of whether their use of the system would be helpful in building their grades. Though students had access to the system throughout the course, the amount of activity increased dramatically immediately before both the midterm and final. This lead researchers to conclusion that the system was mainly used to prepare for the tests; this lead researchers to look at both test-relevant and testirrelevant interactive annotated examples. In the future, motivation for student use of interactive annotated examples will be used. Researchers recommend several thrusts for further research. A study should be designed to look into social navigation of the subjects. Students vary in terms of their navigation behavior; pioneers often click on the interactive annotated examples that no one else viewed; followers prefer to click on the interactive annotated examples that have already
Vol. IX, No. 1, 2008
[1]
Anderson, J. R., & Reiser, B. J. (April 1985). The LISP tutor: It approaches the effectiveness of a human tutor. BYTE 10(4), 159-175.
[2]
Brusilovsky, P. (2001). WebEx: Learning from examples in a programming course, In W. Fowler & J. Hasebrook (Eds.), WebNet 2001 World Conference on the WWW and Internet Proceedings (pp. 124-129). Orlando, FL: Association for the Advancement of Computing in Education (AACE).
[3]
Brusilovsky, P., & Sosnovsky, S. (2005). Individualized exercises for self-assessment of programming knowledge: An evaluation of QuizPACK. ACM Journal of Educational Resources in Computing 5(3).
[4]
Brusilovsky, P., Sosnovsky, S. A., & Shcherbinina, O. (2005). User modeling in a distributed e-learning architecture. Paper presented at the 10th International Conference on User Modeling (UM 2005), Edinburgh, Scotland, UK, July 24-29, 2005.
186
Issues in Information Systems
Discovering Educational Value Of Interactive Annotated Examples
[5]
CUMULATE (Centralized User Modeling Architecture for Teaching). (2008). Retrieved Mar 5, 2008, from http://www.sis.pitt.edu/~paws/ system_cumulate.htm
[6]
Goreva, N., Yudelson, M., & Marshall, B. (2007). Using Webex in a web application programming course. Issues in Information Systems, VIII(12):52–57, 2007.
[7]
Knowledge Tree: Portal for Adaptive Teaching and Learning. (2008). Retrieved January 31, 2008, from http://adapt2.sis.pitt.edu/kt
[8]
Sosnovsky, S., Shcherbinina, O., and Brusilovsky, P. (2003). Web-based parameterized questions as a tool for learning, In A. Rossett (Ed.) Proceedings of World Conference on ELearning (E-Learn 2003), pp. 309-316, Phoenix, AZ: Association for the Advancement of Computing in Education (AACE).
[9]
Weber, G., & Brusilovsky, P. (2001). ELM-ART: An adaptive versatile system for Web-based instruction. International Journal of Artificial Intelligence in Education: Special Issue on Adaptive and Intelligent Web-based Educational Systems, 12(4), 351-384.
Vol. IX, No. 1, 2008
187
Issues in Information Systems