Discovering Patterns in Microsatellite Flanks with Evolutionary Computation by Evolving Discriminatory DNA Motifs Andrew Meade1,2, David Corne1, Richard Sibly2 1
School of Computer Science, Cybernetics and Electronic Engineering, 2 School of Animal and Microbial Sciences, University of Reading, Reading, UK
[email protected],
[email protected],
[email protected]
Abstract: Microsatellites are repetitive regions of DNA which account for a highly significant amount of eukaryotic genomes. They are used as genetic markers and have various uses in the study of natural evolution and phylogeny. However, very little is known about the molecular biology mechanisms which produce microsatellites and even less is known about how and why different kinds of microsatellites occur with different length distributions in the genome. In this study we use a vast amount of microsatellite data from the human genome, and use an evolutionary algorithm to search for DNA patterns which might yield clues about their generation and perhaps their inhibition too. We find that the evolutionary algorithm uncovers several significant patterns which indicate preferences for microsatellites to appear nearby, and other patterns which seem to inhibit microsatellite production. The results show that both attracters and inhibitors to microsatellite production seem to exist, and are motifdependent. We feel this represents a nice example of using evolutionary algorithms to find previously unimagined fuel for molecular biology hypothesis making,
10 or more repeats are very common in the human genome, for example, but should exist in only tiny proportions if chance was the only factor involved in their evolution.
1 Introduction
The process responsible is called replication slippage, and there is currently a surge of interest in understanding how it gives rise to observed distributions of microsatellite lengths, which only very rarely exceed 40 repeats. One of the leading theories suggests that the expansionary tendencies (i.e. insertions) are balanced by point mutations occasionally breaking longer microsatellites into smaller units (Sibly et al, 2001). This builds on classical models such as the stepwise mutation model (Kimura & Otha, 1978), which suggests that replication slippage generally occurs by either inserting or deleting a single repeat, with the same slippage rates. Though often a good fit to the data, the stepwise mutation model has in recent times been found inadequate for fitting data with large numbers of repeats, leading to various caveats and extensions. However, so far within the microsatellite research and modelling community there has been little or no suggestion of what may cause the replication slippage process to occur, and why there is significant variation in the numbers of microsatellites, and distribution of lengths, for different microsatellite motifs.
Microsatellites are repetitive regions of DNA which account for a highly significant amount of eukaryotic genomes. A modern account of current knowledge and research in microsatellites can be found in Goldstein & Schlotterer (1999). They consist of short DNA motifs which are repeated contiguously, and are very common in intergenic DNA. For example, the sequence of nucleotide bases “GCTTGACACACACACGGTCA” contains within it the microsatellite subsequence “ACACACACAC”, which would be written in standard notation as (AC)5, denoting five repeats of the motif AC. The most common and regularly studied microsatellites in genome data are, like this one, dinucleotide repeats (i.e. repeats of a two-base motif). Trinucleotide and tetranucleotide repeats also exist, however, and have been studied. Also, contiguous repeats of a single base are also common in genomes (usually poly-A), and we include these in our study in the guise (for convenience) of dinucleotide repeats where both bases happen to be the same. For those new to this topic, the key point to realise is that microsatellites are phenomena, rather than epiphenomena. That is, they are distinct aspects of the genome which attract significant research effort concerning their creation and evolution, rather than simply being naturally found in DNA by chance. AC microsatellites with
Microsatellites are used as genetic markers and have various uses in the study of natural evolution and phylogeny. However, very little is known about the molecular biology mechanisms which produce microsatellites and even less is known about how and why different kinds of microsatellites occur with different length distributions in the genome. In particular, there is much interest in the mutational processes involved in microsatellites. Essentially, rather than point mutations which arise from occasional errors in the action of DNA polymerase (e.g. the sequence …GCGTACACGC… may be erroneously copied as …GCATACACGC…), the mutational process which leads to microsatellites is believed to be a kind of slippage of the DNA polymerase complex whereby an extra motif repeat gets inserted (e.g. mutation of GCATACACGC to GCATACACACGC), or gets deleted (e.g. from GCATACACGC to GCATACGC).
An emerging notion, however, is that the DNA context in which a microsatellite is found may be such that the DNA polymerase is stabilised (hence restrained from slipping) or destabilised (causing slipping). This may happen, for example, by a kind of resonance effect (a theory under
development by Mike Wilkinson of the School of Plant Sciences, University of Reading) whereby the DNA polymerase is coerced into a destabilisingly high-amplitude resonating state by the sequence of nucleotides it has travelled over before the slippage occurs. Alternatively, the DNA context may attract nearby enzymes whose action may be so as to knock the DNA polymerase momentarily off course. In this study we use a vast amount of microsatellite data from the human genome, and use an evolutionary algorithm to search for DNA patterns which might yield clues about the processes which underpin replication slippage as well as processes that may correlate with its inhibition. We find that the evolutionary algorithm uncovers several significant patterns which indeed seem to indicate preferences for microsatellites to appear nearby those patterns, and other patterns which seem to inhibit microsatellite production. Using an evolutionary search for discriminating DNA patterns, we have thus been able to demonstrate that both attracters and inhibitors to microsatellite production seem to exist, and are motif-dependent. The paper continues as follows: in section 2 we describe the data used in the experiments, and in section 3 we describe the evolutionary algorithm we use to find patterns in the data. Section 4 then presents our results, and section 5 gives a summarising discussion.
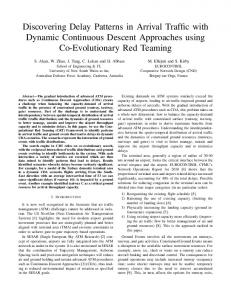
2 Human Genome Microsatellite Data A library of microsatellite data was extracted from the human genome (using the repository held at UCSC http://genome.cse.ucsc.edu/ as of 27th March 2001). Each microsatellite (see below for a precise definition) was extracted along with its flanking regions of 100 nucleotide bases either side of it. In this study we only use the left-hand flank (left-hand in the sense of moving from the 5’ to 3’ direction – see Figure 1). In the case of AC microsatellites there were 43,131 sequences extracted, and the lowest number (for CG microsatellites) was 7,401.
5’ end Flank (100 bases)
MS (>5 bases)
3’ end
need not be perfect. The first base before the start of an XY microsatellite must not be a Y (for example, AC repeats will not count as AC microsatellites if the base immediately before the first AC is a C – in this case it would instead be classed as a CA repeat). This creates a non-symmetrical data set – that is, the set of microsatellites we would find in the 3’ to 5’ direction would be subtly different.
1) ACACACACTCACACAC ^ 2) ACACACACGGACACAC ^^ 3) ACACACACATTCACAC ^^ Figure 2. Three examples of mutations within an AC repeat microsatellite. The first MS deviates from a perfect AC repeat in the ninth base, where A is replaced by T. The AC MS continues after this point mutation. This MS counts as a correct MS since the mutation is in frame. The second example shows a double mutation in the ninth and tenth bases of the MS. Both the A and the C are mutated. This is also acceptable as an AC MS. However, the third case is not considered an AC microsatellite since the mutation crosses a repeat unit. The C in the fifth repeat is mutated to a T and the A in the sixth is mutated to a T.
An analogous dataset was formed for microsatellites with repeat motifs ranging through each of the 16 dinucleotides from AA to TT. Of course, the AA, CC, GG, TT repeats are mononucleotide repeats, but it was convenient to include these (which resulted in interesting results) rather than restrict the study to the remaining 12 dinucleotides. In each case, the set of flanks was further split into the 50 bases closest to the microsatellite (from hereon this is what we mean by the flank) and the 50 bases furthest away, called the control, see Figure 3.
5’ end Control
Flank
MS (>5 bases)
3’ end
Figure 3. The sequence of 50 bases closest to the MS is called the flank for the purposes of the experiments, and the sequence of 50 bases between 100 and 51 bases away are called the control region.
Figure 1. Schematic of a microsatellite with its left-hand flank.
An AC microsatellite (for example) was defined as any number of perfect AC repeats interrupted by a single or double-point mutation. The point mutation must occur on the AC frame of the repeat. An example of acceptable and unacceptable point mutations can be seen in Figure 2. Every microsatellite must have at least one perfect repeat unit followed by five or more repeat units, one of which
A collection of 16 such datasets were therefore collected, one for each dinucleotide repeat. The way in which microsatellites were defined was in common with standard treatments in the microsatellite literature (Goldstein & Schlotterer, 1999). Further, each dataset was pared down so that the only sequences included (where a sequence is 100 bases plus a microsatellite immediately to the right of it) contained no microsatellites in the 100-base flank/control region. This little-affected the amount of data used in the
experiments, and meant that our analyses of the flanking regions were not ‘contaminated’ by microsatellites.
3. Simple Discriminatory Patterns Our approach is to seek DNA patterns which seem to significantly correlate with the nearby presence (or absence) of microsatellites. Searching for patterns in biological sequences is of course far from new. However, biologists have tended to rely on simple ‘consensus’ patterns (essentially averages or base-by-base majority vote patterns) to characterise sequence sets of interest, which tend to be unreliable and of low predictive power. Exact algorithms are also occasionally used, which simply cannot cope with realistic numbers and lengths of sequences. However, Koza et al (1998) have shown how evolutionary computation (Fogel, 1995; Goldberg, 1989) can produce protein motifs in reasonable time which invariably classify better than those offered at PROSITE or similar, while recent work by the authors (Corne et al, 2001) has examined evolutionary computation for producing core eukaryotic gene promoter patterns, finding results competitive with a (at that time) state of the art approach (Reese & Eckman, 1998) which uses neural computation. We describe such DNA patterns next, and the simple evolutionary algorithm which evolves them in the following section. A DNA pattern (often called motif, but the repeated element of a microsatellite is also usually called a motif, hence the change of terminology in this paper) is a sequence of symbols taken form the IUPAC character set, which is given in Table 1. A pattern represents a set of DNA sequences, and is made up of symbols from a 15-character alphabet, ranging from the specific nucleotide bases themselves (A, C, G or T) through to N (which means any of the four nucleotides). Patterns in this alphabet are used to express variability within a set of sequences, and often used to express biological signals or consensus discriminators. For example, the well-known TATA-box (Penotti, 1990) (which seems to signal, although with quite imperfect accuracy, a eukaryotic core promoter region) is expressed by the 7-base pattern TATAWAW. Since W means “A or T”, this stands for 4 distinct DNA sequences which correlate to some extent with the presence of eukaryotic promoters. Such a pattern will either match or not match a specific DNA sequence in the obvious way. For example, RYRR matches each of ATCC and GTGA, but does not match TTGA (since R does not include T). Further, given a DNA pattern p and given a dataset D of n sequences, we can speak of the match score m(p, D), which we can simply define as the number of sequences in D which match DNA pattern p. What we investigated was the idea that such patterns might exist which were able to discriminate regions of DNA close to microsatellites from regions more distant.
Symbol
Meaning
Origin of designation
A
A
Adenine
C
C
Cytosine
G
G
Guanine
T
T
Thymine
R
G or A
Purine
Y
T or C
Pyrimidine
M
A or C
Amino
K
G or T
Keto
S
G or C
Strong interaction (3 H bonds)
W
A or T
Weak interaction (2 H bonds)
H
A, C or T
Not – G
B
C, G or T
Not – A
V
A, C or G
Not – T
D
A, G or T
Not – C
N
A, C, G or T
Any
Table 1: The IUPAC alphabet. A symbol in a motif (first column) corresponds to the subset of nucleotides given in the second column. The third column indicates the origin of the given symbol. E.g. Y stands for “T or C”, since thymine and cytosine are (chemically) both pyrimidines.
A key aspect of seeking such patterns is the scoring function. That is, the assignment of a score to a proposed pattern p which measures how well that pattern discriminates between two sets of data. In particular, we must also worry about the fact that DNA patterns in intergenic DNA will typically be considerably degraded by mutation. We therefore need to take into account the fact that any signals which exist will be shrouded in some degree of noise. A basic way to search for discriminatory patterns, in the notation used above, is as follows. Assume we want to find a pattern which is more likely to occur in set A than in set B. We can reflect the degree of discrimination by the simple function of match scores: m(p, A)/m(p, B). I.e. the ratio of matches to patterns in A to those in B. Alternatively we could use the difference, rather than the ratio; and whether we use ratio or difference, we could think of weighting the two match scores to introduce bias towards presence in A rather than absence from B, for example. In each case, higher values would suggest a better degree of discrimination between A and B, although it is difficult to appropriately tune the extent to which the discrimination allows for, for example, relative significance; a pattern which matches 1000 in A and 500 in B will score worse, in
the ratio method, than one which matches 3 in A and 1 in B, however the former is clearly the more interesting pattern. However, although there are many issues of this type involved in the choice of an appropriate discrimination score, we do not consider them here, leaving that for further work and refinement. However, we do consider the fact that we need to search for patterns which, if they exist, are almost certainly clouded by mutations. Again, this is something which can be done in very many ways, but in this paper we report on what we have tried so far (which seemed adequate to produce interesting results), and have not yet investigated this aspect any further. What we did is as follows: if pattern p matches sequence s it scores 1, as before, however if it is c substitutions distant from a perfect match (i.e. the pattern matches the sequence in all but c loci), then it scores 1/(1+c2). The score m(p, D) for a set of sequences D is now simply the sum of the ‘degraded-match’ scores over all sequences in the set. As before, a pattern receives a score for discriminating between set A and set B which is the appropriate ratio of these scores. We investigated, using evolutionary algorithms (see next section) the hypothesis that interesting discriminatory patterns may exist which distinguish the flank regions of microsatellites from control regions. Such patterns, if they existed and were significant, may lead to new hypotheses about microsatellite evolutionary mechanisms. We also investigated this discrimination the other way around – that is, we searched for patterns which distinguished control regions from flank regions. Any such patterns would arguably indicate factors that may be at play in inhibiting the microsatellite replication slippage process.
of 0.4 of appearing independently at any locus. This ensured the evolutionary algorithm had something to ‘bite’ in the initial population; without such a bias, a randomly generated pattern fro the IUPAC alphabet of length 24 has almost no chance of matching an arbitrarily chosen specific pattern of the same length. Finally, at each iteration of the algorithm either a recombination or a mutation operator was applied to the population. The probability of each operation was 0.5 and this remained constant though out the algorithm.
Initialise population Repeat until termination condition If rand() is less than 0.5 Select two members of the population using binary tournament selection Create a child from the 2 parents. Replace a worst member of the population with the child, if the child is fitter. Else Choose one member of the population via binary tournament selection. Mutate it to produce a child. Replace a worst member of the population with the child, if the child is fitter. End.
4. Evolving Patterns An evolutionary algorithm (EA) (Fogel, 1995) was used to evolve DNA patterns of the type described in the previous section. In each trial run, an initial population of 50 patterns was randomly generated and scored according to the degraded-match fitness function. Our EA for this happens to be a steady-state model using both one-point crossover and uniform crossover. For clarity and replicability, pseudocode is given in Figure 4, and a variety of important additional details are given next. As ever. Much was learned from preliminary runs which led to the following features of the experiments reported here. First, we converged upon 24 bases as an appropriate length of pattern to evolve. Thus, the flank region in our studies was always the 24 bases immediately to the left of the microsatellite, and the control region comprised the sequence of 24 bases furthest to the left (i.e. between 77 and 100 bases to the left inclusive). Next, when generating random patterns for the initial population, we biased the generation of N (all other symbols of the IUPAC alphabet being produced at equal rates). Specifically, N had a chance
Figure 4. Pseudocode of our straightforward evolutionary algorithm. Rand() generates a real number uniformly between 0 and 1. The termination condition in our experiments was simply reaching 15,000 evaluations.
When a crossover operator was employed, it was either uniform crossover or one-point crossover, with equal probability. When mutation is applied, a single locus in the selected parent is randomly chosen, and it is randomly altered to become, with equal probability, any of the 15 symbols in the IUPAC alphabet (i.e. it may stay the same).
5. Experiments and Results For each of the 16 possible dinucleotides XY (including the cases where X and Y are the same) we ran two experiments with the evolutionary algorithm: one to search for patterns which occur in the flank but not the control region, and another to search for patterns in the control but not the flank region. In every such experiment, the EA was run 10 times. Since there were generally between 10,000 and 30,000
sequences in each dataset, each individual trial of the EA took about half a day on a reasonable machine. The result of a single trial run was a pattern sequence with a best score for the degraded-match ratio. We recorded this best-pattern for each of the 10 trials for each of the 32 (16 dinucleotides, 2 experiments each) experiments. Tables 2 and 3 summarise these results in the following way. For each dinucleotide, a number of patterns are given. These are all the best scoring patterns (1 from each of the 10 runs) of the trial runs on the microsatellite data for that dinucleotide. Each such pattern is given along with its score (the degraded-match ratio), its frequency of occurrence in the 10 runs, and then the pattern itself. Table 2 indicates the patterns which are present in microsatellite flanks, while Table 3 gives the inhibitory patterns. For example, near the top of Table 1 we find that a particular pattern consisting of several repeats of RY seems to correlate well with the presence of an AC microsatellite, and in fact this pattern was found in all 10 trials. Meanwhile, three distinct but similar patterns appear in the 10 results for AG.
6. Discussion The results are very intriguing and are the topic of various ongoing analyses. What should be pointed out immediately is the very striking (high-scoring) and reliable pattern found for poly-A regions (the AA ‘dinucleotide’). By investigating this using BLAST, we were quickly able to establish that this pattern matched the 3’ ends of Alu elements and various other common SINEs (Short Interspersed Nuclear Elements). These are short and ancient sequences of DNA whose insertion into a genome is very commonly completed with a poly-A tail. This turned out to be a good validation of the EA’s results. The inhibitory pattern for AA can be similarly explained, corresponding to the Alu sequence between 77 and 100 bases to the left of the 3’ end. In general, there is little immediate explanation available for any of the other discovered patterns, except for (arguably) an idea we denote as the ‘graveyard hypothesis’. It is known that purines preferably mutate to purines and pyrimidines to pyrimidines. Therefore, given something like an AC microsatellite (Purine Pyrimidine, or RY, repeat), point mutations over time seem not unlikely to yield a repeated RY pattern. However, accepting the graveyard hypothesis is far from a dismissal of anything interesting in the results: note that it implies a fairly sharply directed bias of mutation over time towards the trailing ends of a microsatellite. In itself it would require some revision of most of the models of microsatellite mutation in the literature. However, the great majority of patterns in Table 2 suggest that the graveyard hypothesis is certainly not the only explanation. In many cases there seems to be a separate signal which correlates with there being a microsatellite nearby.
33.7 3.29 3.128 3.127 3.174 2.28 2.38 2.18 2.33 2.48 4.84 2.79 3.39 3.29 3.27 3.22 3.18 3.15 3.12 3.10 3.163 3.160 2.9 3.15 3.89 3.88 3.70 3.56 3.52 2.57 2.56 2.31 2.27 2.89 3.17 2.70 2.64 5.08
AA 10 GGYRACASAGYRAGACYCYRYCTC AC 10 NNNNNNDYRYRYRYRYRYRYRYRD AG 8 NNDNRNRDRRNVRRRRVRRGRRMM 1 NNDNRVRDRRNVRRRRVRRGRVMM 1 NNDNAVRDRRNNRRVRVVRGRVMM AT 4 NNNNNNNNNHHHHNDHWHWWAMAM 2 VHVHRHRHVHVHVYVTVTVHVHAM 2 NNNHNHDHNYRHRYRTRYRYRYRM 1 VHVHRNRHVHNHVHVTVTVWDHAM 1 VHVHVHVHVHVHMHVHMHMHAMAM CA 10 NNNNNNHVHRYRYRYRYRYRYRYG CC 7 ACYARCCTGRSYRAHAHRRBRARA CG 1 SKSCCVYCYYKCCSYSNCVRMKCY 2 SBNCCSCYMCGCYNCVVYVSCBYC 1 VHSSSBCSSCRCYNCNVYVRSHHM 1 VVHYNYHCYHVHBNHVSVCRYDMM 1 VYVSVBMYVMVVHNCNMHVVCWYM 1 SNHYVYCCBHVHBVHBSSMRSDHM 1 SNBCCBYCBHKCSNCBVCVRMKCC 1 SNHYVYYYNNVHBVHBSSMRSDHH CT 3 HHNHNYBYVKYHYYYYYYYYYTYV 5 HHBYNYBYVKYHYYYYYYYYYTYV 2 YYBYYYYYYTYYYYYYBYYYBDYV GA 10 VDRRRRRRRRRRRRRRRRRRVRGK GC 2 BHKBRDRHVDRTGHRHGYGYRWKT 4 BHKBRDRHVKRTGHRHGYGYRTKT 1 BHKKRDRHVDRTGHGHGYGYRWGT 1 BHKDDDVNNNRWGHSWGHGHRWGT 2 BHKDDDVHNNRWGHSHGYGYRWGT GG 5 HNNNNNHDNNNNNDNNTTTTTTTT 2 HNNNNNHDNNNNNNNNWTTTTTTT 1 NHNDNNDDDDDBDBNNDKKKWKWT 1 NNNNDNDDDDDKKNBNKKDKWKDT GT 10 NNNNNNNNNYRYRYRYRYRYRYRV TA 10 NNNNNNHNNDHRYRYRYRTRTGTG TC 10 YBBYBBYYYYYYYYYYYYYYYSTK TG 10 NNNNNNNDYRYRYRYRYRYRYRYH TT 10 GYRYVYRCCACCAYRCCYRGCTAA
Table 2: Results for each dinucleotide microsatellite motif (including mononucleotide motifs) when searching for patterns more likely in microsatellite flanks than in the control regions. Below each dinucleotide are given the best scoring motifs which resulted from the 10 EA trials, with those scoring below 2 omitted.
AA 28.0 10 TGAGGYRGGAGAATBRCDTGARCM AC 1.83 1 NNNNNNNNNNNNNDBDBDKRNVBS AG 2.08 6 NBNNNNBNNNNBBHYNNNBYYHBK 2.06 1 NNNNNNBVNNBBNNBNNBBYYHBK 2.05 2 NNNNNNNNNNBBNHBNNNBYYHKG 2.04 1 NNNBNNBNNNBBNNNNNNBYBHKK AT 2.006 1 NNNNNNNNNBBNNNNNVVBSVNBK 2.002 3 NNNNNNNNNBBNNNNBBNSVVNBK CA 2.06 10 NNNNDDNNNNNNDNDNDBDBBHRA CC 2.36 3 BVHVRWKGYKCABRYYWGTWAYMY 2.33 1 BVNVRWKGYKCABRYYWGTWAYMY 2.08 1 BVNVRDBGBDSRBRBBWGWWWYMY CG 3.09 1 DBYBYDKMVHGVDSNNDVKHRSSK 2.91 1 VVHDMHWDBDYHBVMVVDKHYBDR 2.83 1 RVHRMDSHKBSHKSSDNRRYBYDR 2.81 1 MRVHHBWDBRYMMRMNNDDYBSDR 2.65 1 NBYDCDKHSMDHSRMRWRRYDSRK 2.54 2 NHHDHDDMNNKNDNVNDDDNVVDR 2.53 1 DYCSHRGMVSRVBVSVDDNHRVRG 2.51 1 NDNNNDDHDBKHHHNNDDDDVVRD 2.45 1 NNHNNDDNSNKHDNNNKDDNNVDR CT 2.78 6 RYTGRATYATGRRRRYRRRTYTYT 2.49 2 RYKRDWKSATSRDRRBRRDKNHYT 2.48 1 RYKRWWKBATSRDRRBRRDKVWTT 2.34 1 RBKRDWKSRWBVDDRBRRDKVDKT GA 2.07 8 NNNNNNNNNBHNNNBHHYHBBNHM 2.06 1 NNNNNNNNNBHNNNBYHYHBNHYM 2.04 1 HBNNNNNNNNNNNNBHYYHBBNHM GC 2.61 6 DHBDVBHNBHBNHHDNHNHNDBYY 2.57 2 NHYNNYHNBHBHHNNHHNHHDBYY 2.49 1 NHHNBYHNBHBHHNNNHNYNDBYC 2.37 1 DHDDNBNDBHBNNNNNHNHNNBYC GG 1.73 1 VHNVVNNBMMNVHNNHBSHHSNNS GT 1.81 3 NNNNNNNNNNNNNNHHHNYMNHHT TA 1.99 10 NNNNNNNNNNNNNNNBBNVBBHVA TC 1.70 3 DNDNNDVNNDNNBRRDNDNRDNVM TG 1.78 10 NNNNNNNNNNNNNNNNVNVHYBVG TT 4.19 7 WYRGCTCACTGCARSCTCNRCCTY
Table 3: Results for each dinucleotide microsatellite motif (including mononucleotide motifs) when searching for patterns less likely in microsatellite flanks than in the control regions. I.e. these are patterns which seem to inhibit microsatellite style mutations. Below each dinucleotide are given the best scoring motifs which resulted from the 10 EA trials, with those scoring below 2 omitted. However, when no best-found motif scored above 2, the highest scoring motif is shown.
The inhibiting patterns are generally less strong, but still significant (randomisation tests have been done where we individually permute every sequence in the data and then find no pattern with the EA which scores above 2). For example, the pattern DBDBDKRNVBS seems to inhibit the presence of an AC microsatellite immediately to its right. In general, the indication that there seem to be both ‘springboard’ signals and ‘stop’ signals correlated with replication slippage would seem to have consequences for the thriving microsatellite mutation process modelling community. The suggestion is that aspects of the observed distribution of microsatellite lengths could be explained in part by the timescales of mutations occurring in the flank which may inhibit or promote replication slippage downstream. However, perhaps the clearest result pending further analysis is that the evolutionary algorithm has discovered several significant and interesting patterns relating to microsatellites, which are clearly motif-specific.
Acknowledgments We thank the BBSRC and EPSRC for support of the firstauthor, and we also thank Evosolve Ltd for partial support of the second author.
Bibliography Brown, T.A. (1999) Genomes, Bios Scientific Publishers. Corne, D., Meade, A., Sibly, R. (2001) Evolving Core Promoter Signal Motifs, in Proceedings of the 2001 Congress on Evolutionary Computation, IEEE Press. Fogel, D.B. (1995) Evolutionary Computation: Towards a new philosophy of machine intelligence, IEEE Press. Goldstein, D.B. and C. Schlotterer (eds.) Microsatellites: Evolution and Applications, OUP.
(1999)
Kimura M, and T. Ohta (1978) Stepwise mutation model and distribution of allelic frequencies in a finite population. Proceedings of the National Academy of Sciences of the USA, 75, 2868-2872. Koza, J.K., Bennet, F.H., Andre, D. (1998) Using programmatic motifs and genetic programming to classify protein sequences as to extracellular and membrane location. Evolutionary Progranmming VI: Proceedings of the 6th International Conference, Springer LNCS Penotti, F. (1990) Human DNA TATA boxes and transcription initiation sites: a statistical study, Journal of Molecular Biology, 213(1): 37–52. Reese, M. and Eckman, F. (1998) Time delay neural networks for eukaryotic promoter prediction (submitted). Sibly, R., Whittaker and Talbot, (2001) A maximumlikelihood approach to fitting equilibrium models of microsatellite evolution. Mol. Biol Evol. 18, 413-417.