Aug 29, 2011 - most helpful format and under the best conditions, as informed by the previous .... (USPTO) website or Google Patents have attempted to make access to the ...... Method Of Contamination Free Ironing Of Wet State. Substances ...
Proceedings of the ASME 2011 International Design Engineering Technical Conferences & Proceedings of the ASME 2011 International Design Engineering Technical Conferences & Computers and Information in Engineering Conference Computers and Information in Engineering Conference IDETC/CIE 2011 IDETC/CIE 2011 August 28-31, 2011, Washington, DC, USA August 29-31, 2011, Washington, DC, USA
DETC2011-4���� DETC2011- 48322 DISCOVERING STRUCTURE IN DESIGN DATABASES THROUGH FUNCTIONAL AND SURFACE BASED MAPPING Katherine Fu Department of Mechanical Engineering Carnegie Mellon University Pittsburgh, PA, USA
Jonathan Cagan Department of Mechanical Engineering Carnegie Mellon University Pittsburgh, PA, USA
Kenneth Kotovsky Department of Psychology Carnegie Mellon University Pittsburgh, PA, USA
Kristin Wood Department of Mechanical Engineering University of Texas at Austin Austin, TX, USA
ABSTRACT This work presents a methodology for discovering structure in design repository databases, toward the ultimate goal of stimulating designers through design-by-analogy. Using a Bayesian model combined with Latent Semantic Analysis for discovering structural form in data, an exploration of inherent structural forms, based on the content and similarity of design data, is undertaken to gain useful insights into the nature of the design space. In this work, the approach is applied to uncover structure in the U.S. patent database. More specifically, the functional content and surface content of the patents are processed and mapped separately, yielding structures that have the potential to develop a better understanding of the functional and surface similarity of patents. These results may provide a basis for automated discovery of cross domain analogy, among other implications for creating a computational design stimulation tool.
1. INTRODUCTION There are many methodologies and philosophies for achieving effective engineering design, one proven approach to achieving innovative solutions being ‘design-by-analogy’ [1]. Design-by-analogy is a process in which designers use design solutions from other domains in order to gain inspiration or insight for the design problem at hand. Design-by-analogy is
becoming more popular with designers in industry. Some examples include applying MEMS technology to the manufacture of photovoltaic cells, using video game technology to inspire the control of a BMW, or using Formula 1 vehicle suspension systems as inspiration for Nike shoe shock absorption technology [2, 3, 4, 5]. This method remains challenging, however, due to the lack of a practical, efficient, procedural way to find these meaningful analogies. The work presented here attempts to make progress toward a solution to that challenge. 1.1 Understanding Design-by-Analogy through Cognitive Studies The way humans form concepts about design is important to understanding the use of analogies. Bloom found that when adult humans attempt to categorize artifacts in to artifact kinds, the function of the artifact is not the only important component in making this judgment, but also the physical appearance. More importantly, he conjectures that the crucial factor in determining artifact kind lies in the intention of the creator of the artifact [6]. This work is directly related to humans’ ability to find and use analogies in design. If designers find a design solution or technology with potential for analogical transfer (a source artifact) and categorize it as a particular artifact kind, their ability to transfer that knowledge to an alternate artifact kind or application may be hindered by previous categorization of the artifact.
1
Copyright © 2011 by ASME
Downloaded 25 Aug 2012 to 128.83.63.20. Redistribution subject to ASME license or copyright; see http://www.asme.org/terms/Terms_Use.cfm
Defeyter and German found that artifact concepts play an important part in problem solving, and that the intended purpose leads to their concept of artifact function [7]. Thus if humans naturally struggle to re-purpose artifacts when primed with their intended use, there may be implications for the conditions under which analogical transfer is more likely to occur. Analogy and external stimuli in engineering design has been studied in a number of ways. Studies have been performed to understand how the introduction of analogies affects the ideation process and outcomes [8, 9, 10, 11], with some studies specifically examining how the introduction of analogies with different levels of applicability to the design problem affects individual designers [12, 13]. In addition, work has been done to better understand when and how the introduction of external stimuli to designers is most beneficial to design outcomes. For example, it has been shown that if subjects have “open goals” (i.e., unsolved problems) in mind when exposed to information that could be relevant to the design problem, those open goals can aid problem solving [14, 15]; this open goal effect is achieved by giving subjects supplemental valuable information, or hints consisting of distant or unobvious information, only after solving has already begun. Tseng et al. further studied the effect of open goals in combination with manipulating the type of external stimuli introduced. They found that giving subjects information that was analogous but distantly related to the design problem caused them to produce more solutions with more diversity and a higher level of novelty when open goals existed; in the absence of open goals (i.e., prior to the introduction of the problem to be solved), highly similar analogous information was more easily applied than distantly related analogous information [13]. Negative effects of introducing analogical information or examples are possible as well, a main one being design fixation [16, 17, 18, 19], or the “blind adherence to a set of ideas or concepts limiting the output of conceptual design” [16]. Jansson & Smith showed that introducing examples can cause designers to generate solutions that mimic the examples, to the point of violating the design problem objectives [16]. Ward et al. showed that designers included aspects of examples in their solutions, even when explicitly told not to, implying that they have little control over the degree to which they are influenced by examples they see [20, 21]. The extension of the work presented here is to facilitate the use of analogy to inspire designers, with the presupposition that these external stimuli would be introduced at the appropriate point in ideation, in the most helpful format and under the best conditions, as informed by the previous research outlined above. 1.2 Design Tools and Computational Design Aids A significant area of research in engineering design is the creation of computational tools to aid designers during the design process. Stone and Wood created a functional basis in
order to provide a universal language to facilitate functional modeling, a useful tool in the ideation process [22]. This functional basis work has been extended and adapted a great deal, one example of which is a biological functional basis [23]. This functional basis and language of design work is crucial to the work presented here, as it informs the exploration of functional interrelatedness of patents as compared to surface interrelatedness. The U.S. patent database has been a focus of computational design aids for its convenient cataloguing of extant technology and engineering design. TRIZ uses heuristic rules (such as use of opposites) to help engineers overcome impasses in functional reasoning by searching through patents [24]. TRIZ and functional basis have been combined to create an axiomatic conceptual design model [25]. Patent citation data has been used to find the interrelatedness between technologies, and the benefits of tapping into the technology knowledge base created by competitors within a particular design field [26]. Syntactic similarity between patent claims has been explored for the purpose of aiding in patent infringement research [27]. Patent repository tools and patent mining have been used to ascertain potential future market trends, recognize prolific inventors, and more, for business purposes. The mining of these patents included characterizing them by the number of citations, number of claims, average number of words per claim, number of classes that the patent spans, etc. [28]. Bohm et al. used the Design Repository at Oregon State University to perform a function based search using Chi Matrix and Morphological Matrix techniques to find components that were present in concepts generated by hand, showing the potential for a computational design aid tool [29].Our work focuses on using the textual content of the patents, which it is hoped will allow for richer outcomes. In addition, design repositories in general, not necessarily populated with patent data, have been explored as resources for designers, serving as ways to share and reuse designs to streamline the product design of complex engineering systems [30]. This previous design repository work involved storing CAD models of components and assemblies for future design applications in a central database, allowing designers to save time and perhaps gain insight into previous models and designs. Our focus is on structuring design repositories and more open ended analogical transfer. Koch et al. created a tool called PatViz, which allows for visual exploration of iterative and complex patent searches and queries using all types of patent data, including full text. One graph view within this tool is created by the user in a guided process, not through an algorithm. There are three visualizations of interest within the tool called Patent Graph, which is a fully connected web of patents, and 3D IPD Treemap, which is a 3D tree structure of the patents based on a predefined classification schema, and the Aggregation Tree, which is another tree view that deals with predefined adjustable hierarchies [31]. The important difference between the work of Koch et al. and the work presented here is that the structures
2
Copyright © 2011 by ASME
Downloaded 25 Aug 2012 to 128.83.63.20. Redistribution subject to ASME license or copyright; see http://www.asme.org/terms/Terms_Use.cfm
within the PatViz tool are either predefined or user-defined classification schemes, while this work uses an exploration methodology to discover the best (and multiple different) structures to describe the set of patents. The form of the structure itself changes as the data being examined changes. A BioMedical Patent Semantic Web was created by Mukherjea et al., which found semantic associations between important biological terms within biomedical patents and returned a ranked list of patent resources and a Semantic Web that displays the relationships between the important terms and between resources. This work was performed with the intent of aiding in avoiding patent infringement. The Semantic Webs are fully connected graphs with no imposed structure, and the data used only includes the abstract of the patents being examined. In addition, the webs were not generated using a Bayesian inference approach [32]. Chakrabarti et al. used a topic model, which employs Bayesian inference to train a model on a small data set of documents and then automatically categorize the remaining documents into “topics,” leading to a taxonomy or hierarchical structure [33]. That work does not explore structures other than hierarchies, and is not applied to the exploration of these structures as fodder for analogical design work. As stated previously, it is logical to turn to the U.S. patent database as an effective repository of analogical or cross-domain design solutions. However, due to the size and complexity of the U.S. patent database, it’s difficult to make it useful to designers. There have been many attempts to automate, aid, or streamline the search of the US patent database. Tools like TRIZ and even the simple key word search on the United States Patent and Trademark Office (USPTO) website or Google Patents have attempted to make access to the information more streamlined, but it is still difficult to understand the characteristics relevant to a design problem within the ‘space’ of patents [24]. With a way to extract the interrelatedness and interconnectedness of patents in the space, designers might be able to strategically choose which cross-domain designs to expose themselves to, or even traverse the space in a more intentional and meaningful exploratory way. By allowing for more efficient and insightful access to external analogical stimuli, designers have the potential to create more innovative design solutions. The algorithm and methodology behind discovering this interrelatedness, or structure, within a patent space, or design repositories in general, is presented next. 1.3 Bayes and Discovering Structural Form Bayesian models have been used to describe human cognition for centuries [34]. Jaynes describes human plausible reasoning as a calculation of the degree of plausibility of a particular hypothesis being true based on previous experience and common sense, and given the facts at hand, corresponding directly to the components that must be considered when calculating the posterior probability of a hypothesis being true given a set of data using Bayes Rule [35]. This link between
the Bayesian algorithm and human cognition is crucial to the motivation behind this methodology. It is hoped that the structures of patents will be closer to human structuring of data or information, and therefore more easily understood and useful. Although finding the structure in data is not an easy or new problem, it has the potential to yield valuable insights if successful. Linneaus’ discovered that living organisms are best described by a tree structure, or Mendeleev found the periodic structure of the elements [36]. More elementary to understanding and discovering structures, however, is clustering and categorization of data. Categorization is a topic that has been studied both in human cognition and in modeling human cognition [37, 38, 39, 40, 41]. Methods such as Latent Dirichlet Analysis and Latent Semantic Analysis (LSA) have been used to categorize documents based on the text within them, extracting taxonomies and semantic similarity [42, 43, 44, 45]. LSA will be discussed in more detail, as it is a main component of the methodology presented for discovering structural form in a patent space. However, first we review Bayesian reasoning. Bayes Rule is a result of elementary probability theory. Given two random variables A and B, which respectively can take on values a and b, the following relationship describing the joint probabilities and a and b are true: P(a,b) = P(a|b)P(b) P(a,b) = P(b|a)P(a)
(1) (2)
Setting equations (1) and (2) equal, we can rearrange them to be Bayes Rule: P(b|a) = P(a|b)P(b) P(a) (3) There are four terms in Bayes Rule, each with an important significance. For example, consider a problem in which an agent is trying to infer a process responsible for generating data, d. h is a hypothesis about what this process could be [34]. Bayes Rule for this scenario is written as: P(h|d) = P(d|h)P(h) P(d) ,
(4)
where the following can be defined: 1. The “Prior Probability” – P(h), the probability that agent ascribes h is the true generating process, independent of data d. 2.
The “Posterior Probability” – P(h|d), how agent should change beliefs in light of d – or, the degree of belief in h conditioned on observation of d.
3.
The “Likelihood” – P(d|h), the probability of the data given the hypothesis, reweights each hypothesis by how well it predicts the data.
3
Copyright © 2011 by ASME
Downloaded 25 Aug 2012 to 128.83.63.20. Redistribution subject to ASME license or copyright; see http://www.asme.org/terms/Terms_Use.cfm
4.
The “Marginal Probability” – P(d), the probability distribution associated with d, calculated by summing over the other variable(s) in the joint distribution, where P(d) = Σh’ЄHP(d|h’)P(h’)
(5)
and h’ is an alternative hypothesis, H is the set of all hypotheses considered. The posterior probability, the left hand side of Bayes Rule, is calculated using the other three terms described above [34]. Kemp and Tenenbaum use this formula to calculate the probability that the data has structure S and form F given data D. A form is defined by the graph grammar that is used to create it. These forms include a partition, chain, order, ring, tree, hierarchy, grid, and cylinder, described in more detail in Section 1.4. These structures originate from psychology literature [46] and appear in formal models in many different research efforts [47-58]. One example from the work of Inhelder and Piaget is the classification scheme that children use in simple logic operations – which is based on a tree structure and an order. Kemp and Tenenbaum argue that the structural forms included in the algorithm are often and commonly found, are “useful for describing the world, and that they spring to mind naturally when scientists seek formal descriptions of a domain.” [36] A structure S is a particular instantiation of a form F. To be clear, a graph of data D with a certain form can be represented by a number of different configurations, or structures. The three terms that go into calculating this posterior probability, which serves as the score of a particular structural form within the algorithm, were chosen and calculated as follows [36]: P(S, F|D) α P(D|S) P(S|F) P(F),
rules (graph grammar) is given that describes how the structural form is generated. 1.5 Latent Semantic Analysis In our work, Kemp and Tenenbaum’s algorithm is combined with pre-processing and post-processing using Latent semantic analysis (LSA), a computational text analysis tool that extracts contextual similarity of documents and words [43, 44, 45]. LSA has four main steps: 1.
A word-by-document matrix is created, in which the columns are the individual text passages (here, the patents), the rows are the words that appear in the documents, and the cells are populated by a tally of the number of times each word appears in each document.
2.
An “entropy weighting” step is performed, a two part transformation on the word-by-document matrix that gives a more accurate weighting of the word-type occurrences based on their inferred importance in the passages.
3.
Singular value decomposition (SVD) is performed on the transformed matrix, with an output of three matrices (U, S, and V). U and V are orthonormal matrices whose rows and columns correspond respectively to the words and documents in the LSA space. S is a diagonal matrix of singular values. Dimensionality reduction of the LSA can be performed by altering the S matrix to only contain the top n values along the diagonal, which can eliminate noise and lead to better results in analyses with large corpora. However, due to the small size of the corpora used in the example in this paper (25 patents, although the methodology can in principle handle a much larger number), full dimensionality was maintained.
4.
The cosine similarity between documents can then be calculated by multiplying S and the transpose of V and calculating the dot product between all pairs of resulting vectors. This yields what is essentially a matrix of document-to-document coherence values. These values range from -1 to 1, where -1 signifies a perfect negative correlation, 1 signifies a perfect positive correlation, and 0 signifies that there is no correlation. Thus, if two documents were exactly the same, a value of 1 would be output for that cosine similarity [43, 44, 45].
(6)
where: 1. P(F), the prior on the space of forms, is a uniform distribution over the forms under consideration. 2.
P(S|F), the prior on the structures, favors graphs where k, the number of clusters, is small: P(S|F) α θk if S is compatible with F, and P(S|F) = 0 otherwise; here, θ = e-3.
3.
P(D|S), the likelihood, measures how well the structure S accounts for the data D. P(D|S) will be high if the features in D vary smoothly over the graph S, that is, if entities nearby in S tend to have similar feature values.
4.
The normalizing constant, the marginal probability, is calculated using set theory, as a sum of the products of the number of F-structures with k occupied cluster nodes and the number of ways to partition n elements into k nonempty sets.
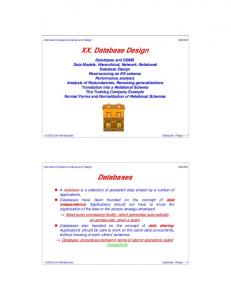
1.4 Structural Form Descriptions The possible structural forms to consider with the algorithm are described in Figure 1 [36, 59]. For each type of structural form, a form is shown and a language of generative
2
METHODOLOGY
There are three parts to producing structures that model the patent (or other design) database. First, LSA is used to pre-process the patents and generate similarity data. Second, the algorithm devised by Kemp and Tenenbaum is used to discover structural forms in the patent data, using the output from LSA as input. Third, LSA is used to find the sets of words with the highest cosine similarity to each patent and connection between patents for the purpose of labelling the
4
Copyright © 2011 by ASME
Downloaded 25 Aug 2012 to 128.83.63.20. Redistribution subject to ASME license or copyright; see http://www.asme.org/terms/Terms_Use.cfm
Partition: Unconnected clusters of patents Generative Process Structural Form
Hierarchy: A hierarchy has objects located internally, but a tree may only have objects at its leaves Generative Process Structural Form
Chain: Serially connected clusters of patents Generative Process Structural Form Tree: A tree can only have objects at its leaves, internal nodes are required to be empty Generative Process Structural Form
Order: Serially or parallel connected clusters of patents Generative Process Structural Form
Grid: The Cartesian graph product of two chains Generative Process Structural Form
Cylinder: The product of a chain and a ring Generative Process Structural Form Ring: Circular connected clusters of patents, seed is a node with a self-connection Generative Process Structural Form
FIGURE 1: VERBAL AND PICTORIAL DESCRIPTIONS OF STRUCTURAL FORMS AND THEIR GENERATIVE PROCESSES
structures. This structures alone processing use of the meaning of structures.
last step is an important enabler, as the are difficult to interpret, but the postLSA allows for the automatic assessment of the nodes and clusters in the resulting
2.1 Pre-processing with LSA LSA is used in this work to generate “similarity” data for input into the structural form discovery algorithm. Given an initial set of patents, the abstract and description of the patents are first parsed from HTM text. Using a part-of-speech (POS) tagger, the verbs, adverbs, adjectives and nouns are
tagged separately for each patent, and repeat words are included. The set of patents is reduced to only verbs for one data set, the functional data set, and only nouns for the second data set, the surface data set. This concept is derived from the work of Stone and Wood, in which the authors discuss how the part of speech of a word indicates its roll in design descriptions [22]. Verbs tend to describe functionality because they correspond to what something does or should do. Nouns tend to describe components, applications, or elements of a design, and thus are chosen here to represent surface attributes of the patents. Further work could include an expansion on this
5
Copyright © 2011 by ASME
Downloaded 25 Aug 2012 to 128.83.63.20. Redistribution subject to ASME license or copyright; see http://www.asme.org/terms/Terms_Use.cfm
concept, including non-infinite verb forms in the function data set and adjectives in the surface data set. LSA, as described in Section 1.5, is then run on both data sets of the set of patents. Two symmetric cosine similarity matrices are produced, describing the similarity between the patents based on the functional or surface text within the patents. These matrices serve as the input similarity data for the algorithm for discovering structural form. Note that this data is not dissimilar in form from the similarity data used in Kemp and Tenebaum’s work, for example, the face recognition data [36]. Kemp and Tenenbaum did not use LSA to generate the data, however. This LSA pre-processing step does not alter the functionality of the algorithm devised by Kemp and Tenenbaum, but rather serves as an input data generation step. 2.2 Discovery of Structural Form The algorithm for discovering structural form as it is applied to the LSA output patent similarity data includes the following steps [36, 59]: 1.
Pre-process the feature data D by shifting the mean of the matrix to zero. Calculate normalized covariance matrix for D, defined as (1/m)DDT, where m is the number of features, or non-redundant non-trivial words included in the entire set of patents. Shifting the mean of D to zero normalizes the feature matrix to allow the calculated covariance to be comparable to the “empirical covariance.”
2.
Find the form F and the structure S of that form that best capture the relationships between these patents by maximizing the posterior probability – the probability that the data has structure S and form F given data D; i.e., search for the structure S and form F that jointly maximize the scoring function P(S, F|D). For example, the patents might best fit into the structural form of a tree.
3.
To identify the structure and form that maximize the posterior, a separate greedy search is run for each candidate form: •
All patents are assigned to a single cluster.
•
The algorithm splits a cluster at each iteration, using a graph grammar that builds the structure (such as a tree) after each split.
•
Attempt to improve the score using several proposals, including proposals that move an entity from one cluster to another and proposals that swap two clusters.
•
The search concludes once the score can no longer be improved.
All eight forms, the partition, chain, order, ring, tree, hierarchy, grid, and cylinder, all shown in Figure 1, were used as candidate forms. The output of this step of the methodology is the best structure (instantiation) of each candidate form, and the associated posterior probability. Using the posterior
probability values, the best structure can be identified. In the results section, we focus on just the best structure as determined by the algorithm, though later work will explore the meaning and value of alternative structural representations of the data that are not the “best” in terms of posterior probabilities, but may have other useful meanings.1 2.3 Post-processing with LSA The third step in the methodology employs LSA once again. The purpose of the post-processing is to create an automated way to be able to analyze the meaning of the connections between patents in the structures that are output with a characterization of the connections between or clustering of patents. If one attempted to understand the raw output from the algorithm, it would require extensive cross referencing between patent documents and the structure, juggling many pieces of information at once. This post-processing allows for a “snapshot” of the meaning of the connections to be seen. LSA is again used, this time to find rank all of the words in the space from highest cosine similarity value to lowest with respect to each patent. These rankings are then summed across combinations of patents (those associated through a connection or common cluster), and re-ranked to find the collective set of words that are most similar to the set of patents of interest. This set of words, here chosen to be the collective top five most similar words within a specific grouping of patents (although any number can be chosen), are then printed on the structures to characterize the connectivity between patents. If there is only one patent in a cluster, the most similar words to that one patent are printed. This step allows for the structures to be more easily interpretable, and for a way to gain a better understanding of why the connections in the structures exist in each particular configuration. The results of this methodology are presented next. 3
RESULTS AND DISCUSSION
The methodology was performed on a space of 25 patents for this work. The patent index in Figures 2-5, corresponding U.S. patent number, and patent title are included in Appendix A for reference. This methodology can, and in future work will, be applied to spaces including a much larger quantity of patents. The best structural form for the function data set (based on verbs) found by the algorithm was the cylinder, shown in Figure 2. Each of the three levels of the cylinder consists of a ring structure, as the cylinder is the Cartesian graph product of the chain and the ring form. Each level was rendered in a different line for ease of comprehension. The labels are situated on the structure such that each cluster is described by the set of five words closest to it. The first thing 1 The authors make the assumption that the algorithm produces valid results from a computational standpoint, as confirmed by the synthetic data analyses performed by Kemp and Tenenbaum. Due to the fact that the algorithm itself was unchanged, this is a valid assumption.
6
Copyright © 2011 by ASME
Downloaded 25 Aug 2012 to 128.83.63.20. Redistribution subject to ASME license or copyright; see http://www.asme.org/terms/Terms_Use.cfm
FIGURE 3: RING STRUCTURE BEST FIT TO SURFACE DATA SET
FIGURE 2: CYLINDER STRUCTURE BEST FIT TO FUNCTION DATA SET
to note about this structure is that adjacent nodes, both within the rings and vertically along the chains, have functions in common; for example, on the lower level ring, adjacent nodes with patents 11 and 24 share the function “contain;” patents on the middle ring in the two most populated clusters share the function “extract;” vertically, nodes containing patents 15 and 21 share the function “receive.” In addition, the collection of nodes within an entire ring level in the structure has functionality in common. For example, taking synonymy into consideration, the middle level of the cylinder has nodes with the following commonly themed words: belong, accord, classify, include, contain. This continuity of functionality within the structure is exciting, as it implies that the structure can be traversed in a meaningful way by a designer seeking inspiration. For example, a designer could be given a starting point in a structure by adding a description of the design problem as one of the documents in the patent space and finding where the design problem is placed in structure. From there, a designer could look to adjacent nodes for desired similar functionality. Alternatively, a designer could find a key functionality in the labels on the structure and explore the patents contained in the corresponding cluster or adjacent clusters. We hope that this type of guided exploration of the patent space will save the designer time, as compared to searching the USPTO website or other sources of analogical inspiration, and also contribute novel, inspirational, and relevant external stimuli. As the patent space grows and the algorithm is run on much larger data sets, we expect the structures to become more complex and richer. More patents will allow for a smoother continuity of functionality over the structure, as there will be more fodder for transitions between
nodes. We also expect that the clusters will become larger as more patents with more in common enter the space. The algorithm is currently run to favor simpler structures, or rather structures with fewer nodes; so as the patent space grows, this leads to larger clusters as opposed to smaller clusters in larger quantities. The best structural form found for the surface data set (based on nouns) was the ring, shown in Figure 3. It is exciting to consider the fact that the surface data set and function data set yielded different forms as the best fit. This indicates that the space of patents has a different underlying interrelatedness when looking at the patents from a surface similarity perspective compared to from a functional similarity perspective. Similar to the function based structure, the surface structure has adjacent nodes with common surface features. For example, the two clusters at the bottom of the structure share the feature “pixel,” and traveling clockwise, the next cluster shares the feature “determination” with the large cluster. This type of structure could be useful to a designer if she were interested in a particular area of application or component. For example, if a designer was working on a problem related to computer imaging technology, she could look to the clusters labeled with “pixel,” “imaging,” etc. to potentially find relevant technology or perhaps even near-field analogical inspiration. As described previously, the design problem could be entered as a document into the space providing the designer with a starting point from which to explore adjacent nodes for relevant surface similar designs. Another interesting way this structure might be used is in combination with the function based structure. If a crossdomain analogy was discovered through functional similarity
7
Copyright © 2011 by ASME
Downloaded 25 Aug 2012 to 128.83.63.20. Redistribution subject to ASME license or copyright; see http://www.asme.org/terms/Terms_Use.cfm
FIGURE 4: GRID STRUCTURE SECOND BEST FIT TO FUNCTION DATA SET FIGURE 5: HIERARCHY STRUCTURE SECOND BEST FIT TO SURFACE DATA SET
by exploring the function structure, the area of application could be further explored by then looking to the surface based structure. Further analogical transfer could be achieved through the exploration of the surface features that are associated with the desired functionality – switching between the function based and surface based structure by discovering a patent or design of interest in one structure, and locating it in the other structure. For the sake of exploring different representations of the patent spaces, we also included the second best structure found for each data set. Figure 4 shows that the second best form to describe the function data set is the grid. The second best form to describe the surface data set is the hierarchy, the structure for which can be seen in Figure 5. Once again, notice the continuity of functionality and surface features in both Figures 4 and 5. The exciting outcome of using the structural form discovery algorithm is that the space of designs, here patents, can be represented in many ways. For the purposes of stimulating design, multiple representations have been shown to be beneficial to the design process [10]. The algorithm serves to uncover structure that could produce innovative thought and previously unconsidered relationships. Therefore, the success of the algorithm is determined by the usefulness of the output to designers, rather than by a comparison to a known empirical or analytical solution. The authors are currently conducting cognitive studies to confirm the “construct validity” of this application of the algorithm to patent data by testing the effect of its output on the quality, quantity, and novelty of design solutions produced by engineering designers. In addition, further work is being done to understand from a cognitive perspective how designers
might use and interact with these different structures and structural representations in general. 4
CONCLUSIONS
The goal of this work is to create a foundation for a computational design tool that allows designers to have automatic access to analogical stimuli from a design repository. We have introduced a methodology that combines Latent Semantic Analysis pre-processing and post-processing of the data with Kemp and Tenenbaum’s Bayesian model for discovering structural form [36]. We have shown that this methodology, as applied to a repository of random designs from the U. S. patent database, pre-processed to contain only function based content and only surface based content, has promising implications for the development of a computational design tool. The method has proven to produce diverse structures of patent data that lead to insights regarding the functional or surface relatedness of individual or groups of patents. 5
ACKNOWLEDGMENTS
The authors would like to than Dr. Christian Schunn for his discussions on this work. This work is supported by the National Science Foundation, under grant CMMI0855326. 6
REFERENCES
[1] Ullman, D. G., 2003, The Mechanical Design Process, 3rd Edition, McGraw-Hill Companies, New York, 158-159.
8
Copyright © 2011 by ASME
Downloaded 25 Aug 2012 to 128.83.63.20. Redistribution subject to ASME license or copyright; see http://www.asme.org/terms/Terms_Use.cfm
[2] “Cross-Industry Innovation,” Business Process Optimization, European CEO, www.zuehlke.com/fileadmin/pdf/fachartikel/124_cd_europ ean_ceo_cross_innovation.pdf, Accessed 9 April 2009. [3] Basantani, M., “The MagLev: The Super-powered Magnetic Wind Turbine,” Inhabitat Energy, http://www.inhabitat.com/2007/11/26/super-poweredmagnetic-wind-turbine-maglev/, Accessed 9 April 2009. [4] Linder, P., “Leveraging Novel MEMS Technologies for Next Generation Photovoltaic Applications,” Semiconductor International, http://www.semiconductor.net/article/CA6576216.html, Accessed 11 April 2009. [5] Herstatt, C. and Kalogerakis, K., “How to Use Analogies for Breakthrough Innovations,” http://biblioteca.universia.net/html_bura/ficha/params/id/3 9800023.html, Accessed 11 April 2009. [6] Bloom, P., 1996, "Intention, History, and Artifact Concepts," Cognition, 60(1), 1-29. [7] Defeyter, M. A., and German, T. P., 2003, "Acquiring an Understanding of Design: Evidence from Children's Insight Problem Solving," Cognition, 89(2), 133-155. [8] Dahl, D. W., and Moreao, P., 2002, “The Influence and Value of Analogical Thinking During New Product Ideation,” J. of Marketing Res., 39, February, 47-60. [9] Goldschmidt, G., and Smolkov, M., 2006, “Variances in the Impact of Visual Stimuli on Design Problem Solving Performance,” Design Studies, 27, 549-569. [10] Linsey, J. S., Wood, K. L., and Markman, A. B., 2008, “Modality and Representation in Analogy,” Artif. Intell. for Eng. Des., Anal. & Mfg., 22, 85-100. [11] Christensen, B. T., and Schunn, C. D., 2005, “Spontaneous Access and Analogical Incubation Effects,” Creativ. Res. J., 17(2-3), 207-220. [12] Christensen, B. T., and Schunn, C. D., 2007, “The Relationship of Analogical Distance to Analogical Function and Preinventive Structure: The Case of Engineering Design,” Mem. & Cog., January, 35, 29-38. [13] Tseng, I., Moss, J., Cagan, J., and Kotovsky, K., 2008, “The Role of Timing and Analogical Similarity in the Stimulation of Idea Generation in Design”, Design Studies, 29, 203-221. [14] Moss, J., Kotovsky, K., and Cagan, J., 2007, “The Influence of Open Goals on the Acquisition of ProblemRelevant Information,” J. of Exp. Psych., 33(5), 876-891. [15] Moss, J., Cagan, J., and Kotovsky, K., 2007, “Design Ideas and Impasses: The Role of Open Goals,” ICED (114), Paris, France, 1-10. [16] Jansson, D. G., and Smith, S. M., 1991, “Design Fixation,” Design Studies, 12, 3-11. [17] Smith, S. M., and Blankenship, S. E., 1991 “Incubation and the Persistence of Fixation in Problem Solving,” Amer. J. of Psych., 104 (1), 61-87. [18] Purcell, A. T., and Gero, J. S., 1996, “Design and Other Types of Fixation,” Design Studies, 17, 363-383.
[19] Chrysikou, E. G., and Weisberg, R. W., 2005, “Following the Wrong Footsteps: Fixation Effects of Pictorial Examples in a Design Problem Solving Task,” J. of Exp. Psych.: Learn., Mem., & Cog., 31 (5), 1134-1148. [20] Marsh, R. L., Ward, T. B. and Landau, J. D., 1999, “The Inadvertent Use of Prior Knowledge in a Generative Cognitive Task,” Memory & Cognition, 27 (1), 94-105. [21] Smith, S. M., Ward, T. B. and Schumacher, J. S., 1993, “Constraining Effects of Examples in a Creative Generation Task,” Memory & Cognition, 21(6), 837-845. [22] Stone, R. and Wood, K. L., 2000, “Development of a Functional Basis for Design,” J. of Mech. Des., Vol 122, 359 – 370. [23] Cheong, H., Shu, L. H., Stone, R., and Wood, K. L., 2008, “Translating Terms of the Functional Basis into Biologically Meaningful Keywords,” Proceedings of the ASME International Design Engineering Technical Conference, New York, NY, USA, 3-6 August. [24] Rantanen, K., and Domb, E., Simplified TRIZ: New Problem Solving Applications for Engineers and Manufacturing Professionals, CRC Press, 2002. [25] Zhang, R., Cha, J., and Lu, Y., 2007, “A Conceptual Design Model Using Axiomatic Design, Functional Basis and TRIZ,” Proceedings of the 2007 IEEE IEEM, 1-42441529-2/07. [26] Chakrabarti, A. K., Dror, I., and Nopphdol, E., 1993, “Interorganizational Transfer of Knowledge: An analysis of Patent Citations of a Defense Firm,” IEEE Transactions on Engineering Management, Vol. 40, No. 1. [27] Indukuri, K. V., Ambekar, A. A., and Sureka, A., 2007, “Similarity Analysis of Patent Claims Using Natural Language Processing Techniques,” International Conference on Computational Intelligence and Multimedia Applications, 0-7695-3050-8/07, 13-15 December. [28] Kasravi, C., and Risov, M., 2007, “Patent Mining – Discovery of Business Value from Patent Repositories,” Proceedings of the 40th Hawaii International Conference on System Sciences, 1530-1605/07. [29] Bohm, M.R., Vucovich, J.P., and Stone, R.B., 2005, “Capturing Creativity: Using a Design Repository to Drive Concept Innovation,” Proceedings of DETC2005, DETC05/CIE-85105, Sept. 24-28, Long Beach, California. [30] Szykman, S., Sriram, R. D., Bochenek, C., Racz, J. W., and Senfaute, J., 2000, “Design Repositories: Engineering Design’s New Knowledge Base,” IEEE Intellegent Systems, 1094-7176/00, 48-55. [31] Koch, S., Bosch, H., Giereth, M., and Ertl, T., 2009, “Iterative Integration of Visual Insights during Patent Search and Analysis,” IEEE Symposium on Visual Analytics Science and Technology, Atlantic City, NJ, USA, Oct. 11-16. [32] Mukherjea, S., Bhuvan, B., and Kankar, P., 2005, “Information Retrieval and Knowledge Discovery Utilizing a BioMedical Patent Semantic Web,” IEEE
9
Copyright © 2011 by ASME
Downloaded 25 Aug 2012 to 128.83.63.20. Redistribution subject to ASME license or copyright; see http://www.asme.org/terms/Terms_Use.cfm
Transactions on Knowledge and Data Engineering, Vol. 17, No. 8., 1099-1110. [33] Chakrabarti, S., Dom, B., Agrawal, R., and Raghavan, P., 1998, “Scalable Feature Selection, Classification and Signature Generation for Organizing Large Text Databases into Hierarchical Top Taxonomies,” The VLDB Journal, 7, 163-178. [34] Griffiths, T. L., Kemp, C., and Tenenbaum, J. B., 2008, “Bayesian models of cognition” In R. Sun, editor, The Cambridge handbook of computational cognitive modeling. Cambridge University Press. [35] Jaynes, E. T., 2003, Probability theory: The logic of science, Cambridge University Press, Cambridge, Chapter 1: Plausible Reasoning. [36] Kemp, C. and Tenenbaum, J., “The Discovery of Structural Form,” PNAS, 2008, Vol 105, no 31, 1068710692. [37] Nosofsky, R. M., 1986, “Attention, similarity, and the identification-categorization relationship,” Journal of Experimental Psychology: General, 115:39–57. [38] Ashby, F. G., and Maddox, W. T., 1992, “Complex decision rules in categorization: Contrasting novice and experienced performance,” Journal of Experimental Psychology: Human Perception and Performance, 18(1):50–71. [39] Anderson, J. R., 1991, “The adaptive nature of human categorization,” Psychological Review, 98(3):409–429. [40] Kemp, C., Tenenbaum, J. B., Griffiths, T. L., Yamada, T., and Ueda, N., 2006, “Learning systems of concepts with an infinite relational model,” In Proceedings of the 21st National Conference on Artificial Intelligence. [41] Kemp, C., and Tenenbaum, J. B., “Structured statistical models of inductive reasoning,” Psychological Review, In press. [42] Griffiths, T. L., Steyvers, M. , and Tenenbaum, J. B., 2007, “Topics in semantic representation,” Psychological Review, 114(2):211–244. [43] Landauer, T.K., Foltz, P.W. & Laham, D., 1998, “Introduction to Latent Semantic Analysis,” Discourse Processes, 25, 259-284. [44] Foltz, P.W., Kintsch, W., & Landauer, T.K., 1998, “The Measurement of Textual Coherence with Latent Semantic Analysis,” Discourse Processes, 25 (2&3), 285-307. [45] Deerwester, S., Dumais, S. T., Furnas, G. W., and Landauer, T. K., 1990, “Indexing by Latent Semantic Analysis,” J. of Amer. Soc. of Info. Sci. & Tech., 41 (6), 391-407. [46] Shepard, R. N., 1980, “Multidimensional Scaling, Treefitting, and Cluster,” Science, 210, 390-398. [47] Inhelder, B., and Piaget, J., 1964, The Early Growth of Logic in the Child, Routledge & Kegan Paul, London. [48] Anderson, J. R., 1991, “The adaptive nature of human categorization,” Psychol. Rev, 98, 409 – 429.
[49] Huelsenbeck, J. P., and Ronquist, F., 2001, “MRBAYES: Bayesian inference of phylogenetic trees,” Bioinformatics, 17, 754–755. [50] Fiske, A. P., 1992, “The four elementary forms of sociality: Framework for a unified theory of social relations,” Psychol. Rev, 99, 689–723. [51] Guttman, L., 1944, “A basis for scaling qualitative data,” Am. Soc. Rev., 9, 139–150. [52] Bradley, R. A., and Terry, M. E., 1952, “Rank analysis of incomplete block designs. 1. The method of paired comparisons,” Biometrika, 39, 324–345. [53] Guttman, L., 1954, A new approach to factor analysis: The radex. Mathematical Thinking in the Social Sciences, ed Lazarsfeld PF, Free Press, Glencoe, IL, 258–348. [54] Wiggins, J. S., 1996, “An informal history of the interpersonal circumplex tradition,” J. Personality Assessment, 66, 217–233. [55] Sneath, P. H., and Sokal, R. R., 1973, Numerical Taxonomy: The Principles and Practice of Numerical Classification, Freeman, San Francisco. [56] Collins, A. M., and Quillian, M. R., 1969, “Retrieval time from semantic memory,” J. Verbal Learn Verbal Behav., 8, 240–247. [57] Carroll, J. D., 1976, “Spatial, nonspatial and hybrid models for scaling,” Psychometrika, 41, 439–463. [58] Kohonen, T., 1997, Self-Organizing Maps, Springer, New York. [59] Kemp, C. and Tenenbaum, J., “The Discovery of Structural Form,” PNAS, 2008, Supporting Information Appendix 10.1073/pnas.080263110
10
Copyright © 2011 by ASME
Downloaded 25 Aug 2012 to 128.83.63.20. Redistribution subject to ASME license or copyright; see http://www.asme.org/terms/Terms_Use.cfm
APPENDIX A TWENTY-FIVE RANDOMLY SELECTED PATENTS USED Patent Index in Figures 2-5 1 2
2
U.S. Patent Number
Patent Title
6,504,656 6,927,115
Variable Lens Special Patent2 Frequency Measuring Device, Polishing Device Using The Same And Eddy Current Sensor High Energy Propellant Charge Cooler Angle Duct Optical Fiber For Preserving Plane Of Polarization Inductive Delay Line And Method Of Making Method For Preparing Aluminum Nitride And Its Sinter Striker Solenoid Assembly For Player And Reproducing Pianos Eliminating DC-DC Converter Switching Transients In Digital Systems Image Processing Apparatus, Image Processing Method, Program, Recording Medium And Image Forming Apparatus Having The Same Plastics Closure Unit And A Method For The Manufacture Thereof Centrifuges And Associated Apparatus And Methods Endoscope Having Illuminance Ratio Adjusting Device Between Moving And Still Picture Images Wireless-Based System And Method For Hull-Based Sensing Device For Holding A Glass Workpiece While Shaping Flush Mounted Taillight Acoustic Catheter With Rotary Drive Low Profile, Broad Band Monopole Antenna Camera With A Line-Of-Sight Detecting Device Service Name To Network Address Translation In Communications Network Cardiopulmonary Resuscitation Mannequin Method Of Contamination Free Ironing Of Wet State Substances On Selected Areas N-Substituted 4-Hydroxyindoline Derivatives System And Method For Diagnosing Pathologic Heart Conditions
3
7,046,001
4 5 6 7 8
4,533,415 4,693,084 6,597,847 4,272,741 4,983,462
9
5,081,893
10
3,958,169
11
7,130,469
12
5,863,655
13
5,634,876
14
5,331,949
15
6,972,678
16 17 18 19 20
5,069,432 7,073,618 5,423,797 4,890,116 5,640,610
21
5,227,778
22
6,530,783
23
5,129,978
24
6,002,018
25
6,898,459
This randomly selected patent was withdrawn from the U.S. Patent Office, but the textual content was used in the creation of both patent spaces.
11
Copyright © 2011 by ASME
Downloaded 25 Aug 2012 to 128.83.63.20. Redistribution subject to ASME license or copyright; see http://www.asme.org/terms/Terms_Use.cfm