discrete choice models with non-linear externalities a numerical estimation method . Fabio Vanni December 8, 2014
Institute of Economics Scuola Superiore Sant’Anna - PISA - ITALY Co-authors: Ugo Gragnolati and prof. Giulio Bottazzi
outline
Presents: ∙ a stochastic discrete choice model with non-linear terms, ∙ a method to carry out inferential analysis on its parameters, ∙ numerical techniques and application to simulated data and empirical ones.
1
.the model
interdependencies in the decisions of agents
• Individual choices determined by intrinsic features of the object and by choice of other individuals. ∙ Consumers buy a product on the basis of qualities of the product and as a function of the number of other consumer possessing the product. ∙ Social medias with consumers preferences ∙ Firm for a place for localization on the base of geography and on the presence of other firms in the area.
3
markov process and polya urn schemes
∙ Class of stochastic models as Ehrenfest-Brilloiun model: a Markov process equivalent to an ergodic Polya process. ∙ Population of N agents choosing among L alternatives, each agent maximize the individual utility which depends on the choices of other.
4
sequencial choices
Process made up of sequence of indivudual choices: ∙ Framework with L locations and N agents.
5
sequencial choices
Process made up of sequence of indivudual choices: ∙ Framework with L locations and N agents.
∙ an agent is selected at random to revise his choice
5
sequencial choices
Process made up of sequence of indivudual choices: ∙ Framework with L locations and N agents.
∙ an agent is selected at random to revise his choice
∙ an alternative l is chosen by an agent with probability g pl = ∑L l l=1
gl
5
sequencial choices
Process made up of sequence of indivudual choices: ∙ Framework with L locations and N agents.
∙ an agent is selected at random to revise his choice
∙ an alternative l is chosen by an agent with probability g pl = ∑L l l=1
gl
∙ g = (g1 , . . . , gL ) vector of common utilities. 5
linear utility function
• The linear case1 : gl = al + bnl ∙ al captures the intrinsic features of alternative l (local attractiveness) ∙ b captures the social externality of alternative l (social influence) ∙ nl number of agents that selected the alternative l
1 G.
Bottazzi and A. Secchi. LEM-WP September 2007, Bottazzi et. Al 2008 and Gragnolati,Regional Studies,2013
2 Bottazzi
6
linear utility function
• The linear case1 : gl = al + bnl ∙ al captures the intrinsic features of alternative l (local attractiveness) ∙ b captures the social externality of alternative l (social influence) ∙ nl number of agents that selected the alternative l
• Ergodic process: ∙ numerical averages converge asymptotically to the invariant distribution of the process.
• Analytical form of the equilibrium distribution ∙ a closed-form likelihood function to evaluate the best parameters that fit the observations2 . 1 G.
Bottazzi and A. Secchi. LEM-WP September 2007, Bottazzi et. Al 2008 and Gragnolati,Regional Studies,2013
2 Bottazzi
6
non-linear externalities
• The non-linear case: gl = al + bnl + cn2l ∙ c > 0 positive spillover (boost effect) ∙ c < 0 spatial congestion ∙ c = 0 recover the linear case (”Polya case”)
7
non-linear externalities
• The non-linear case: gl = al + bnl + cn2l ∙ c > 0 positive spillover (boost effect) ∙ c < 0 spatial congestion ∙ c = 0 recover the linear case (”Polya case”)
• no analytical form for the equilibrium distribution ∙ study of the time evolutions and trajectories of the configuration vector n(t) = (n1 (t), . . . , nL (t))
• the process is still ergodic ∙ numerical estimation of the equilbirium distributions ∙ time means as ensemble averages. ∑ ∙ limT→∞ T1 Tt=0 δnt ,n = π(n)
7
small perturbations regime
Considerations on the non-linear case: • Limits in the evaluation of the non-linear term ∙ no closed-form likelihood function ∙ computational estimation in a high dimensional spaces.
8
small perturbations regime
Considerations on the non-linear case: • Limits in the evaluation of the non-linear term ∙ no closed-form likelihood function ∙ computational estimation in a high dimensional spaces.
• Getting around the limits 1 n ∙ from point estimation in terms of configuration vectors (ML approach) ∙ to aggregate estimation in terms of occupancy classes (χ2 approach) ∙ small perturbation regime c ≈
8
.estimation & inferential analysis
framework for the hypothesis testing analysis
(a) The basic search procedure to find the ”best” parameter c. (b) Build the test statistics (a+b) Rejection of the Null Hypothesis (c = 0)
10
search procedure
(a) Grid-like procedure observation . . . . .
. . . . .
.
. . . . .
. . . . .
search procedure
(a) Grid-like procedure observation . . . . .
. . . . . n o
.
. . . . .
. . . . .
1. Initial observed configuration
search procedure
(a) Grid-like procedure observation . . . . .
. . . . . n o
c1 n′(tmin; c1)
…
.
. . . . .
. . . . .
1. Initial observed configuration 2. equilibrium configuration for a given c
search procedure
(a) Grid-like procedure observation . . . . .
. . . . . n o
c1 n′(tmin; c1) n′(tmin + T; c1)
.
…
. . . . .
...
. . . . .
1. Initial observed configuration 2. equilibrium configuration for a given c 3. trajectory evolution
search procedure
(a) Grid-like procedure observation . . . . .
. . . . . n o
c1 n′(tmin; c1) n′(tmin + T; c1)
.
…
. . . . .
...
. . . . .
Θ
1. Initial observed configuration 2. equilibrium configuration for a given c 3. trajectory evolution
Obj.Fun.distance
4. comparison measure
search procedure
(a) Grid-like procedure observation
1. Initial observed configuration
. . . . .
. . . . . n o
c1 n′(tmin; c1) n′(tmin + T; c1)
…
... Θ
c.k . . . ;. . c ) n′(tmin k
. . . .T; . n′(tmin + ck )
Θ Obj.Fun.distance
…
...
2. equilibrium configuration for a given c 3. trajectory evolution 4. comparison measure 5. another value of c
search procedure
(a) Grid-like procedure observation
1. Initial observed configuration
. . . . .
. . . . . n o
c1 n′(tmin; c1) n′(tmin + T; c1)
…
... Θ
c.k . . . ;. . c ) n′(tmin k
. . . .T; . n′(tmin + ck )
Θ Obj.Fun.distance
cK n′(tmin; cK)
…
n′(tmin + T; ck)
... Θ
2. equilibrium configuration for a given c 3. trajectory evolution 4. comparison measure 5. another value of c 6. K indipendent trajectories
search procedure
(a) Grid-like procedure observation
1. Initial observed configuration
. . . . .
. . . . . n o
c1 n′(tmin; c1) n′(tmin + T; c1)
…
...
c.k . . . ;. . c ) n′(tmin k
. . . .T; . n′(tmin + ck )
Θ
Θ
cK n′(tmin; cK)
…
n′(tmin + T; ck)
... Θ
ˆc(no) = argmin{Θ(n′(c), no)} c
2. equilibrium configuration for a given c 3. trajectory evolution 4. comparison measure
ˆc
5. another value of c 6. K indipendent trajectories 7. closeness among trajectories 11
search procedure
(a) Grid-like procedure observation
1. Initial observed configuration
. . . . .
. . . . . n o
c1 n′(tmin; c1) n′(tmin + T; c1)
…
...
c.k . . . ;. . c ) n′(tmin k
. . . .T; . n′(tmin + ck )
Θ
Θ
cK n′(tmin; cK)
…
n′(tmin + T; ck)
... Θ
ˆc(no) = argmin{Θ(n′(c), no)} c
2. equilibrium configuration for a given c 3. trajectory evolution 4. comparison measure
ˆc
point estimation for the c that generates a configuration closest to the observed no
5. another value of c 6. K indipendent trajectories 7. closeness among trajectories 11
montecarlo statistics
(b) Test statistical significance of ˆc 1. MonteCarlo approach: build the test statistic from configurations taken from the Null Hypothesis (c = 0), via a Polya random generator.
.
.
n.1
. .. .
model . (c = 0) n.s
.
.
. .. .
n.S
.
2. Run the previous search procedure to find the first optimum point ˜c(n1 ) 3. For different seeds apply the same procedure: S replica
...
...
...
...
...
...
...
...
˜c(ns)
˜c(n1)
...
...
...
...
...
...
˜c(nS)
ˆ Θ
4. Build the test statistics form the S independent estimates of ˜c
−ˆc2
.
ˆc2 ˜c
12
complete hypothesis testing
observation
.
.
n.1
. .. .
. . . . .
. . . . . n o
c1 n′(tmin; c1) n′(tmin + T; c1)
…
...
c.k . . . ;. . c ) n′(tmin k
. . . .T; . n′(tmin + ck )
F
F
model . (c = 0) n.s
.
.
. .. .
n.S
c. K …
n′(tmin; cK)
...
n′(tmin + T; ck)
...
...
...
...
...
...
...
...
...
...
...
... ...
...
F
ˆc(no) = argmin{Θ(n′o(c), no)} c
˜c(ns)
˜c(n1)
˜c(nS)
ˆc
1. the empirical function from the ˜c’s under the null hypothesis c = 0
ˆ Θ
2. two-sided p-value of ˆc(n)
−ˆc2
ˆc2
3. reject or not the null hyp. c = 0. .
˜c
13
.the objective function
objective function
• Θ compares two configurations of the systems. ∙ χ2 minimization approach
• Distance measures in terms of occupancy classes. ∙ occupancy defined as as the number of alternatives chosen by n agents.
15
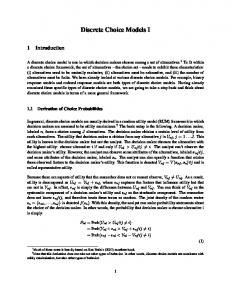
χ2 occupancy measure
∙ Classes Cj chosen to be equally populated ∙ Each bin contains the same number of occurrences
Figure: (a)
Figure: (b)
Figure: (c)
(a) from the observed no , the binning from cumulative distribution (b) the histograms respect to these classes is almost flat (c) visual hindsight of difference between configurations
16
comparing two occupation vectors
∙ distance function to compare configurations is the χ2 statistics: Θ(n′ , no ) = χ2 =
J ∑ (ho,j − he,j )2 he,j j=1
he,j :=
tmin +T 1 ∑ ht,j T t=t min
∙ he,j the average frequency of class j over the time T of the trajectory n′ (c) ∙ ho,j the frequency of the class j for the observed configuration no 17
comparing two occupation vectors
Other possible choices for the objective function are: ∙ Hellinger-Bhattacharya Distance: dH (p, q) =
[∑ √ ]1/2 √ ( pi − qi )2 i
∙ Kullback-Leibler Distance: KL(p, q) =
∑ i
∙ ∆-Distance ∆(p, q) =
pi log
pi qi
∑ (pi − qi )2 pi + qi i
18
optimization methods
Numerical solution to the optimization problem that minimizes Θ = χ2 : { ( )} ˆc(no ) = argmin Θ n′ (c), no c
Using two different methods: ∙ Grid method ∙ Iterative method
19
grid method - description
• the search for the minimum point ˆc ∈ [cmin , cmax ] • interval according to a quasi-linear condition. • find the minimum point value for χ2 (noisy function)
20
grid method - limitations and advantages
• simple and no convergence to reach. • choice of the step-size ∆c. ·10−2
χ2
2.8 2.6 2.4 2.2 2 1.8 1.6 1.4 1.2 1 0.8 0.6 0.4 0.2 . −3
−2.5
−2
−1.5
−1
−0.5
0
0.5
c
1
1.5
2
2.5
3
3.5 × 10⁻²
.
21
grid method - limitations and advantages
• simple and no convergence to reach. • choice of the step-size ∆c. ∙ Finer :increases the resolution but it magnifies the oscillations deriving from the random nature of the process.
·10−2
χ2
2.8 2.6 2.4 .
2.2
.small ∆
2 1.8 1.6 1.4 1.2 1 0.8 0.6 0.4 0.2 . −3
.
−2.5
−2
−1.5
−1
−0.5
0
0.5
c
1
1.5
2
2.5
3
3.5 × 10⁻²
.
21
grid method - limitations and advantages
• simple and no convergence to reach. • choice of the step-size ∆c. ∙ Finer :increases the resolution but it magnifies the oscillations deriving from the random nature of the process.
·10−2
χ2
2.8 2.6 2.4
. .
2.2
.small ∆ .large small ∆ ∆
2 1.8 1.6 1.4
∙ Coarser : increases the speed of the algorithm, but loss of definition and larger variance of the estimation (less likely to reject the null hypothesis)
1.2 1 0.8 0.6 0.4 0.2 . −3
.
−2.5
−2
−1.5
−1
−0.5
0
0.5
c
1
1.5
2
2.5
3
3.5 × 10⁻²
.
21
iterative method
• Iterative method to find the minimum • Exploit the quadratic behavior of the χ2 ∙ Local minimum by successively fitting parabolas (Brent, 1973).
• No requirement for a differentiable function, ∙ Avoiding the critical computation of derivatives in the case of noisy functions
• The superlinear rate of convergence (1.34).
22
parabolic approximation
1. three initial guess points x0 , x1 , x2 2. evaluate the function at the points f0 = f(x0 ), f1 = f(x1 ), f2 = f(x2 )
3. fit parabola via Lagrange interpolation q(x) = a0 + a1 (x − x0 ) + a2 (x − x0 )(x − x1 ) , f1 − f0 , x1 − x0 ( ) f2 − f0 1 − a1 a2 = x2 − x1 x2 − x0
a0 = f0 ,
a1 =
4. parabola’s min is the estimate for the min. of the function ¯x =
x1 +x0 2
−
a1 2a2
5. discard oldest point 6. repeat until convergence
23
convergence criteria
Differently from the deterministic case the convergence is set ∙ stochastic behavior of the evolved configurations ∙ χ2 noisy ∙ fix a tolerance criterion based on the variance of the process ∙
2 ( ) δχ ≤ σ fχ2 stop when fluctuations of minimum values are of the same order of magnitude of the estimated standard deviation of χ2 24
comparison of two methods
The best approach: the power of discriminate in the hypothesis testing with the same degree of algorithmic cost. Grid search approach ↑ simple implementation ↑ no convergence needed
Parabolic Interpolation approach ↓ more complex computational implementation
↓ fix the interval search
↓ constraint specification: control on local maxima and alignment issue cost an extra iteration.
↓ grid definition and step-size
↑ does not require differentiability
↓ higher resolution requires larger computational cost.
↑ more performing method
↓ slow search
↑ 4x faster than grid method ↑ resolution independent (only three points)
25
computational costs
The central code is the evolution of the choice process generating configuration vectors over time. The asymptotic temporal cost is: C(L, T) ∼ O(L) · O(T) C(L, T) = (a0 + a1 L) · T where: ∙ [a0 ] = [a1 ] = [sec] evaluated for a specific machine in use. ∙ L number of alternatives , T number of time step in the evolution
Then the spatial cost of the physical memory needed M(L, T) = mL · T ,
where [m] = [MBytes] the weight of each number that occupies 8 bytes. 26
computational costs
machine specification: • Matlab 64bit on Linux Machine and Windows • Intel i7 quad-core processor cpu 2.10GHz, DDR3 SDRAM of 8 Gbytes . • Programming accordingly to a major-order of Matlab • Parallel computing over Np = 4 workers: C(L, T)P = C(L, T)/Np
27
precision variables
• The total time of the estimation related to its efficiency is affected by: 1. T the temporal length of each occupancy trajectory and the respective obj. fun. computation. 2. S the number of seeds used to build the empirical statistics, for the hypothesis testing.
28
performance on simulated data
Example of inferential analysis with: • Precision parameters: S = 100-trajectories, T = 105 -time steps • System size:. L = 103 -alternatives and N = 104 -agents.
∙ Grid size of 40 increments in [−1 · 10−3 , 1 · 10−3 ],
∙ Each c is calculated in 4-8 iterative steps
∙ ∼ 2 hrs of calculation to compute it
∙ ∼ 20 min to compute it
29
.overview recapitulation
bottom-up recap.
Nested summary of the previous steps and forward.
∙ Specification of the numerical solution to the minimum problem of the Objective function { ( )} ˆc(no ) = argmin Θ n′ (c), no c
best with Successive Parabolic Interpolation Approximation
31
bottom-up recap.
Nested summary of the previous steps and forward. ∙ Definition of a measure of distance between occupancy distribution of the configuration vectors Θ(n′ , no ) =
J ∑ (ho,j − he,j )2 he,j j=1
the χ2 minimization in terms of occupancy classes, to find the value of c that make the distribution as ”closest” as possible.
31
bottom-up recap.
Nested summary of the previous steps and forward. ∙ Statistical compatibility with the observed distribution. Given the set of parameters (a, b, c), test the null hypothesis c = 0 against the alternative, at a given significance level (p-value).
31
bottom-up recap.
Nested summary of the previous steps and forward.
∙ Exploit the previous search procedure of inferantial analysis to build a point estimation of multiple parameters via a multistage procedure.
31
.point estimation of multiple parameters
multistage procedure
Estimate multiple parameters e.g. (b, c), multidimensional space, where each dimension is a parameter to be estimated.
∙ Procedure based on a coordinate descend method in which each parameter estimation is obtained respect to one variable at a time while the other is kept fixed.
33
multistage procedure
Estimate multiple parameters e.g. (b, c), multidimensional space, where each dimension is a parameter to be estimated.
A The single parameter (c) is obtained conditionally to an initial ˆ We start to test the value of b = b. hypothesis c = 0, if rejected take the new value ˆc0 .
33
multistage procedure
Estimate multiple parameters e.g. (b, c), multidimensional space, where each dimension is a parameter to be estimated.
B restriction c = ˆc0 and test the ˆ0 . If not, hypothesis that b = b procede.
33
multistage procedure
Estimate multiple parameters e.g. (b, c), multidimensional space, where each dimension is a parameter to be estimated.
E the procedure stops if the set of estimates not statistical different (cannot reject the last null-hypothesis).
33
.application to empirical data
localization choices
• After tested the estimation procedure on simulated data. • Analysis on localization choices for firms using Italian census data for the year 2001 (see ISTAT, 2006). • Are the localization choices of firms affected by non-linear externalities? • Negative non-linear terms in pl ∼ al + b · nl + c · n2l sign of congestion effect in some commuting zones. • Agents are the N firms that try to localize their plants across L commuting zones that compose Italy. 35
firms’ localization in italy
∙ Territory split in L = 686 commuting areas. ∙ Data for different industrial sectors (Constructions, Textiles, Apparel, Food, etc...) ∙ N-number of firms for sector. ∙ the model parameters: ∙ al capture the advantage of that location (attractiveness factor) ∙ b is positive externality of localization (nl already there)
36
firms’ localization in italy
Analysis to detect the presence of non-linear externalities ∙ Very high dimensional problem with N typically between 103 -106 number of firms. ∙ Until now only one significant sector with evidence for c ̸= 0. ∙ Other 20 sectors to analyze in Italy and other sectors in USA territory.
37
.conclusions
conclusions
• Analysis for the presence of non-linear externalities for a discrete choice model • Estimation framework developed for High Dimesional problems. • MATLAB toolbox with: ∙ ∙ ∙ ∙
Random Number Generator for generalized Polya distrubution, Optimization procedure (Succ.Parab.Approx.), Statistical significance tests and MonteCarlo simulations, Coordinate descend method for multivariate parameters’ estimation.
• LEM Working Paper, Online ISSN 2284-0400.
39
Thank you
[email protected] [email protected]
40