DISCUSSIONS AND CLOSURES
Material properties
Discussion of “Mechanics of Progressive Collapse: Learning from World Trade Center and Building Demolitions” by Zdene˘k P. Bažant and Mathieu Verdure
Column properties, undamaged condition, simply supported at intervals of L = 3.63 m
March 2007, Vol. 133, No. 3, pp. 308–319.
e = 3052.4 MPa
DOI: 10.1061/共ASCE兲 0733-9399 共2007兲133:3共308兲
共Euler兲
cr = 479.5 MPa or Pcr = 4.292 ⫻ 106 N
Gregory Szuladzinski1 1
共Flow stress兲
0 = 500 MPa
E = 200,000 MPa,
Analytical Service Pty Ltd., Killara/Sydney, Australia 2071. E-mail:
[email protected]
The paper presents a very interesting concept of an accidental demolition, whereby heavy damage sustained by an intermediate story of a building leads to the upper part of the structure crushing the lower one in a sequence of story collapse steps. The focus of the paper is on the treatment of equations of motion and very few numbers are quoted; that is, numbers that relate to the physical properties of the structure discussed, namely the World Trade Center 共WTC兲 towers. The following comments are intended to fill that gap as well as to ascertain the likelihood of the applicability of this concept.
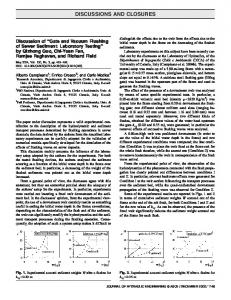
共Johnson-Ostenfeld parabola兲 M 0 = Z0 = 1.173 ⫻ 106 ⫻ 500 = 586.5 ⫻ 106 N-mm 共Plastic moment capacity兲 The first phase of column squashing in the plastic range is as shown in Fig. 1共c兲, with the rotation angle of = 75°. The absorbed strain energy, up to that intermediate point, is ⌸1 ⬇ 4M 0 = 4 ⫻ 586.5 ⫻ 106 ⫻ 1.309 = 3071 ⫻ 106 N-mm u1 = 0.6L共1 − cos 75 ° 兲 = 1614 mm; Travel to intermediate point. The resistance at the intermediate point
General Information, North Tower of WTC The following information comes mainly from FEMA reports 共FEMA 2003兲. The highest floor of the building, level 110, was the roof, which was 417 m above ground. The typical floor height was 3.63 m, once above the mezzanine floor. The live load at a given time is a matter of statistics. We chose 300 kg/ m2 which is less than design load, but more realistic. This, along with other masses, results in 2.371 kt per floor. There were 240 original columns in the outer shell. This shell and the core were balanced, which means that the same effective amount of steel was present in the core. The most critical segment of the North Tower seemed to be the 95th floor 共above level 95兲. The mass above level 95 was that of 15 floors plus an additional 2 kt for the roof. This results in 78.26 tons supported by one outer column. 共767.7 kN/ column兲
P0 =
M0 共0.3L兲sin 2
Like every high-rise building, this one was made up of segments with constant column properties. The number of those segments was not available, so we assumed it to be 6. The square column section shown in Fig. 1共d兲 is the thinnest one. 共Corner rounding was not shown.兲 It is also the relevant one for the initiation of collapse. Close to the base of building, the outer dimension is the same, but the wall thickness is 101.6 mm. The properties of this lightest section are as follows:
586.5 ⫻ 106 = 557,580 N 0.3 ⫻ 3630 ⫻ 0.9659
The final compacted length is taken as 0.2L and the P − u curve 共load-resistance兲 is assumed to be the second-order parabola, tangent to the horizontal at the intermediate point and reaching the value of Pm = 2Pcr. This peak load is to be applied for a very short time only, not sufficient to buckle the column. Besides, the floor mass is resisting some of the dynamically applied load. With the compaction ratio of 0.2, the travel during the stiffening part of the movement is u2 = 0.8L − 0.445L = 0.355L = 1,289 mm. The minimum and the maximum forces over this displacement are, respectively P0 = 557.6 kN and Pm = 2Pcr = 8,584 kN The energy absorbed during stiffening ⌸2 =
Structural Data
=
=
u2 共2P0 + Pm兲 3 1289 共2 ⫻ 557.6 + 8584兲103 3
= 4.167 ⫻ 109 N-mm Total absorbed energy ⌸ = ⌸1 + ⌸2 = 7.238 ⫻ 109 N-mm Average resistance
A = 8950 mm2 ;
I = 182.37 ⫻ 106 mm4 ;
Z = 1.173 ⫻ 106 mm3
F0 = ⌸/共0.8L兲 = 2492 kN
JOURNAL OF ENGINEERING MECHANICS © ASCE / OCTOBER 2008 / 913
P
Another Perspective: Initial Vertical Velocity
P1 P u
θ
second order parabola
Pcr
Pm
L P0
0.5 L 0.2 L (b)
(a)
(d)
6.4 (TYP)
u (c)
0.445 L
What is the initial vertical velocity needed for the upper part of the building to cause squashing of a previously undamaged story? From the initial calculation, ⌸ = 7.238⫻ 109 N-mm. Mass per column, two levels below 95. M = 78.26+ 2 ⫻ 4.94= 88.14 t. Equating kinetic and strain energies gives a result of
0.8 L
356 (TYP)
1 M v20 = ⌸ 2
or
1 88.14 ⫻ 106v20 = 7.238 ⫻ 109 2
This means a free fall from h=
8.5082 v2 = = 3.69 m 2g 2 ⫻ 9.81
Fig. 1. 共a兲 Postulated plastic joint location; 共b兲 deformed shape; 共c兲 resistance deflection plot; and 共d兲 and the thin wall section at the upper segment of building
This is more than one story and is clearly beyond the range of possibilities.
Initial Phase of Collapse—Heavily Damaged Story
Duration of Fall
The weight of 767.7 kN/ column was applied by the upper part of building. To cause initiation of failure, the buckling force Pcr had to be reduced to the level of applied load, i.e., by the factor of 4.292/ 0.7677= 5.59. The minimum resistance and the energy absorbed over the softening segment have to be reduced accordingly
The solution of the “crushing wave” equations is difficult in its most general setting. However, when a relatively small resistance of the collapsing structure is assumed, a major simplification is possible. Let this resistance be limited to balancing the force of gravity only, for the distributed , before as well as after being accreted to the moving mass. If M 0 is the mass of the upper part of the building, then the current mass is M 0 + z, where z designates the current position with respect to a fixed frame. Also, full compaction is assumed for the crushed part. Writing Newton’s law in the impulse-momentum form, as appropriate for a body of variable mass, we have
P0 = 557,580/5.59 = 99,750 N ⌸1 = 3071 ⫻ 106 N-mm/5.59 = 549.4 ⫻ 106 N-mm Before the stiffening part of P − u is assessed, the strength of the adjacent stories must be known. Assume that they have been affected by the initial accident as well, so that their strength is one-half of that of the original structure, or Pcr / 2. This means that the maximum compression that can be reached on dynamic basis is Pm = 2共Pcr / 2兲 = Pcr. The energy absorbed during stiffening ⌸2 =
d 共M v兲 = M 0g dt as the net effect of gravity applies now only to M 0. This equation can be solved to give the time needed to reach z
1289 u2 共2P0 + Pm兲 = 共2 ⫻ 99.75 + 4292兲103 3 3 = 1.930 ⫻ 109 N-mm
The total ⌸ = 共0.5494+ 1.930兲109 = 2.479⫻ 109 N-mm Potential energy of the upper part Mg共0.8L兲 = 78.26 ⫻ 106 ⫻ 0.00981 ⫻ 0.8 ⫻ 3630 = 2.229 ⫻ 109 N-mm The strain energy 共as a measure of resistance to be overcome兲, which is needed to collapse the column, is larger than the potential energy available. The conclusion is that the motion will be arrested during the damaged story collapse and the building will stand.
Comments on This Approach One could argue that during plastic collapse, and especially near the minimum vertical resistance point, the column section will be severely deformed and its capacity may be lower than assumed here. This may as well be true, but then the walls of the column will be folding, one onto another, thereby compensating for that decrease of resistance. Admittedly, this point is of a speculative nature. A better insight can only be gained by either a physical test or finite-element simulation of an extensive squashing process.
t2 =
冋冉 冊 册 1+
2z h0
2
−1
h0 2g
where h0 = 54.5 m is the height of the upper part. Substituting z = 362.5 m for the height of the lower part, one finds t = 23.8 s. This is not the whole collapse time, since the upper part must still be partially demolished to bring the rubble heap from h0 to the reported height of some 25 m. Therefore, the duration of fall according to this failure mode is about double the collapse time known to be in the range of 10 to 15 s. In summary, the postulated failure mode is not a proper explanation of the WTC Towers collapse, as concluded from several criteria used previously. The visual evidence is not favorable to this theory, either. There was an absence of “kinks” or “elbows” from bent columns sticking out and visible in the early phase of the fall. These comments, however, should not in any way diminish the value of this progressive collapse theory, which may be used as a design tool for other buildings.
Stress Waves A few comments on stress waves are also in order. The section “Effect of Elastic Waves” includes a few misunderstandings. The statement “. . . perfectly plastic part of steel deformations cannot propagate as a wave” is correct but not relevant. Elastic–perfectly
914 / JOURNAL OF ENGINEERING MECHANICS © ASCE / OCTOBER 2008
plastic material model is a convenient approximation of a stressstrain curve, but the physical material behaves according to the original, not to the approximate relation. 共The approximation is useful for purposes other than wave propagation.兲 The curve gradually changes its slope, indicating that the stress waves will travel much more slowly at higher strains. The stress wave emitted during an internal collision will partially reflect from all discontinuities on its way before it finally reflects from the ground. During such reflections, enhancements take place. If stress cannot increase because of the onset of plasticity, there will be an increase in strain, and that straining will affect the region close to a discontinuity, or a notch. Numerous weldments along the height are such notches. So are the previously mentioned segment boundaries. Even from static viewpoint, weldments are stress concentrations, shapewise, and their usually form discontinuous material properties. A shock loading taking place will greatly magnify the effect of all discontinuities. Some of these phenomena have been described by Szuladzinski 共2000兲, although in a different geometrical setting. One can reasonably expect that the shock loading originating from the internal collisions will act as a damage precursor for the nearby structure. Dismissing the action of stress waves, which are, in effect, that shock loading, may only be justified by the difficulty of assessing their effect. The stress-strain curves, as presented in the FEMA report 共2003兲 are nearly flat or convex upward, when plotted, as usually, in terms of engineering stress. If converted to the true stress, they will become less convex 共or may even become concave兲. This will underline the fact that the elastic–perfectly plastic approximation must be used with caution.
References Federal Emergency Management Agency 共FEMA兲. 共2003兲. “World Trade Center building performance study: Stress and strain magnification effect in rapidly loaded structural joints.” The Seventh Int. Symp. on Structural Failure and Plasticity 共Implast 2000兲, Melbourne, Australia, Oct. 2000. Szuladzinski, G. 共2000兲. “Stress and strain magnification effects in rapidly loaded structural joints.” The Seventh Int. Symp. on Structural Failure and Plasticity 共Implast 2000兲, Melbourne Univ., Melbourne, Australia, Oct. 2000, 287–293.
Discussion of “Mechanics of Progressive Collapse: Learning from World Trade Center and Building Demolitions” by Zdene˘k P. Bažant and Mathieu Verdure March 2007, Vol. 133, No. 3, pp. 308–319.
DOI: 10.1061/共ASCE兲0733-9399共2007兲133:3共308兲
James R. Gourley1 1
B.S. Chemical Engineering; Attorney, Carstens & Cahoon, LLP, Dallas, TX 75240. E-mail:
[email protected]
This discussion describes flaws in the modeling and analysis of the World Trade Center collapses by Bažant and Verdure in their paper entitled “Mechanics of Progressive Collapse: Learning from World Trade Center and Building Demolitions.” First, the paper’s two-phased approach to the collapse analysis will be con-
sidered. The writers will demonstrate that a two-phase collapse analysis is not representative of reality, because it disregards wellaccepted laws of physics and therefore is not instructive. Second, the original paper’s summary of the findings of the NIST report will be analyzed. The first problem with the original paper is that throughout it, the collapse is assumed to occur in two phases. As a result, all equations that purport to model the collapse are developed separately for the first phase and for the second phase. In the first phase, which the paper calls crush-down phase, the section of the tower above the aircraft impact zone 共called Part C in the original paper; see Fig. 2 of the original paper兲 remains essentially intact as it progressively crushes down through the entire section of the tower structure below the impact zone called Part A in the original paper; see Fig. 2. The second phase, called the crush-up phase, starts when the entire lower structure of each tower 共Part A兲 has been completely destroyed by the upper part 共Part C兲, and Part C allegedly impacts the dense pile of debris created during the crush-down phase at high speed, thereby destroying Part C from the bottom up. Initially, this two-phase collapse mode may seem plausible, but after careful examination, it is clear that this twophase collapse scenario is scientifically implausible, which calls into question the veracity of all equations developed in the original paper. The paper appears to justify this collapse mode by making a key assumption that the authors do not support with any explanation or analysis. This key assumption, which is one of what the authors call “reasonable . . . simplifying hypotheses” is that, during the building collapse, “关e兴nergy is dissipated only at the crushing front 共this implies that the blocks in Fig. 2 may be treated as rigid, i.e., the deformations of the blocks away from the crushing front may be neglected . . .兲” In other words, the paper assumes that Part C of each tower is treated as a rigid block while it crushes down through and destroys the lower structure. Although this assumption may have had the intended effect of simplifying the paper’s collapse analysis, it also rendered the collapse analysis at odds with the reality of the physics at work during the collapse. It should be noted here that no lateral forces are considered in this discussion in accordance with another simplifying assumption made by the paper, namely, that the “only displacements are vertical” 共p. 312 of the paper兲. This simplifying assumption is flawed 共e.g., steel members and dust were spread across a wide area surrounding the location where the towers stood兲 but is beyond the scope of this discussion. The physical reality for each tower, which any instructive collapse analysis must take into account, can be summarized as follows: for a particular tower, the upper part 共Part C兲, lower section 共Part A兲, and the crushing section 共Part B兲 were all very similar to one another from a materials, engineering, and construction standpoint. Therefore, the only reasonable qualitative assumption to make when analyzing the ability of each section of the building to deform when the upper part 共Part C兲 impacts the lower structure is that the plastic deformation and yield strengths, 共as well as any other energy absorptive properties, such as elastic strain values兲 of the components of the lower structure 共Part B and Part A兲 are roughly equivalent to the deformation and yield strengths of the components of the upper Part C. This qualitative assumption is required regardless of the quantitative assumptions that are made regarding the magnitude of such deformation and yield strengths or the mode of deformation used in the collapse analysis. Furthermore, this unavoidable qualitative assumption leads to the conclusion that when Part C impacts the lower structure 共Part B or Part A兲, the damage or deformation caused by the impact
JOURNAL OF ENGINEERING MECHANICS © ASCE / OCTOBER 2008 / 915
must be shared roughly equally between Part C and the lower structure. The justification for this conclusion lies in the application of Newton’s Third Law. Newton’s third law states that all forces occur in pairs and these two forces are equal in magnitude and opposite in direction. In other words, for every action force, there is an equal and opposite reaction force. Applying Newton’s third law to the collapse of the Twin Towers, it is clear that the downward force imposed on Part B by the upper Part C generates an equal but opposite upward force. It logically follows that if the downward force generated when Part C impacts Part B is destructive, then the equal and opposite upward force generated in accordance with Newton’s third law will be destructive. Instead of embracing this basic law of physics, the paper treats Part C as a rigid body during the crush-down phase, then allows Part C to start deforming only at the start of the crush-up phase: After the lower crushing front hits the ground, the upper crushing front of the compacted zone can begin propagating into the falling upper part 关C兴 of the tower . . . This will be called the crush-up phase . . . 共p. 313 of the paper兲 In this discussion, we assert that the crushing front will propagate deep into the falling Part 关C兴 long before the crushing front hits the ground, so that the upper Part C does not remain a rigid body as it crushes the lower part of the Tower. Thus, all the paper’s differential equations and integrals are questionable because they fail to comport with Newton’s third law as applies to the fundamental physical realities of each building. The paper does state that, during the crush-down phase, some crush-up may occur during “short intervals” and “only at the beginning of collapse” 共p. 313 of the paper兲. However, it is difficult to imagine, again from a basic physical standpoint, how the possibility of the occurrence of crush up would diminish as the collapse progressed. After all, it bears repeating that all the floors of each building were similar to one another from a materials, engineering, and construction standpoint. Additionally, Newton’s third law is applicable throughout the entire collapse. Thus, as the collapse progressed, the yield and deformation strength of the components of the lowest floor of the upper Part C would be very similar to the yield and deformation strengths of the highest floor of the lower structure that is impacted by Part C. Application of Newton’s third law combined with this similarity of deformation and yield strengths means that the physical reality at impact is such that the lowest floor of Part C would be just as likely to deform and buckle as the highest floor of the impacted lower structure. Moreover, an even closer inspection of the physical realities present during collapse reveals two observations that further challenge the paper’s two-phase approach. The first observation is that the columns supporting the lower floors of each tower were thicker, sturdier, and more massive than the columns supporting the upper floors because the lower sections of the columns had more weight above them to support. Therefore, it would be even more reasonable to assume that as the collapse progressed downward, the upper floors 共i.e., the floors comprising Part C兲 would be more likely than the lower floors to deform and yield during collapse. The second observation is that components that comprised the floors at and above the impact zone would have been heated by the jet-fuel-ignited fires caused by the impact of the airplanes. This heating of the upper floors would mean that the steel components there were, if anything, weaker and more likely to fail 共crush up兲 than the relatively cooler components that made up the intact lower structure of each building. Again, the paper’s collapse analysis does not take these physical realities into ac-
count and instead proceeds with a purely theoretical analysis that fails to account for the upward “reaction” forces dictated by Newton’s third law during the collapse. These upward forces will slow the downward motion of the upper floors and may arrest the collapse before it reaches the ground. The second problem with the paper lies in its characterization of the findings of the National Institute of Standards and Technology 共NIST 2005兲 in “Final Report on the Collapse of the World Trade Center Towers.” 共See p. 309 of the paper.兲 Specifically, p. 309 of the paper states that the NIST Report found that “many structural steel members heated up to 600° C, as confirmed by annealing studies of steel debris.” This statement is inaccurate because the NIST report clearly states that “These 关steel兴 microstructures show no evidence of exposure to temperatures above 600° C for any significant time” 共see NIST Report, NCSTAR 1–3, p.xli兲 共emphasis added兲. Because NIST observed no microstructural changes in the steel, the only accurate statement that can be made on the basis of this test is exactly what NIST stated, namely, that the steel temperatures were below 600° C. It does not follow, however, that the steel actually reached 600° C, or anywhere close to it, because the microstructural change that NIST was looking for does not occur until 600° C. Furthermore, the NIST report goes on to state that “Similar results, i.e., limited exposure if any above 250° C were found for the two core columns recovered from the fire affected floors.” 共emphasis added兲 Therefore, considering all the NIST Report’s physical tests, the steel showed limited if any exposure, to temperatures above 250° C. In the paper, the “limited exposure if any above 250° C” results from NIST were inexplicably transformed into “many structural steel members heated up to 600° C.” A more accurate summary of the NIST Report’s physical tests would be “By annealing studies and paint analysis of column pieces collected after the collapse, NIST documents that steel temperatures were below 600° C, and may not have exceeded 250° C.” In conclusion, although the paper goes through an in-depth mathematical derivation of equations that purport to model the collapse, it makes two fundamental errors that call into question all its derived equations. First, the paper assumed that the collapse occurred in two phases. However, we have shown that this twophase collapse scenario is scientifically implausible because it ignores Newton’s third law and the equal but opposite upward force dictated by it, as well as the physical realities of the design and construction of the Twin Towers. The paper could be revised to correct this fundamental flaw by deriving differential equations to model the collapse that take into account the energy absorbed by both the upper part 共Part C兲 and the lower structure at impact in accordance with Newton’s third law. When the upward “reaction” force that acts on the upper part is included in the analysis, it may well be found that a collapse will not proceed to completion under the influence of gravity alone. Finally, the paper’s characterization of the WTC steel temperatures from the NIST report is not accurate. NIST reported no physical evidence that steel temperatures reached or exceeded 600° C and little to no physical evidence that steel temperatures even exceeded 250° C. Consequently, the paper should be revised to accurately summarize the NIST report’s findings.
References National Institute of Standards and Technology 共NIST兲. 共2005兲. “Final rep. on the collapse of the World Trade Center towers.” NISTNCSTAR1, Siva Shyam Sunder, lead investigator, NIST, Gaithersburg, Md., 具http://wtc.nist.gov典.
916 / JOURNAL OF ENGINEERING MECHANICS © ASCE / OCTOBER 2008
Closure to “Mechanics of Progressive Collapse: Learning from World Trade Center and Building Demolitions” by Zdene˘k P. Bažant and Mathieu Verdure March 2007, Vol. 133, No. 3, pp. 308–319.
DOI: 10.1061/共ASCE兲0733-9399共2007兲133:3共308兲
Zdeněk P. Bažant1 and Jia-Liang Le2 1
McCormick Institute Professor and W. P. Murphy Professor of Civil Engineering and Materials Science, Northwestern Univ., CEE, 2145 Sheridan Rd., Evanston, IL 60208. E-mail: z-bazant@ northwestern.edu 2 Graduate Research Assistant, Northwestern Univ.
4.
Discussion by James R. Gourley The interdisciplinary interests of Gourley, a chemical engineer with a doctorate in jurisprudence, are appreciated. Although none of the discusser’s criticisms is scientifically correct, his discussion provides a welcome opportunity to dispel doubts recently voiced by some in the community outside structural mechanics and engineering. It also provides an opportunity to rebut a previous similar discussion widely circulated on the Internet, co-authored by S. E. Jones, Associate Professor of Physics at Brigham Young University and a cold fusion specialist. For the sake of clarity, this closure is organized into the points listed subsequently and rebutted one by one. 1. Newton’s Third Law: The discusser is not correct in repeatedly claiming that Newton’s third law is violated in the paper and particularly in concluding that the “two-phase collapse scenario is scientifically implausible because it ignores Newton’s third law and the equal but opposite upward force dictated by it.” As explained at the outset in every course on mechanics of materials, this law is automatically satisfied, since all the calculations are based on the concept of stress or internal force, which consists of a pair of opposite forces of equal magnitude acting on the opposite surfaces of any imagined cut through the material or structure. This concept is so central to the discipline of structural mechanics and selfevident to structural engineers that Newton’s third law is never even mentioned in publications. 2. Are the Internal Forces in Upper and Lower Parts of Tower Equal? Contrary to the discusser’s claim which is based on his understanding of Newton’s third law, these forces are not equal, as made clear by Fig. 2共g and h兲 of the original paper. Their difference is equal to the weight of the intermediate compacted layer B plus the inertia force attributable to the acceleration of layer B 共for additional accuracy, one may also add the energy per unit height needed for the comminution of concrete and the expelling of air, which are secondary phenomena not taken into consideration in the original paper兲. When the compacted layer attains a sufficient mass, which occurs after the collapse of only a few stories, this difference becomes very large. 3. Localization of Energy Dissipation into Crushing Front: In the discusser’s opinion: the hypothesis that “the energy is dissipated at the crushing front implies that the blocks in Fig. 2 may be treated as rigid, i.e., the deformations of the blocks away from the crushing front may be neglected.” This is a fundamental misunderstanding. Of course, blocks C and
A are not rigid and elastic waves do propagate into them. But the wave velocity, given by v = 冑Et / where Et = tangential modulus of steel in the loaded columns and = mass density, tends to zero as soon as the plastic or fracturing response is triggered, because in that case, Et → 0. Therefore, as explained in courses on stress waves, no wave attaining the material strength can penetrate beyond the crushing 共or plastic兲 front. Only harmless elastic waves can. Propagation of the crushing front is not a wave-propagation phenomenon. Destruction of many stories at the rate corresponding to the elastic wave speed, which would appear as simultaneous, is impossible. This is why the collapse is called progressive. Blocks C and A can, of course, deform. Yet, contrary to the discusser’s claim, they may be treated in calculations as rigid because their elastic deformations are about 1,000 times smaller than the deformations at the crushing front. Can Crush-Up Proceed Simultaneously with Crush Down? It can, but only briefly at the beginning of collapse, as mentioned in the paper. Statements such as “the columns supporting the lower floors . . . were thicker, sturdier, and more massive,” although true, do not support the conclusion that “the upper floors 共i.e., the floors comprising Part C兲 would be more likely than the lower floors to deform and yield during collapse” 共deform they could, of course, but only a little, i.e., elastically兲. More-detailed calculations than those included in their paper were made by Bažant and Verdure to address this question. On the basis of a simple estimate of energy corresponding to the area between the load-deflection curve of columns and the gravity force for crush down or crush up, it was concluded at the onset that the latter area is much larger, making crush-up impossible. We have now carried out accurate calculations, which rigorously justify this conclusion and may be summarized as follows. Consider that there are two crushing fronts, one propagating upward into the falling block, and the other downward. Denote v1 , v2 = current velocities of the downward and upward crushing fronts 共positive if downward兲; x共t兲 , z共t兲 = coordinates of the mass points at these fronts before the collapse began 共Lagrangian coordinates兲; and q共t兲 = current coordinate of the tower top. All the coordinates are measured from the initial tower top downward. After the collapse of the first critical story, the falling upper Part C with the compacted Part B impacts the stationary lower Part A. During that impact, the total momentum and the total energy must both be conserved. These conditions yield two algebraic equations 1 1 m0共1 − 兲v0 + m1关共1 − 兲v0 + v0兴 = 共m1 + 2ms兲共v1 + v2兲 2 2 1 + 共m0 − ms − m2兲v3 + m2共v1 + v2兲 2
冋
1 1 1 m0关共1 − 兲v0兴2 + m1 共2 − 兲v0 2 2 2 + v 2兲
册
2
册
2
共1兲
冋 册
1 1 = 共m1 + 2ms兲 共v1 2 2
冋
1 1 1 + 共m0 − ms − m2兲v23 + m2 共v1 + v2兲 2 2 2
2
+ ⌬Ec 共2兲
where v3 = q˙ = 共1 − 兲共v1 + vcu兲 , vcu = 关共1 − 兲v1 − v2兴 / , vcu = initial crush-up velocity 共positive if upward兲; ms = mass of one floor slab; m0 , m1 = masses of the upper Part C and of the story that was the first to collapse 共not including the
JOURNAL OF ENGINEERING MECHANICS © ASCE / OCTOBER 2008 / 917
c d 共兵关2 − 共z兲兴z˙ + 共x兲x˙其l兲 = c lg + F⬘c − Fc 2 dt
冉
Column Force P (MN)
2500
1200 2000
Crush-up ends
800
Crush-up ends
1500
m0 g
400
m0 g
1000
North Tower 0
South Tower
500
0.05
0.1
0.15
0
0.04
0.08
0.12
Displacement (m) Crush front velocity (m/s)
floor slab masses兲, m2 = mass of a single story; = 共z兲共1 − out兲 / c = mass compaction ratio where c = specific mass of compacted layer 共per unit height兲, which is constant, 共z兲 = specific mass at z in the initial intact state 共out = mass shedding ratio, as defined in the paper兲; and ⌬Ec = energy loss attributable to comminution of materials, predominantly concrete, into small fragments during impact. This energy has been calculated as 0.35ms共v12 + vcu2兲 by using the theory of comminution 共Bažant et al. 2007兲. Eqs. 共1兲 and 共2兲 assume that the momentum density varies linearly throughout the compacted layer B, and that, when the crushing front starts to propagate upward, the falling Part C moves downward as a rigid body, except that its lowest story has momentum density varying linearly 共i.e., homogenized兲 throughout the story. During impact, = 0.2 for the North Tower and 0.205 for the South Tower. For the North or South Tower: m0 = 54.18· 106 or 112.80· 106 kg, m1 = 2.60· 106 or 2.68· 106 kg, m2 = 3.87· 106 or 3.98· 106 kg, and ms = 0.627· 106 kg for both. For a fall through the height of the critical story, by solving Eq. 共2兲 of Bažant et al. 2007, one obtains the crush-front velocity v0 = 8.5 m / s for the North Tower and 8.97 m / s for the South Tower. The solution of Eqs. 共1兲 and 共2兲 yields the following velocities after impact: v1 = 6.43 or 6.80 m / s, v2 = 4.70 or 4.94 m / s, and vcu = 2.23 or 2.25 m / s for the North or South Tower. These data represent the initial values for the differential equations of motion of the upper Part C and of the compacted layer B. If Lagrangian coordinates x共t兲 and z共t兲 of the crush-down and crush-up fronts are used, these equations can easily be shown to have the following forms:
8
8
-down Crush
6
6
North Tower
4
Crus h-up e
2
nd s
0 0
0.01
0.02
4
2
0 0.03 0
wn h-do Crus South Tower Crus h-up en ds 0.005
0.01
0.015
Time (s) Fig. 1. Evolution of initial simultaneous crush up and crush down and its arrest within the first story being crushed
共3兲
冊
d m2 m共x兲兵关1 − 共z兲兴z˙ − 关1 − 共x兲兴x˙其 + x˙ = m共x兲g − F⬘c 2 dt 共4兲 where the superior dots denote derivatives with respect to time t; l = 兰xz共s兲ds = current height of the compacted layer of rubble; m共x兲 = 兰0x共s兲ds = all the mass above level x; g = gravity acceleration; and Fc and F⬘c are the normal forces in the crush-down and crush-up fronts 共note: these are internal forces, the use of which ensures that Newton’s third law will automatically be satisfied兲. The cold-steel strength is used for the story below the critical one, and a 15% reduction in steel strength due to heating is assumed for the story above the critical one. These two simultaneous differential equations have been converted to four first-order differential equations and solved numerically by the Runge-Kutta method. The solution has been found to be almost identical to the solution presented in the paper, which was obtained under the simplifying assumption that the crush-up does not start until after the crush down is finished. The reason for the difference being negligible is that the condition of simultaneous crush-up, x˙ ⬍ 0, is violated very early, at a moment at which the height of the first overlying story is reduced by about 1%. This finding further means that the replacement of the load-deflection curve in Fig. 3 of the paper by the energetically equivalent Maxwell line that corresponds to a uniform 918 / JOURNAL OF ENGINEERING MECHANICS © ASCE / OCTOBER 2008
resisting force F⬘c cannot be sufficiently accurate to study the beginning of two-way crush. Therefore, a solution more accurate than that in the paper has been obtained on the basis of Eqs. 共3兲 and 共4兲. In that solution, the variation of the crushing force F⬘c within the story was taken into account, as shown by the actual calculated resistance force labeled F共u兲 in Fig. 3 of the paper, by the force labeled F共z兲 on top of Fig. 4 of the paper, and by the resistance curves for the crushing of subsequent stories shown in Fig. 5 of the paper. The precise curve F共u兲 was calculated from Eq. 8 of Bažant and Zhou 共2002兲. Very small time steps, necessary to resolve the changes of velocity and acceleration during the collapse of one story, have been used in this calculation. Fig. 1 shows the calculated evolution of displacement and velocity during the collapse of the first overlying story in two-way crush. The result is that the crush-up stops 共i.e., 兩x˙兩 drops to zero兲 when the first overlying story is squashed by the distance of only about 1.0% of its original height for the North Tower, and only by about 0.7% for the South Tower 共these values are about 11 or 8 times greater than the elastic limit of column deformation兲. Why is the distance smaller for the South Tower even though the falling upper part is much more massive? That is because the initial crush-up velocity is similar for both towers, whereas the columns are much stronger 共in proportion to the weight carried兲. The load-displacement diagram of the overlying story is qualitatively similar to the curve with unloading rebound sketched in Fig. 共4c兲 of the paper and accurately plotted without rebound in Fig. 3 of the paper. The results of accurate computations are shown by the displacement and velocity evolutions in Fig. 1. So it must be concluded that the simplifying hypothesis of one-way crushing 共i.e., of absence of simultaneous crush-up兲, made in the original paper, was perfectly justified and caused
5.
only an imperceptible difference in the results. The crush-up simultaneous with the crush down is found to have advanced into the overlying story by only 37 mm for the North Tower and 26 mm for the South Tower. This means that the initial crush-up phase terminates when the axial displacement of columns is only about 10 times larger than their maximum elastic deformation. Hence, simplifying the analysis by neglecting the initial two-way crushing phase was correct and accurate. Why Can Crush-Up Not Begin Later? The discusser further states that “it is difficult to imagine, again from a basic physical standpoint, how the possibility of the occurrence of crush-up would diminish as the collapse progressed.” Yet the discusser could have imagined it easily, even without calculations, if he considered the free-body equilibrium diagram of compacted layer B, as in Fig. 2共f兲 of the paper. After including the inertia force, it immediately follows from this diagram that the normal force in the supposed crush up front acting upward onto Part C is F⬘c = Fc − ⌬F,
6.
7.
⌬F = mcg − mcv˙ B = mc共g − v˙ B兲
共5兲
where Fc = normal force at the crush-down front; mc = mass of the compacted zone B; vB = 关共1 − 共z兲兲z˙ + z˙兴 / 2 = average velocity of zone B; and v˙ B = its acceleration. The acceleration v˙ B rapidly decreases because of mass accretion of zone B and becomes much smaller than g, converging to g / 3 near the end of crush down 共Bažant et al. 2007兲. This is one reason that Fc is much larger than F⬘c . After the collapse of a few stories, mass mc becomes enormous. This is a further reason that the normal force F⬘c in the supposed crush-up front becomes much smaller than Fc in the crush-down front. When the compacted zone B hits the ground, vB suddenly drops to zero, the force difference ⌬F suddenly disappears, and then the crush-up phase can begin. The discussers’ statement that “the yield and deformation strength of . . . Part C would be very similar to the yield and deformation strength of . . . the lower structure” shows a misunderstanding of the mechanics of failure. Aside from the fact that “deformation strength” is a meaningless term 共deformation depends on the load but has nothing to do with strength兲, this statement is irrelevant to what the discussers try to assert. It is the normal force in the upper Part C that is much smaller, not necessarily the strength 共or load capacity兲 of Part C per se. Force F⬘c acting on Part C upward can easily be calculated from the dynamic equilibrium of Part C 共see Fig. 2g兲, and it is found that F⬘c never exceeds the column crushing force of the overlying story. This confirms again that the crush-up cannot restart until the compacted layer hits the ground. Variation or Mass and Column Size along Tower Height: This variation was accurately taken into account by Bažant et al. 共2007兲. Those who do not attempt to calculate might be surprised that the effects of this variation on the history of motion and on the collapse duration are rather small. Intuitively, the main reason is that, as good design requires, the cross-section areas of columns increase 共in multistory steps, of course兲 roughly in proportion to the mass of the overlying structure. For this reason, the effect of column size approximately compensates for the effect of the columns’ mass. Were the Columns in the Stories above Aircraft Impact Hot Enough to Fail? At one point, the discusser argues that the “steel temperatures . . . may not have exceeded 250° C,”
8.
but at another point he argues for the opposite, namely that “the heating of the upper floors would mean that the steel components were, if anything, weaker and more likely to fail 共crush up兲 than the relatively cooler components that made up the intact lower structure of each building.” If heating weakened these components, the steel temperature would have had to exceed 250° C. The discusser cannot have it both ways. It is not difficult to understand why, in the stories above the aircraft impact zone, the steel could not have attained a temperatures greater than ⬎350° C, which are necessary to cause creep under stresses in the service stress range. Although, according to NIST 共2005兲, most of the thermal insulation of steel in the aircraft impact zone was stripped by flying fragments propelled by impact and fuel explosion, nothing comparable could have occurred in the higher floors. Therefore, it must be assumed that most of the steel in the stories above the aircraft impact zone did not lose its thermal insulation. Consequently, the steel temperature in those stories could not have become dangerously high in less than the duration of the standard ASTM fire, which is 4 hours. Also, since the aircraft impact caused no serious damage to the columns in the higher stories, the stresses attributable to gravity load on these columns must have been in the service stress range, i.e., less then 30% of the yield strength of steel. Steel Temperature and NIST Report: The discusser’s statement that the “steel temperatures . . . may not have exceeded 250° C” is not a fact but a conjecture. It is neither supported nor contradicted by observations. The NIST 共2005兲 report 共Part NCSTAR-1, Chapter 6, p. 90兲 states that only 1% of the columns from the fire floors were examined for paint cracking attributable to thermal expansion. Examination of 170 areas 共spots of unspecified size兲 on 16 perimeter columns did show evidence of temperatures greater than 250° C, but only on three perimeter columns, and it is not clear whether this temperature occurred before or after collapse. Only two core columns had sufficient paint to conduct such an examination, and on these no temperature greater than 250° C was documented. But NIST cautions that “the examined locations represent less than about one percent of the core columns located in the fireexposed region.” So it is a misrepresentation of evidence to assert that, among the remaining many hundreds of unexamined columns in the aircraft impact zone, none suffered higher temperatures. Writing about the collapse process, the discusser misinterprets the NIST 共2005兲 report in stating that “NIST documents that steel temperatures were below 600° C.” Steel exposures to lower as well higher temperatures were documented, and NIST 共2005兲 共Part NCSTAR 1-3, Sec. 9.4.5, p. 132兲 cautions: “It is difficult or impossible to determine if hightemperature exposure occurred prior to or after the collapse.” So nothing has been documented with certainty by direct observations, as far as steel temperatures prior to collapse are concerned. Nevertheless, a potent logical argument that steel in the critical story was exposed to high temperatures before collapse is that the collapse calculations based on the idea of thermally influenced delayed failure of columns and on the knowledge of thermal properties of structural steel are in excellent agreement with the videos of initial motion history of the top part of both towers, with the durations of collapse
JOURNAL OF ENGINEERING MECHANICS © ASCE / OCTOBER 2008 / 919
9.
deduced from seismic records, with the observed comminution 共or pulverization兲 of concrete, and with the high velocity of ejected air implied by videos of rapidly expanding dust clouds 共Bažant et al. 2007兲. Were Very High Temperatures Necessary to Trigger Gravity-Driven Collapse? Not necessarily. It suits critics to claim that Bažant et al.’s conclusions are contingent on the hypothesis of very high steel temperatures and to attack this hypothesis as if it were the Achilles heel of these conclusions. However, the discussers overlook two crucial facts: 共1兲 After the aircraft impact, the stresses in some columns must have increased much above the range of service stresses attributable to gravity, which are generally less than 30% of the yield strength 共the stresses attributable to wind loading were zero兲; and 共2兲 the yield strength of steel is not independent of temperature. The tests reported by NIST 共2005, part NCSTAR 1-3D, p. 135, Fig. 6–6兲 show that, at temperatures 150° C, 250° C, and 350° C, the yield strength of the steel used was reduced by 12%, 19%, and 25%, respectively. Hence, any column loaded to 88%, 81%, and 75% of its cold strength, respectively, must have lost its capability to resist load soon after it was heated to the respective temperature. Although the stress values in various columns of the critical story have not been determined, it cannot be ruled out that the loads of many of the remaining columns were raised after aircraft impact above 90% of their yield strength. So, if the stress in a critical column was close enough to yield stress, it is not inconceivable that even a rise of steel temperature to mere 150° C might have triggered progressive collapse of the whole tower. The fact that some perimeter columns showed gradually increasing lateral deflections, reaching as much as 55 in. 共or 1.40 m兲 关NIST 共2005兲, part NCSTAR-1, Chapter 2, p. 32 and Fig. 2–12兴, cannot be explained as anything other than creep buckling of heated columns. In this regard, it should further be noted that the multistory bowing implies a great decrease 2 , of the critical load for creep buckling, Pcr,t ⬇ Rt2 / Leff where Rt = effective long-time bending stiffness of column, taking into account creep; and Leff = effective buckling length. The visible bowing of columns appears to have spanned about three stories, which means that Leff approximately tripled, indicating that Pcr,t may have decreased by a factor of 1 / 9 and thus may have become much less than the plastic limit load of column. What must have caused the loads of many of the remaining columns to be raised far above the service stress range and close to their load capacity is the load redistribution among the columns of the aircraft-impacted story. The asymmetry of damage within this story caused a shift of the stiffness centroid far away from the geometrical center of the tower, and thus the gravity load resultant m0g in that story developed a large eccentricity e with respect to the stiffness centroid. The resulting bending moment 共m0g兲e reduced the column loads on the less damaged side of the critical story but greatly increased them on the heavily damaged side, where the load was carried by fewer remaining columns 共the fact that the collapse came earlier for the South Tower, in which the eccentricity of aircraft impact was greater, corroborates this viewpoint兲. During the fire, the stresses in many columns on the more damaged side of the critical story were probably very close to the yield strength value of cold steel. Therefore, even a mild decrease of yield strength, by
920 / JOURNAL OF ENGINEERING MECHANICS © ASCE / OCTOBER 2008
5% to 20% after prolonged heating, sufficed to trigger progressive collapse. The decrease of yield stress upon heating depends strongly on the rate of loading or on its duration, and is properly described as time-dependent flow, or viscoplastic deformation. For 1 hour of loading, the decrease is much greater than it is for the typical duration of laboratory tests of strength, which is of the order of 1 minute. In columns, the flow leads to time-dependent buckling, which is in mechanics called viscoplastic buckling or creep buckling. A temperature rise to 250° C at high stress level can greatly shorten the critical time t* of creep buckling. Some critics do not understand the enormous destabilization potential of creep buckling. The Dorn-Weertmann relation indicates that ⑀˙ = Ane−Q/kT 共where ⑀˙ = strain rate; A = constant; n ⬇ 5; Q = activation energy of interatomic bonds; and k = Boltzmann constant; Hayden et al. 1965, Eq. 6.8; Courtney 2000; Cottrell 1964; Rabotnov 1966兲. According to Choudhary et al. 共1999兲, the typical value of Q / k for ferritic steel alloys is about 10,000° K 共and about 20,000° K according to Frost and Ashby 1982兲. Using 10,000° K, one may estimate that, upon heating from 25° C 共T0 = 298° K兲 to 250° C 共T = 523° K兲, the rate of deformations attributable to dislocation movements increases about 106 times, and more than that when using 20,000° K. For heating to 150° C, the rate increases about 104 times. This rate is what controls the rate of flow and, indirectly, the yield strength upon heating. Furthermore, the equations in the aforementioned sources and those in Sec. 9.3 of Bažant and Cedolin 共2003兲 make it possible to calculate that raising the column load from 0.3Pt to 0.9Pt 共where Pt = failure load= tangent modulus load兲 at temperature 250° C 共T = 523° K兲 shortens the critical time t* of creep buckling from 2,400 hours to about 1 hour 共note the differences in terminology: material scientists distinguish between the microstructural mechanisms of creep, occurring at low stress, and of time-dependent flow, occurring near the strength limit, whereas in structural mechanics, the term creep buckling or viscoplastic buckling applies to any time-dependent buckling regardless of microstructural mechanism; thus the source of creep buckling of steel columns at high stress is actually not creep, as known in materials science, but time-dependent flow of heated steel at high stress兲. Recently reported fire tests 共Zeng et al. 2003兲 have demonstrated that structural steel columns under a sustained load of about 70% of their cold strength collapse when heated to 250° C. However, creep of structural steel in the service stress range begins only after the steel temperature rises above 350° C 共Cottrell 1964, Frost and Ashby 1982, Huang et al. 2006兲. The aforementioned crude estimates suffice to make it clear that the combination of asymmetric load redistribution among columns in the aircraft impacted stories with the heating of steel to about 250° C 共or even less兲 was likely to lead to a loss of stability attributable to creep buckling of the most overloaded columns within the observed time. Given the sustained elevated temperature caused by the stripping of insulation and the severe and asymmetric damage to many columns, as estimated in the NIST report, it would, in fact, be rather surprising if the towers did not collapse. It would certainly be interesting to find out whether the steel temperatures were nearer 250° C or 600° C; but for de-
Column Force P (MN)
8
8
6
6
4
4
2
Pcr
True energy absorption
Assumed energy absorption
2
Pcr
0
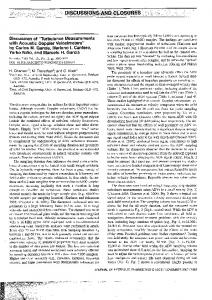
versus axial displacement u of a column 共sketched in his figure 1共c兲 and redrawn to scale as the upper curve in Fig. 2 right is not correct and grossly overestimates the energy dissipation in the column 共note that what the discusser denotes as P is in the paper denoted as F兲. The correct curve 共Fig. 2, left兲, based on the theory of plastic large-deflection buckling 共Bažant and Cedolin 2003, Sec. 8.6兲, is given by Eq. 8 in Bažant and Zhou 共2002兲 and reads
Original Scaled down
0 0
0.2
0.4
u/L
0.6
0.8
1
0
0.2
0.4
u/L
0.6
0.8
1
Fig. 2. Comparison of the correct axial load-displacement curve P共u兲 of column 共left兲 with the discusser’s incorrect curve 共right兲 plotted according to his calculations 共note that his Fig. 1共c兲 is a sketch not drawn to scale兲
ciding whether the gravity-driven progressive collapse is a viable hypothesis, the temperature level alone is irrelevant. It is a waste of time to argue about it without knowing the stresses. If the stress in the column whose failure caused the critical floor to lose stability was greater than 90% of the cold yield strength, a mere 150° C would have sufficed to trigger overall collapse; and if this stress was 75%, 350° C would have been necessary. None of these situations can be excluded without precise calculations of the stress evolution in all the columns in the heated critical story. Feasible though such calculations are, they would necessitate a laborious extension of the study by NIST. It was hypothesized that the lateral bowing of perimeter columns was caused mainly by a horizontal pull from steel trusses sagging because of differential thermal expansion. However, this hypothesis is not credible. As simple calculations show, the temperature difference between the lower and upper flanges of a floor truss would have to exceed 1,000° C to produce a curvature that would shorten the span of a sagging floor truss by 52 in. 共1.40 m兲. Such a temperature difference is inconceivable. The differential thermal expansion must have been only a secondary triggering factor, which created a small initial imperfection in the overloaded columns, to be subsequently drastically magnified by creep buckling. Closing Comments Although everyone is certainly entitled to express his or her opinion on any issue of concern, interested critics should realize that, to help discern the truth about an engineering problem such as the WTC collapse, it is necessary to become acquainted with the relevant material from an appropriate textbook on structural mechanics. Otherwise critics run the risk of misleading and wrongly influencing the public with incorrect information.
Discussion by G. Szuladzinski The interest of Szuladzinski, a specialist in homeland security, is appreciated. After close scrutiny, however, his calculations are found to be incorrect, for reasons explained in the following. 1. Load-Displacement Curve of Columns and Energy Absorption Capacity: The discusser’s curve of axial load P
冉
P共u兲 = min m0g + EAu/L, A0,
4M 0
L冑1 − 共1 − u/L兲2
冊
共6兲
for 0 ⱕ u ⬍ L 共 = compaction ratio, assumed to be 0.2; m0 = mass of falling top part of tower; A = cross-sectional area of column; L = its height; M 0 = its plastic yield moment; u = axial shortening of column;兲. The expression ⌸1 = 4M 0, which is used in the discussion to calculate the energy dissipation in the plastic hinges of each column, is correct. But the subsequent discussion consists of incorrect arguments that enormously exaggerate the estimate of the kinetic energy of the upper part of tower required to trigger progressive collapse. • Calculating the yield bending moment in the column, the discusser assumes the yield strength 共or the flow stress兲 of steel to be 0 = 500 MPa. This value would be appropriate for high-strength steel used in the lower stories but not for the normal 共36 ksi兲 steel used in the upper stories impacted by aircraft, for which 0 = 250 MPa in the North Tower. • It is assumed in the discussion that the rotations in plastic hinges terminate at = 75°. Higher rotations, either plastic or accompanied by fracture, cannot be ruled out. • The discusser’s expression P0 = M 0 / 0.3L sin 2 for the lowest point of his P共u兲 curve is not correct. This expression was apparently derived from equilibrium of the column segment as a free body, as shown in Fig. 5共c兲 of Bažant and Zhou 2002, but only one of the two plastic moments M 0 acting at the segment ends 共shown in that figure兲 was considered. Considering both plastic moments in that figure, one gets the correct expression P0 = 2M 0 / 0.3L sin 2. • The discusser assumes the upper and lower plastic hinges to be located at distances 0.2L from the column ends, rather than at the column ends. This assumption causes the rotation = 75° to be reached when the story height L is reduced only by u = 0.445L 关Fig. 1共c兲兴 rather than by 0.8L. • For the curve P共u兲 beyond the point u = 0.445L, the discusser assumes a rising parabola 关see his Fig. 1共c兲 and Fig. 2 right, in this closure兴 instead of a continued softening response up to u = 0.8L 共Fig. 2 left兲. This assumed parabola greatly exaggerates the estimate of energy dissipation in the column. There is no reason for increasing resistance P共u兲 until the debris is fully compacted. The debris behaves like gravel. From soil mechanics, it is known that when the density of a random system of particles such as sand, gravel, or debris is less than a certain critical density, the neighboring particles do not have a sufficient number of contacts to support load. Thus, thinking that flying and colliding debris in the tower can support any load is a mistake. Upon reaching the critical density 共which the discusser assumes to occur at u = 0.8L兲, all the particles of debris suddenly lock in a sufficient number of contacts preventing their relative movements, and only then the compacted debris can support load. Hence, the P共u兲 curve should
JOURNAL OF ENGINEERING MECHANICS © ASCE / OCTOBER 2008 / 921
descend up to the moment of critical density of debris, which is about the same as the density of the heap on the ground, and then rise sharply, as shown in Fig. 3 of the paper and also in Fig. 2, left, of this closure. • The discusser terminates the rising parabola at the load Pm = 2Pcr = 8,584 kN, i.e., at double the plastic critical load. But this guess is unrealistic. It scales the entire rising parabola upward and thus again enormously exaggerates the energy dissipation in the column 共note that here Pcr = Pt = 0A = tangent modulus load= plastic limit load because a long yield plateau exists; 0 = yield strength兲. • In stating that “the walls of the column will be folding, one onto another, thereby compensating for that decrease of resistance,” the discusser ignores that, at large rotations, the flanges and webs of inelastic hinges in steel I-beams or box beams buckle locally and that the cross section gets folded and squashed. Such behavior greatly reduces the resisting bending moment in the hinges, and ignoring it exaggerates the energy dissipation in the column. • Even more important, the discusser ignores that, because of fracture at large hinge rotations, the resisting bending moments in the inelastic hinges must have suddenly dropped to zero. Here a reverse interpretation is required for his statement that “there was an absence of ‘kinks’ or ‘elbows’ from bent columns sticking out and visible in the early phase of the fall.” Their absence can only mean that those column pieces that were seen flying separated by fracture, and thus confirms that the column resistance P共u兲 for large displacements u must have decreased, rather than increased, compared with that calculated from Eq. 共9兲 of Bažant and Zhou 共2002兲. To take the weakening of plastic hinge and fracture of some hinges into account, the entire column resistance curve P共u兲 is reduced by a factor estimated as 2 / 3 in Bažant et al. 共2007兲. • Finally, the discusser ignores NIST’s observation of huge multistory inward bowing of some perimeter columns before collapse. This observation implies multistory buckling of columns in the aircraft-impacted zone, for which the critical load Pcr共=Pt兲 is an order of magnitude less than it is for single-story buckling. As a result of all these erroneous arguments, it must now be concluded that the energy dissipation, ⌸1, of one column is about 44% of that calculated from the discusser’s input values but the correct P共u兲 curve. This becomes only about 15% if the excessive yield strength of upper columns assumed by the discusser is corrected and if the P共u兲 curve is scaled down to approximately account for the average column weakening by fracture and local flange buckling 共as done in Bažant et al. 2007兲. 2. Does Excess of Pcr over Gravity Load m0g Imply Arrest of Collapse? Not at all, and this point is generally misunderstood by critics. In the discussion section entitled “Initial Phase of Collapse—Heavily Damaged Story,” the premise that “to cause initiation of failure, the buckling force Pcr had to be reduced to the level of applied load,” would be correct in statics but not in dynamics, where the inertia forces must be taken into account, according to the d’Alembert principle. The fact that Pcr exceeds the applied load 共i.e., Pcr ⬎ m0g兲 does not mean that the motion of the falling mass would get instantly arrested 共which would require an infinite upward acceleration 兩u¨兩 and thus an infinite resisting force兲. Rather, it simply means that the downward motion will continue as decelerated 共Fig. 3兲 until the sum of the resisting
C
Dynamic equilibrium:
∑ m0 g m0 u&& Inertia Force
u
P (u ) = m0 g + m0 u&& > m0 g
u&& < 0 deceleration
∑ P(u ) of all columns
Fig. 3. Forces in dynamic equilibrium of upper Part C of tower at the beginning of crush down
3.
922 / JOURNAL OF ENGINEERING MECHANICS © ASCE / OCTOBER 2008
forces P共u兲 of all columns of the story 共which begins with the plastic critical load Pcr兲 drops below m0g. After that, the resistance P共u兲 becomes less than m0g, which means that the downward motion will be accelerated. This is clear from the calculated diagrams shown in the second and third rows of Fig. 4 in the paper. Misled by the omission of inertia force 共Fig. 3兲, the discusser reduces the critical load Pcr by the factor of 5.59 to make it equal to the gravity load 共Fig. 2, right兲. This is impossible. The column strength is an objective property of the material and of the column geometry and not some fictitious property that can be adjusted according to the load to achieve static equilibrium. Equally arbitrary and incorrect is the discusser’s scaling down the entire descending part of resisting curve P共u兲, in which he assumes that the minimum of P and the entire rising part of P共u兲 should be scaled down by the factor of 2 共the lower curve in Fig. 2, right兲. The resulting column resistance curves P共u兲 are compared in Fig. 2. Note that, in spite of the scaling down, the area under this P共u兲-curve 共Fig. 2, right兲, representing the energy absorption capability, is still much greater than the area under the correct P共u兲-curve 共Fig. 10, left兲. The reason is that the parabolic shape is very different from the correct shape for largedeflection buckling, and that the rising part of the curve should not be present at all. The present corrections to the calculation of energy absorption capability of a column are consistent with the value originally given in Eq. 3 of Bažant and Zhou 共2002兲. The energy absorption capability of all the columns of the first cold story in crush down represents only about 12% of the kinetic energy of impact of the upper part. Is the Equation of Motion for Calculating the Duration of Fall Correct? It is not. Under the heading “Duration of Fall,” the discusser writes the equation of motion 共Newton’s law兲 as d共mv兲 / dt = m0g 共in the discusser’s notation, m is M, and m0 is M 0兲. He states that “M 0 is the mass of the upper part of the building,” and argues that “the net effect of gravity applies now only to M 0.” This statement is incorrect. The accreted mass, which he denotes as z, does not disappear and thus is also subjected to gravity. Therefore, the discusser’s equation of motion for the falling mass must be revised as d关m共t兲v兴 / dt = m共t兲g, and the solution is totally different from the last equation of the discusser. This is, of course, only the most simplified form of the equation of motion, originally applied to WTC collapse by E. Kausel of MIT 共Kausel 2001兲. A realistic form of the equation of motion must take into account the energy dissipation Fc per unit height, the debris compaction ratio, and the mass shedding ratio, as shown in Eq. 共12兲 of the paper.
4.
For the resistance to motion near the end of collapse, it is also necessary to include the energy per unit height required for the comminution of concrete floor slabs and walls and for expelling air at high speed, which is found to be close to the speed of sound 共Bažant et al. 2007兲. The discrepancy between the observed collapse duration and the collapse duration of 23.8 s calculated by the discusser does not support his conclusion that “the postulated failure mode is not a proper explanation of the WTC Towers collapse.” Rather, what this discrepancy means is that the discusser’s calculations are erroneous. The collapse duration calculated in the paper for the most realistic choice of input values is in agreement with the observations. Moreover, a more accurate analysis by Bažant et al. 共2007兲 is found to be in nearly perfect agreement with the video records of motion, available for the first few seconds of collapse, as well as with the available seismic records for both towers. Could Stress Waves Ahead of Crushing Front Destroy the Tower? They could not. The discusser is, of course, right in pointing out that the “stress wave . . . will partially reflect from all the discontinuities” 共though not only “reflect” but also “diffract”兲. But while alluding to shock fronts, he is not right in stating that a “shock loading . . . will greatly magnify the effect of all discontinuities.” Since the stress-strain diagram of the steel used, as reported by FEMA 共Figs. B-2 and B-3 in McAlister 2002兲, exhibits a long yield plateau, rather than hardening of gradually decreasing slope, the shock front coincides with the crushing front, which is not a wave phenomenon. The only waves than can penetrate ahead of this front are elastic. When these waves hit discontinuities such as joints, local energy-absorbing plastic strains and fractures will be created, and what will be reflected and diffracted will be weakened elastic waves. Thus it is not true that “during such reflections, enhancements take place.” Rather, the energy of these waves ahead of the crushing front will quickly dissipate during repeated reflections and diffractions, and only noncatastrophic localized damage will happen to the structure until the crushing front arrives. To sum up, the existence of stress waves ahead of the crushing front does not cast any doubt on the analysis in the paper.
Conclusion Although closing comments similar to those in the preceding discussion could be repeated, let it suffice to say that the discusser’s conclusion that “the motion will be arrested during the damaged story collapse and the building will stand” is incorrect. Thus, the recent allegations of controlled demolition are baseless.
References Bažant, Z. P., and Cedolin, L. 共1991兲. Stability of structures: Elastic, inelastic, fracture and damage theories, 2nd Ed., Dover Publications, New York. Bažant, Z. P., Le, J.-L., Greening, F. R., and Benson, D. B. 共2008兲. “Collapse of World Trade Center Towers: What did and did not cause it?” Structural Engineering Rep. 07–05/C605c, December revision, Northwestern Univ., Evanston, Ill., also J. Eng. Mech., 134共10兲, 892–906.
Bažant, Z. P., and Zhou, Y. 共2002兲. “Why did the World Trade Center collapse?—Simple analysis.” J. Eng. Mech., 128共1兲, 2–6. Choudhary, B. K., Bhanu, Sankara, Rao, K., Mannan, S. L., and Kashyap, B. P. 共1999兲. “Serrated yielding in 9Cr-1Mo ferritic steel.” Mat. Sci. Technol., 15共7兲, 791–797. Cottrell, A. H. 共1964兲. The mechanical properties of matter, Wiley, New York 共Sec. 7.3兲. Courtney, T. H. 共2000兲. Mechanical behavior of materials, McGraw-Hill, New York 共Sec. 7.3兲. Frost, H. J., and Ashby, M. F. 共1982兲. Deformation-mechanism maps: The plasticity and creep of metals and ceramics, Pergamon Press 共Sec. 8兲, New York. Hayden, H. W., Moffatt, W. G., and Wulff, J. 共1965兲. The structure and properties of materials. Vol. 3, J. Wiley, New York 共Sec. 6.8兲. Huang, Z. F., Tan, K.-H., and Ting, S.-K. 共2006兲. “Heating rate and boundary restraint effects on fire resistance of steel columns with creep.” Eng. Struct., 28共6兲, 805–817. Kausel, E. 共2001兲. “Inferno at the World Trade Center.” Tech Talk 共Sept. 23兲, MIT, Cambridge, Mass. McAllister, T., ed. 共2002兲. “World Trade Center Building performance study: Data collection, preliminary observations, and recommendations.” Federal Emergency Management Agency (FEMA) Rep. No. 403, FEMA, Washington, D.C. National Institute of Standards and Technology 共NIST兲. 共2005兲. Final rep. on the Collapse of World Trade Center Towers NI-ST-NCSTAR 1, NIST, Gaithersburg, Md. Rabotnov, Y. N. 共1966兲. Polzuchest’ elementov konstrukcii, Nauka, Moscow 共Sections 42–45兲. Zeng, J. L., Tan, K. H., and Huang, Z. F. 共2003兲. “Primary creep buckling of steel columns in fire.” J. Constr. Steel Res., 59共8兲, 951–970.
Discussion of “Reliability Analysis of Single-Degree-of-Freedom Elastoplastic Systems. I: Critical Excitations” by Siu-Kui Au, Heung-Fai Lam, and Ching-Tai Ng October 2007, Vol. 133, No. 10, pp. 1072–1080.
DOI: 10.1061/共ASCE兲 0733-9399 共2007兲133:10共1072兲
Izuru Takewaki1 1
Professor, Dept. of Urban and Environmental Engineering, Kyoto Univ., Nishikyo, Kyoto 615-8540, Japan. E-mail: takewaki@ archi.kyoto-u.ac.jp
The authors present an interesting method for reliability analysis of single-degree-of-freedom 共SDOF兲 elastoplastic systems. The application of an importance sampling method is investigated to estimate the first passage probability of SDOF elastoplastic systems subjected to white noises. The authors use the concept of critical excitation in the reliability analysis of SDOF elastoplastic systems. They also present a brief review of the history of critical excitation methods. It is desired that the following issues be addressed appropriately. First, almost all readers may believe that the proposed shape of critical excitations is rather unrealistic from the viewpoint of earthquake engineering because the ground motions as vibration phenomena of the ground should be treated to be nearly symmetric with respect to the central zero point 共Drenick 1970; Ben-Haim and Elishakoff 1990; Takewaki 2002b, 2006b兲. Whereas the progressive collapse may be a kind of collapse type that induces progressive plastic deformation, the correspond-
JOURNAL OF ENGINEERING MECHANICS © ASCE / OCTOBER 2008 / 923
ing disturbance is usually symmetric with respect to the central zero point. The proposed critical excitation appears to be strongly unsymmetric, and the center of ground motion moves conspicuously to one direction 共see Figs. 3–5 in the original paper兲. In wind engineering, this shape of critical excitation may be acceptable. Second, some useful critical excitation methods competitive with the proposed one have already been presented for both SDOF and multi-degree-of-freedom 共MDOF兲 systems 共Drenick 1977; Takewaki 2001, 2002a, 2006b; Abbas and Manohar 2005; Elishakoff 2007兲. These papers consider the stochastic property of excitations and the elastoplastic property of structural models. Those papers seem to be of broader applicability to both SDOF and MDOF systems. Unfortunately, these papers are not in the reference list of the paper under discussions. Third, a comprehensive review of critical excitation methods was presented by the discusser several years ago 共Takewaki 2002b兲. This review includes both deterministic and probabilistic approaches together with elastoplastic responses. Unfortunately, it appears that this review was not brought to the authors’ attention. Fourth, the authors propose an interesting approach using the energy 共or input energy兲 as the objective function for criticality. The critical excitation method including the input energy or input energy rate, related to the maximum displacement, as the objective function for criticality has already been developed for linear elastic systems 共Takewaki 2004, 2006a,b; Elishakoff 2007兲. Unfortunately, the paper under discussion does not refer to these works. The discusser would like the authors to place their interesting and important paper in the appropriate history of critical excitation methods by referring to other competitive works and reviews.
References Abbas, A. M., and Manohar, C. S. 共2005兲. “Reliability-based critical earthquake load models. Part II: Nonlinear structures.” J. Sound Vib., 287共4–5兲, 883–900. Ben-Haim, Y., and Elishakoff, I. 共1990兲. Convex models of uncertainty in applied mechanics, Elsevier, New York. Drenick, R. F. 共1970兲. “Model-free design of aseismic structures.” J. Engrg. Mech. Div., 96共4兲, 483–493. Drenick, R. F. 共1977兲. “The critical excitation of nonlinear systems.” J. Appl. Mech., 44共E2兲, 333–336. Elishakoff, I. 共2007兲. “Book review of critical excitation methods in earthquake engineering by I. Takewaki.” Shock Vib., 14共6兲, 469–470. Takewaki, I. 共2001兲. “Probabilistic critical excitation for MDOF elasticplastic structures on compliant ground.” Earthquake Eng. Struct. Dyn., 30共9兲, 1345–1360. Takewaki, I. 共2002a兲. “Critical excitation for elastic-plastic structures via statistical equivalent linearization.” Probab. Eng. Mech., 17共1兲, 73–84. Takewaki, I. 共2002b兲. “Seismic critical excitation method for robust design: A review.” J. Struct. Eng., 128共5兲, 665–672. Takewaki, I. 共2004兲. “Bound of earthquake input energy.” J. Struct. Eng., 130共9兲, 1289–1297. Takewaki, I. 共2006a兲. “Probabilistic critical excitation method for earthquake energy input rate.” J. Eng. Mech., 132共9兲, 990–1000. Takewaki, I. 共2006b兲. Critical excitation methods in earthquake engineering, Elsevier Science, Oxford.
Closure to “Reliability Analysis of Single-Degree-of-Freedom Elastoplastic Systems. I: Critical Excitations” by Siu-Kui Au, Heung-Fai Lam, and Ching-Tai Ng October 2007, Vol. 133, No. 10, pp. 1072–1080.
DOI: 10.1061/共ASCE兲0733-9399共2007兲133:10共1072兲
Siu-Kui Au1; Heung-Fai Lam2; and Ching-Tai Ng3 1
City Univ. of Hong Kong, Dept. of Building and Construction, 83 Tat Chee Ave., Kowloon, Hong Kong. E-mail:
[email protected] 2 City Univ. of Hong Kong, Dept. of Building and Construction, 83 Tat Chee Ave., Kowloon, Hong Kong. E-mail:
[email protected] 3 City Univ. of Hong Kong, Dept. of Building and Construction, 83 Tat Chee Ave., Kowloon, Hong Kong. E-mail: 50410377@ student.cityu.edu.hk
The writers thank Professor Takewaki very much for his constructive discussion on the subject paper. The writers would like to first clarify that the critical excitation problem on which the original paper focused differs from those to which the discusser refers. The confusion stems from use of the term critical excitation for the two different classes of problems. Perhaps the term design point excitation instead of critical excitation in the subject paper may help avoid confusion. The writers thank the discusser for raising this issue. Technically, the critical excitation problem relevant to the first passage problem in the subject paper is to find the excitation in the time domain with minimum energy 共in the sense of 2-norm兲 that pushes the SDOF elastoplastic oscillator to a given threshold barrier 共positive for up-crossing; negative for down-crossing兲. In the time domain, this problem originally involves the optimization of infinitely many variables, which represent the value of excitation at different times. This critical excitation problem is relevant to the first passage problem because for a system under stationary white-noise excitation, the most probable point of the failure region in the 共theoretically infinite-dimensional兲 load space, i.e., the design point, is the one that has minimum energy in the time domain. In the context of the original paper, the objective function to be optimized, i.e., the definition of criticality, must be compatible with the specification of the first passage problem 共as a stochastic dynamics problem兲 and is not subject to the user’s preference. The critical excitation problems to which the discusser referred, however, present a different class of problems where the objective is to optimize the stochastic model for the excitation 共within a parameterized class of stochastic models兲 by using an objective function and under constraints that are freely specified on the basis of the user’s preference. The objective functions and constraints depend on the preferred design basis rather than on the theoretical setup of the first passage problem. For example, one may optimize the power-spectral density function within a parameterized class to maximize the mean-square response subject to bounds on the total area and magnitude of the power spectrum. Takewaki 共2002b兲 has an excellent review in that area. In short, the critical excitation in the paper under discussion is a deterministic excitation in the time domain, which is the design point in the load space of the associated first passage problem in stochastic dynamics. It is merely used as a tool for solving the first passage problem by employing importance sampling, and it need not directly address design considerations. The critical excitation in the problems to which the discusser referred is a stochastic excitation model that optimizes an objective function
924 / JOURNAL OF ENGINEERING MECHANICS © ASCE / OCTOBER 2008
and is subject to constraints chosen on the basis of design considerations; it need not help solve a first passage problem. The writers are certainly aware of the important work to which the discusser referred, and in fact some of the papers to which the discusser referred have been cited in a previous paper 共Au 2005兲, which develops the solution for the critical excitation used for solving the first passage problem in the paper under discussion. Perhaps the literature is better reflected by a distinction between the two classes of problems and work cited accordingly. The writers were not aware of the book published by the discusser in 2006 when they prepared the manuscript. The book will no doubt be an excellent source of reference in the future. Regarding the shape of the critical excitation, the writers would like to point out that the critical excitation in the subject paper should be recognized as the design point in the load space of the first passage problem and should not be taken as a typical random excitation that one will see given a first passage failure scenario. By definition, it is the most probable point in the failure region, but this most probable point is not typical 共in the sense of Shannon’s information theory兲, given failure. This subtle difference between maximum likelihood and typicality is especially pronounced in high 共infinite兲 dimensional problems. In the context of the subject paper, given a first passage failure event, a randomly picked 共typical兲 excitation looks just like an uncensored sample of white noise in the time domain and its probability density is much smaller than that of the critical excitation. In contrast, the critical excitation has maximum likelihood con-
ditional on failure but it will almost surely not appear when failure occurs. For the purpose of solving the first passage problem using importance sampling, one is only concerned with whether the critical excitation obtained has maximum likelihood conditional on failure. However, every random excitation produced by the optimized stochastic model in the context of the discusser’s work is typical; asking whether it is realistic, is legitimate and important. Last but not least, regarding symmetry, it is in fact retained in the critical excitations obtained in the paper under discussion. For a double-barrier problem, for a given first passage time there are two design points, one driving the response toward the positive barrier and the other toward the negative barrier. The one for the negative barrier was not shown in the paper to save space. The sequencing of pulses of the critical excitation in the time domain reveals a complexity stemming from hysteresis. It appears to be quite intuitive when viewed in the time domain, but less so in the frequency domain, as studied by Westermo 共1985兲.
References Au, S. K. 共2005兲. “Critical excitation of elasto-plastic systems.” J. Sound Vib., 296, 714–733. Takewaki, I. 共2002兲. “Seismic critical excitation method for robust design: A review.” J. Struct. Eng., 128共5兲, 665–672. Westermo, B. D. 共1985兲. “The critical excitation and response of simple dynamic systems.” J. Sound Vib., 100共2兲, 233–242.
JOURNAL OF ENGINEERING MECHANICS © ASCE / OCTOBER 2008 / 925