Disease Classification and Prediction using Principal Component Analysis and Ensemble Classification Framework Vanishri Arun Department of Information Science and Engineering Sri Jayachamarajendra College of Engineering, Mysuru, Karnataka, India Email-
[email protected]
Arunkumar B V BGS Apollo Hospital, Mysuru, Karnataka, India Email-
[email protected]
Padma S K Department of Information Science and Engineering Sri Jayachamarajendra College of Engineering, Mysuru, Karnataka, India Email-
[email protected]
Shyam V Forus Healthcare Pvt. Ltd.,Bengaluru, Karnataka, India Email-
[email protected] Abstract- The healthcare industry gathers enormous amount of clinical data which has a large set of diagnostic features and recorded details of patients for certain diseases. These data have to be mined to discover hidden information for effective decision making. Clinical data classification through data mining helps in finding out hidden information from large research datasets and also helps in visualizing the results to predict diseases and treatment rather than a clinical environment where a clinician reaches a treatment decision based on his theoretical knowledge, information attained from patients and the clinical reports of patient. Principal Component Analysis (PCA) has been used in this paper to find the minimum number of attributes to enhance the classifiers for faster execution, cost-effectiveness and accuracy. Using PCA we intend to find the relevant features of the data sets. An ensemble classification framework is used which consists of three modules, namely data acquisition and preprocessing, classifier training and Hierarchical Majority Voting (HMV) ensemble model for disease classification and prediction. Keywords – Non-Communicable Diseases, Data Mining, Principal Component Analysis, Hierarchical Majority Voting
I. INTRODUCTION In the clinical environment there is a significant advance in the amount of data generated and collected. Technology has played a major role in the growth of our ability to analyze and understand the data to diagnose diseases and for early treatment. For such decision making it is essential to mine the clinical data. Various Data mining techniques are available to derive new patterns from the dataset by combining different data sources Clinical data are useful to predict various diseases, provide proper treatment to cure disease, reduce mortality rate and help the government to formulate national programs to improve quality of life and avoid preventable deaths [1]. Our study discusses about usage of Principal Component Analysis (PCA) to find the relevant features of the data sets and ensemble framework for disease classification and prediction with three layered approach. In rural India, the economic conditions of people are affected due to increased Non-Communicable Diseases (NCD) causing increased mortality rate. In our study, Diabetes, Hypertension and Obesity are considered which represent global burden of diseases and cause deaths each year [2]. Some of the risk factors associated with the occurrence of NCDs are HbA1c: Glycated hemoglobin, Blood sugar levels, duration of diabetes, family history of diabetes, Nephropathy , Neuropathy, Smoking, alcohol consumption, abdominal circumference, Blood Pressure, etc. NCD, if
not treated, increases a patient’s tendency to develop other complications like cardiac diseases, strokes, eye-related diseases like Diabetic Retinopathy, Nephropathy, Neuropathy, etc. [3] In clinical environment, the data collection involves high-dimensional data and it is required to transform highdimensional data into a relevant representation of reduced-dimensional data. The reduced-dimensional data must have the minimum number of features needed to predict various non-communicable diseases. PCA helps in reducing complex dataset into a reduced-dimensional data to mine hidden data and derive new patterns from the dataset to predict diseases so that treatment is provided at the right time and place. Principle component analysis (PCA) is a statistical technique used in many applications like face recognition, pattern recognition, image compression and data mining. PCA can be generalized as multiple factor analysis and as correspondence analysis to handle heterogeneous sets of variables and quantitative variables respectively. Mathematically PCA depends on Singular Value Decomposition (SVD) of rectangular matrices and Eigen decomposition of positive semi definite matrices. [4] In this study, using PCA we intend to find the relevant features of the dataset for the prediction of Diabetes. PCA reduces the size of a dataset by retaining maximum of information about original dataset. PCA includes a mathematical procedure that converts a large set of correlated variables into a smaller set of uncorrelated variables called principal components (PCs) [4]. In other words the problem can be stated as follows: Given the d-dimensional random variable x = (x1, ..., xd) T, Find a lower dimensional representation of it , y = (y1, ..., yD) T with D. Thus, dimensionally reduced dataset acts as the input to HMV ensemble model to classify and predict diseases providing better results than the traditional approach which also improves the accuracy, reduces the noise and irrelevant data. HMV Ensemble model: Dimensionally reduced dataset acts as the input to HMV ensemble model to classify and predict diseases. It provides better results than the traditional approach which also improves the accuracy, reduces the noise and irrelevant data. The ensemble framework consists of three modules, namely data collection and preprocessing, training the classifier and HMV ensemble model for disease classification and prediction [5]. II. PROPOSED ALGORITHM The proposed model has the following three objectives: 2.1 Specific: Analyze large sets of training records consisting of medical research data and with the help of which it must produce insights regarding the medical disorders faced by various individuals noted in the research datasets. Also the Classifier must accurately predict the medical disorders based on the available information and narrow down to a conclusion stating the possible disorder the information might resemble. 2.2 Measurable: The program accepts inputs regarding the various test results of patients who are being analyzed for possibility of being Diabetic. Program calculates the distance of each input attribute from the training sets in order to calculate the means with each attribute and finally apply weighted classifier to come to a conclusion whether the patient is diabetic or not and displays the output indicating the same. 2.3 Action Oriented: o Accept input from user through app developed for data collection. o Query the datasets for Mean and Weight assignment. o Calculate the deviation of attributes using Distance Formula. o Apply the weight factor for the distances. o Compare the final value with the mean and conclude whether or not diabetic. Fig 1 shows the flow diagram of classification process starting from dataset generation to decision making. The Algorithmic implementation includes 4 major steps: Step 1: Data collection and pre-processing: Data collection :The features utilized for this work were taken from the data acquired through a screening project at Srikshetra Suttur, Nanjangud Taluk, Mysuru in association with JSS Medical College, Mysuru, Karnataka, India. Screening involved simple clinical examination comprising of relevant questions and easily conducted physical measurements [5]. Pre-processing : This module includes feature selection, missing value imputation, removal of noise and outlier detection. Principal Component Analysis is used for feature selection from medical datasets. The dataset is transformed into a reduced-dataset using PCA by selecting the most relevant features. The features with maximum variance is ordered higher than the features with least variation. PCA employs the entire patient record attributes with non-communicable diseases (Diabetes, hyper tension and obesity) risk factors and acquires a set of projection attribute vectors to extract most important global variable and data vector from given training samples.The dataset
Disease Classification and Prediction using Principal Component Analysis and Ensemble Classification Framework consists of a total of 32 features which was reduced to 8 features using PCA to feed into HMV for disease prediction. Outlier detection and elimination: The proposed HMV method uses Grubb’s test for outlier detection and elimination from medical datasets [6]. Grubbs' test is a statistical test used to detect outliers in a dataset and is based on the assumption of normality[7].
Fig 1: Flow Diagram of Classification process
Step 2: Classifier Training: Classifier training module is used to perform further computations on preprocessed data. Training set is a labeled dataset used for ensemble training. The instances of training set are described as attribute-value vectors. For instance, let A denote the set of input attributes containing n attributes: A = {a1,. . .,ai,. . .,an} and y represent the class variable. The base classifiers are trained which are utilized for disease classification and prediction using training dataset. Step 3: Classification through Majority voting ensemble scheme: (HMV) The most challenging task is the selection of optimal set of classifiers to construct an ensemble. The quality of HMV ensemble is achieved based on Accuracy and Prediction of the classifiers. Weighted voting scheme considers the weight of each classifier. It combines the results of base classifiers and the ensemble model will output the class which has the highest weight associated with it. The weights to each classifier can be assigned on the basis of classification accuracy. The highest weight will be assigned to the classifier which has the highest accuracy. The final prediction will be done based on highest weighted vote. Majority voting (MV) ensemble scheme classifies an unlabelled instance into a class that obtains the high number of votes. MV method is used to compare performance of different models. HMV ensemble framework uses diverse set of base classifiers like naïve Bayes (NB), Linear regression(LR) , Quadratic Discriminant Analysis (QDA),Support Vector machine(SVM), K-Nearest Neighbor(kNN) and Decision trees (DT) . The selection of classifier is done in three phases. In the first phase NB, LR and QDA are considered. Naïve Bayes (NB) classifier considers each attribute independently without considering the relationships between them. The prediction of NCDs involves relationships between attributes. The limitation of NB classifier is overcome
by Linear regression (LR)and Quadratic Discriminant Analysis (QDA) [5]. Majority voting (MV) ensemble approach is used to select the classifier. MV ensemble will label as either class 0 or 1. In the second phase SVM and kNN classifiers are added to the output of the first phase. kNN is a distance based classifier where the training instances are stores. It classifies a new instance based on training dataset and it does not build a model explicitly. SVM classifier works only on subset feature space and has the capability of outlier detection, classification and regression analysis. In the third phase, the output of the second phase classifiers is combined with Decision tree (DT)that works well with both numerical and categorical data. Large amount of data is handled well in reasonable time using DT. Each tree will generate an output in the form of either 1 or 0. There will be 3 outputs in the third phase. One result of second phase classifiers and Two outputs of DT. Majority voting is then applied at these outputs and final prediction is obtained as either 0 or 1 and that will be the class label of the test instance. Since each classifier has some strengths and weaknesses, they are resolved by combination of classifiers. The output of the ensemble classifier will be the class with the maximum votes by base classifiers/models. In Weighted voting scheme, the weight of each classifier is considered and the results of base classifiers are combined. The output of the ensemble model will be the class which has highest weight associated with it. The weights to each classifier are assigned based on the classification accuracy and the highest weight is assigned to the classifier having highest accuracy and vice versa. The final prediction will be done based on highest weighted votes. Step 4: Classifier testing: Testing process is done by posing new datasets to the classifier and analyze how accurately the datasets are generalized in order to narrow down to a conclusion. Also we need to analyze and document how the classifier handles the datasets with anomalies and very wide deviations. III. EXPERIMENTAL RESULTS The following are the attributes (all numeric-valued) used for the Classification as per PIMA Indian Diabetes database [8] : Number of times pregnant Plasma glucose concentration a 2 hours in an oral glucose tolerance test | normal :70–130 mg/dL Diastolic blood pressure (mm Hg) | normal: 80-89 Triceps skin fold thickness (mm) 2-Hour serum insulin (mu U/ml) | normal: 16-166 mIU/L Body mass index (weight in kg/(height in m)^2) | normal: 18.5 to 24.99 Diabetes pedigree function | normal 0.47 Age (years) Class variable (0 or 1) Table 1 shows the Statistical Analysis where mean and standard deviation are computed for each attribute considered [8]. Table 1 : Statistical Analysis Attribute number 1. 2. 3. 4. 5. 6. 7. 8.
Mean 3.80 120.90 69.10 20.50 79.80 32.00 0.50 33.20
Standard Deviation 3.40 32.00 19.40 16.00 115.20 7.90 0.30 11.80
Disease Classification and Prediction using Principal Component Analysis and Ensemble Classification Framework
The calculations of the deviation of the attributes with respect to the test datasets are shown below: As the user enters the test results of a patient, all the necessary attributes are captured. The algorithm then matches these attribute against the test datasets in the local database. Finding the exact match of the test results is nearly an impossible case in practical. Hence, initially Distance formula was applied in order to find the deviation of each attribute from the average / mean values of the database attributes records. Standard deviation can also be used for the same purpose as a substitute. However mean was considered because it is proved that the comparison with the mean value will result in huge miscalculations as the datasets show wide variation in result with respect to the mean value result. The assignment of weights using HMV ensemble method is done as below: Analysis performed are as follows: Major Age groups which the diabetic patients come under. Comparison of Diabetic patients between age group of below 35 years of Age and Above years of Age. BMI analysis to generate insights of both diabetic and non-diabetic patients. Analysis of both diabetic and non-diabetic patients based on Plasma Glucose Level. Insights of Diabetes Pedigree Function indicating presence of diabetes for both In-Range and Out-ofRange pedigree function values. Analysis of patient records based on Insulin levels. These analysis insights show that Diabetes pedigree functions is the most dominant factor in deciding whether or not the patient is diabetic. Hence the attribute corresponding to diabetes pedigree functions is assigned the highest weight according to HMV ensembles algorithm. Classification: Based on the weights allotted as a result of analysis, each of the deviation result variables are multiplied with their respective weights of the attributes (Dominant attributes have higher weights and less dominant attributes have lower weights). Since this is a heterogeneous method few attributes such as Thickness of skin and Blood pressure and Number of times the patient is pregnant are not allotted any weights. Once the weights are multiplied, the variables are then summarized and compared with the mean value of the results which have already been assigned with the weights. Finally the result 0/1 is obtained indicating whether or not the person is diabetic. The figures 2,3,4,5,6 and 7 are the insights generated through various attribute analysis done on the test datasets:
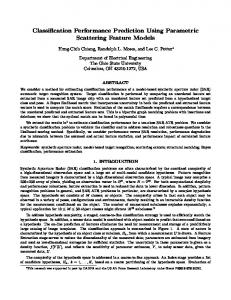
Fig 2: Insights showing the major age groups affected by diabetes according to the dataset.
Fig 3: Insights showing diabetic patients in age categories above and below 35 years.
Fig 4: Insights of Diabetic and Non Diabetic patients according to BMI values.
Fig 5: Insights displaying diabetic and non diabetic patients based on Plasma Glucose levels.
Fig 6: Insights displaying diabetic and non diabetic patient based on Insulin Levels.
Disease Classification and Prediction using Principal Component Analysis and Ensemble Classification Framework
Fig 7 : Insights displaying Diabetic patients count based on Diabetic Pedigree function.
Table 2 show the comparative analysis of HMV approach with other classifiers. The table shows that HMV approach has the highest accuracy compared to other classifiers in the prediction of Diabetes. Table 2 : Comparison table of classifiers Classifier
Accuracy (%)
Sensitivity(%)
Specificity(%)
NB
75.52
79.77
83.60
QDA
57.94
80.41
46.80
LR
75.78
79.07
85.40
kNN
68.23
75.40
76.00
SVM
76.95
78.99
88.00
DT
74.35
78.42
83.60
HMV
77.08
78.93
88.40
Fig 8 shows the accuracy comparison of HMV approach with other classifiers. Using HMV approach for classification and prediction of diabetes, the highest accuracy is achieved.
Fig 8 : Accuracy comparison of HMV with other classifiers IV CONCLUSION
Non-Communicable diseases are a global burden which is increasing the mortality rate of people in rural sectors. Early detection through automated system reduces healthcare cost as screening and prediction are done at patient’s door-step. The prediction accuracy of the automated model developed for the prediction of non-communicable
diseases using PCA and HMA approaches shows that the model proposed is efficient. The study also proves that classification and prediction of diseases using HMV approach achieves highest accuracy. This provides evidencebased technological approach and also serves as a model for the upcoming national programs for the policy makers in management of NCDs. REFERENCES [1]
V.Arun et al.,: Privacy of Health Information in Telemedicine on Private Cloud, International Journal of Family Medicine & Medical Science Research, Dec 2015. [2] V. Arun, V. Shyam, and S. Padma,: Data analytics and operational data integration to reach out to rural masses for early detection of noncommunicable diseases, International Journal of Primary Healthcare, Vol. 5, no. 210, November 2015. [3] Rubeena Banu, Vanishri Arun, Dr. Shankaraiah,Dr. Shyam V.:Meta-cognitive Neural Network Method for Classification of Diabetic Retinal Images, Second International Conference on Cognitive Computing and Information Processing, CCIP 2016. [4] Ian T. Jolliffe, Jorge Cadima: Principal component analysis: A review and recent developments, Philosophical Transactions of the Royal Society, A Mathematical, Physical and Engineering Sciences, 13 April 2016 Volume 374, issue 2065. [5] Saba Bashir, Usman Qamar , Farhan Hassan Khan and Lubna Naseem : HMV: A medical decision support framework using multi-layer classifiers for disease prediction, Journal of Computational Science 13, January 2016. [6] José Luis Polo Fernando Berzal Juan Carlos Cubero : Weighted Classification Using Decision Trees for Binary Classification Problems, II Congreso Español de Informática, Page 333-341. [7] https://en.wikipedia.org/wiki/Grubbs'_test_for_outliers [8] http://mlearn.ics.uci.edu/databases/pima-indians-diabetes/pima-indians-diabetes.names [9] Minta Thomas, Kris De Brabanter2, Johan AK Suykens1and Bart De Moo: Predicting breast cancer using an expression values weighted clinical classifier, BMC Bioinformatics (2014) 15:411 [10] M. Durairaj, G. Kalaiselvi: Prediction Of Diabetes Using Soft Computing Techniques- A Survey, International journal of scientific & technology research, Vol 4, Issue 03, March 2015 ISSN 2277-8616 [11] R. Chitra and Dr.V. Seenivasagam: Heart Disease Prediction System Using Supervised Learning Classifier, Bonfring International Journal of Software Engineering and Soft Computing, Vol. 3, No. 1, March 2013. [12] Tarun Jhaldiyal, Pawan Kumar Mishra : Analysis and Prediction of Diabetes Mellitus Using PCA, REP and SVM, International Journal of Engineering and Technical Research (IJETR) ISSN: 2321-0869, Volume-2, Issue-8, August 2014.