12 1
Disentangling mode-specific selection and measurement bias in social surveys
Bart Buelens, Jan van der Laan, Barry Schouten, Jan van den Brakel, Joep Burger and Thomas Klausch
The views expressed in this paper are those of the author(s) and do not necessarily reflect the policies of Statistics Netherlands
Discussion paper (201211)
Statistics Netherlands
The Hague/Heerlen, 2012
Explanation of symbols .
data not available
*
provisional figure
**
revised provisional figure (but not definite)
x
publication prohibited (confidential figure)
–
nil
–
(between two figures) inclusive
0 (0.0)
less than half of unit concerned
empty cell
not applicable
2011–2012
2011 to 2012 inclusive
2011/2012
average for 2011 up to and including 2012
2011/’12
crop year, financial year, school year etc. beginning in 2011 and ending in 2012
2009/’10– 2011/’12
crop year, financial year, etc. 2009/’10 to 2011/’12 inclusive Due to rounding, some totals may not correspond with the sum of the separate figures.
Publisher Statistics Netherlands Henri Faasdreef 312 2492 JP The Hague Prepress Statistics Netherlands Grafimedia Cover Teldesign, Rotterdam Information Telephone +31 88 570 70 70 Telefax +31 70 337 59 94 Via contact form: www.cbs.nl/information
60083201211 X-10
Where to order E-mail:
[email protected] Telefax +31 45 570 62 68 Internet www.cbs.nl ISSN: 1572-0314 © Statistics Netherlands, The Hague/Heerlen, 2012. Reproduction is permitted, provided Statistics Netherlands is quoted as source.
Disentangling mode-specific selection and measurement bias in social surveys Bart Buelens, Jan van der Laan, Barry Schouten, Jan van den Brakel, Joep Burger and Thomas Klausch
Summary: In 2011, Statistics Netherlands conducted a large-scale mixedmode experiment linked to the Crime Victimization Survey. The experiment consisted of two waves; one wave with random assignment to one of the modes web, paper, telephone and face-to-face, and one follow-up wave to the full sample with interviewer modes only. The objective of the experiment is to estimate total mode effects and the corresponding mode effect components arising from undercoverage, nonresponse and measurement. The estimated mode effects are used to improve methodology for mixed-mode surveys. In this paper, we define mode-specific selection and measurement bias, and we introduce and discuss estimators for these bias terms based on the experimental design. Furthermore, we investigate whether mode effect estimators based on the first wave only, reproduce the estimates from the full experimental design. The proposed estimators are applied to a number of key survey variables from the Labour Force Survey and the Crime Victimization Survey. Keywords: Survey modes; Measurement; Nonresponse; Coverage; Mixedmode
1. Introduction In mixed-mode survey data collection, different respondents in the sample complete the questionnaire using different data collection modes. Recently, the use of multiple data collection modes has received increasing attention, amongst others by national statistical institutes. The increasing pressure to reduce administration costs is probably the most important driving factor behind the rising importance of mixedmode designs. Mixed-mode designs can be separated into two types; concurrent designs where respondents can choose between different modes, and sequential designs where multiple contact attempts are implemented using different modes in a specified order. Sequential mixed-mode strategies are particularly cost effective since they can start with the self-administered modes that have low administration costs and use interviewer-administered modes to re-approach the remaining nonrespondents.
3
Data collection modes affect multiple sources of non-sampling errors in the data collection phase of a survey process. This results in systematic differences in survey outcomes, if the same survey is administered using different data collection modes. These so-called mode effects are the result of selection effects and measurement effects. Selection effects arise since different modes have different coverage and response rates, and are a form of nonresponse bias. Measurement effects arise since different modes evoke different types of measurement errors during the process of reporting an answer. This paper is the first in a series of discussion papers linked to the project Mode Effects in Social Surveys (in Dutch Mode Effecten in Persoonsstatistieken or MEPS). A detailed background and motivation to this project is given by Schouten (2010). The projected analyses and papers are described in Schouten and Klausch (2011). The project was initiated as a result of large mode effects in the Dutch Crime Victimization Survey (CVS), see Buelens and Van den Brakel (2011). The MEPS project has three main goals: 1. Estimate mode-specific selection and measurement bias for a number of key statistics from the Labour Force Survey (LFS) and the Crime Victimization Survey (CVS). 2. Understand better the relation between type of person, nature of survey question, and mode-dependent nonresponse and answering behaviour. 3. Recommend improvements to mixed-mode methodology (data collection strategies, nonresponse adjustment methods and questionnaire design) in the CVS and LFS. Prerequisites to the estimation of mode-specific selection and measurement bias are a conceptual framework for mode effects and an estimation strategy. In this paper, we deal with these two important issues. We focus on the methodology behind the definition and estimation of mode effect components. We apply methods to a number of CVS and LFS variables for illustrational purposes, but detail and discuss these estimates in other, separate papers. The experimental design that we propose is very costly and not feasible for standard survey settings. For this reason, we additionally investigate whether the experimental estimates for selection and measurement bias are close to estimates that would be available in an experiment were only the data of the first wave are available. The research questions in project MEPS that we answer are: 1. How to define mode-specific selection and measurement bias? 2. How to estimate these mode effect components? 3. What are the dominant mode effect components in LFS and CVS statistics? 4. How does mode-specific measurement bias relate to the type of survey item/question and to demographics and socio-economics of respondents?
4
5. Do naive mode effect estimators reproduce the estimates of the experimental design in LFS and CVS statistics? In this paper, we restrict ourselves mostly to questions 1, 2 and 5. Subsequent papers deal with the other two research questions. In Klausch et al. (2012), the analysis of mode-specific selection is extended to response propensities, which allows for statements about the impact of mode-specific selection on general population parameters of survey target variables, not just the population means. In survey literature, many references can be found to experiments indicating that different data collection modes have substantial effects on the answers generated by respondents, see e.g. De Leeuw (2005) and Dillman and Christian (2005) for an overview. These differences can be explained using cognitive models of the survey process (Channel et al. 1981 and Tourangeau et al. 2000), which provide a framework for understanding the process by which respondents interpret questions, retrieve the required information, make judgements about the adequate response and come up with an answer. These models are useful to explain how the characteristics of different data collection modes affect this process differently, resulting in different measurement bias. An important factor is the presence or absence of an interviewer. Respondents in interviewer administered surveys are more likely to offer socially desirable answers and demonstrate acquiescence, i.e. the tendency of respondents to agree with statements, (Dillman et al., 2009, De Leeuw 2005, Holbrook et al. 2003). The presence of an interviewer might, on the other hand, reduce the amount of satisficing, i.e. respondents do not expend the maximum amount of cognitive effort required to answer a question to the best of their capabilities. The interview speed is another important factor that determines the amount of measurement error induced by satisficing. In telephone interviews but also in web interviewers the interview speed is generally higher compared to face-to-face interviews and might give rise to more measurement bias. Another decisive factor is the difference between aural and visual oriented modes. Krysan et al. (1994) and Christian et al. (2008) showed that respondents tend to answer more positively to opinion questions in aural oriented modes. Other well known factors that explain differences between aurally and visually based data collection modes are recency and primacy effects. Recency effects refer to the phenomenon that respondents tend to choose the last items in a list of answer categories if they are read by an interviewer. Primacy effects refer to the phenomenon that respondents tend to choose items listed first in a list of answer categories in visually based modes. The explanation is that in interviewer based modes, there is not enough time to place each answer category into the respondent’s long-term memory before the next one is read, Krosnick and Alwin (1987). There is a strong interaction between mode and questionnaire design as discussed by Dillman and Christian (2005) and De Leeuw (2005). In self-administered surveys, the visual layout of the questionnaire is of importance since it strongly determines the way that questions are interpreted by the respondent. Tourangeau et al. (2004, 5
2007) distinguished five visual interpretive heuristics that respondents follow when completing a self-administered questionnaire. The extent to which these heuristics are obeyed or violated determines the amount of measurement bias in the observed data. A massive amount of literature on empirical research on mode effects appeared in the literature, see De Leeuw (2005), Dex and Gumy (2011) and Klausch et al. (2012) for overviews. Selection and measurement effects are typically strongly confounded when survey outcomes obtained under different modes are compared. Separation of selection effects from measurement effects in empirical studies requires carefully designed experiments in combination with weighting or regression based inference methods to control for selection effects, see e.g. Jäckle et al. (2010). As an alternative, Vannieuwenhuyze et al. (2010) proposed a method to disentangle measurement and selection effects on the proportions and the mean of multinomial variables. Our approach and experimental design resemble that of Biemer (2001), with three differences. Biemer (2001) compared two modes, CATI and CAPI, used CATI as the survey mode for wave 2, and reapproached CAPI nonrespondents only. However, the estimation strategy is very different from Biemer (2001), which was designed as a test-retest study and assumed a latent class model aiming at absolute mode effects rather than relative mode effects. In section 2, we introduce the concepts and definitions behind mode effects. In section 3, we explain how we estimate the mode effect components. In section 4, we evaluate the main experimental assumptions. We provide estimates for a number of key LFS and CVS statistics in section 5. In section 6, we compare the mode effect estimates to estimates in standard survey settings. Finally, in section 7, we summarize and discuss the results.
2. Mode-specific coverage, nonresponse and measurement bias First, we consider the definition of mode effects and their components: coverage effects, nonresponse effects and measurement effects. A mode-specific coverage effect is the result of differences in coverage of the mode of the population. Both web and telephone suffer from undercoverage of the population, whereas face-toface and paper are assumed to have full coverage. We, thus, ignore errors in sampling frames and consider the sampling frame as the benchmark population. Mode-specific nonresponse effects result from differences in mode preferences in response behaviour. Web surveys usually have lower response rates, but may also attract different respondents. Mode-specific measurement effects are differences in answers between modes for the same respondents. We, thus, circumvent the discussion about true values of measurement constructs, and merely look at differences as a consequence of the choice of mode. Clearly, the `mode` as a survey instrument to recruit respondents and administer answers from respondents, has many different forms, varying from one office to the other. We return to this issue in 6
the discussion. In this paper, we focus on first moments, i.e. population means, of survey variables. Other distribution parameters, like higher-order moments or covariances between a survey variable and auxiliary variables, could be treated in a similar way, but the estimation strategy will generally need to be more advanced. Let y p ,m1 ,m2 be the mean of population p for survey variable y given selection based on mode m1 and measurement through mode m 2 , where p ∈ {tot , tel , web} , where abbreviations stand for total, telephone and web population, m1 , m 2 ∈ {web, pap, tel , f 2 f } , short for web, paper, telephone and face-to-face.
For example, y tel , f 2 f ,tel is the population mean for persons with a registered phone number given they participated following a request by a face-to-face interviewer and given that their answer was administered by phone. As a mnemonic may serve that measurement follows response and response follows coverage. The benchmark mean throughout this paper is ytot , f 2 f , f 2 f ,
(1)
so that mode effects are evaluated with respect to the face-to-face response mean, i.e. face-to-face was used both as selection mechanism and as measurement technique. We will refer to relative mode effects and absolute mode effects in the following when we consider them with respect to, respectively, the face-to-face response mean and the population mean. We have two motives to choose a benchmark. First, although it would be very useful to know absolute difference for each mode towards a true population parameter, this will, in general, be very hard or even impossible to achieve. We can think of experimental designs that allow for estimation of relative mode effects, but not of designs that allow for estimation of absolute mode effects. Absolute mode effects can only be estimated and decomposed when a 100% response can be achieved in a follow-up survey. However, such a design, if at all existent, is likely to affect measurement in the follow-up questionnaire. Settling for differences between modes is sufficient in order to judge and evaluate the impact of mode effects on statistics. As a second motive, most redesigns of surveys go from a unimode telephone or face-to-face design to a mixed-mode design. Hence, we especially need mode effect estimates relative to these unimode designs. As a consequence, we are interested only in relative measurement effects for respondents in regular interviewer surveys. The choice for face-to-face as a benchmark mode is motivated by the expectation that, in general, absolute mode effects are smallest for face-to-face. Literature confirms that with respect to selection effects this is often true, as face-to-face does not suffer from undercoverage and response probabilities are highest. Face-to-face is also the most expensive mode. Face-to-face may, however, not be the best mode for
7
measurement of all types of survey variables. For measurement, we do not consider one mode to be superior to the other modes for all possible survey variables. The total relative mode effects for telephone, web and paper are defined as M tel ( y ) = ytel ,tel ,tel − ytot , f 2 f , f 2 f
(2)
M web ( y ) = yweb, web, web − ytot , f 2 f , f 2 f
(3)
M pap ( y ) = ytot , pap, pap − ytot , f 2 f , f 2 f
(4)
In the following, we elaborate on the decomposition of the total relative mode effect for telephone relative to face-to-face. Mode effect decompositions for web and paper can be made analogously. The relative mode effect components are termed modespecific coverage bias, mode-specific nonresponse bias and mode-specific measurement bias. We will omit the adjectives “relative” and “mode-specific”, unless unclear from the text. The nonresponse bias and coverage bias together form the selection bias. The decomposition of the total mode effect, i.e. the steps to go from the observed telephone mean y tel ,tel ,tel to the benchmark mean ytot , f 2 f . f 2 f , can be made in six ways, resulting in alternative definitions of coverage, nonresponse and measurement bias. We consider two decompositions in this paper. The first decomposition is M tel ( y ) = ( y tel ,tel ,tel − y tel , f 2 f ,tel ) + ( y tel , f 2 f ,tel − y tel , f 2 f , f 2 f ) + ( y tel , f 2 f , f 2 f − y tot , f 2 f , f 2 f )
,
= NRtel ( y ) + MEtel ( y ) + COtel ( y )
(5) where NR tel ( y ) , ME tel ( y ) and COtel ( y ) are the nonresponse, measurement and coverage bias, respectively, for telephone relative to the face-to-face. The second decomposition we consider is M tel ( y ) = ( y tel ,tel ,tel − y tel , f 2 f ,tel ) + ( y tel , f 2 f ,tel − y tot , f 2 f ,tel ) + ( y tot , f 2 f ,tel − y tot , f 2 f , f 2 f )
.
= NRtel ( y ) + COtel ( y ) + MEtel ( y )
(6) Hence, the difference between the two decompositions (5) and (6) lies in the definition of the coverage and measurement bias terms. In (5), the measurement bias is defined for the population restricted to persons with a registered phone number. In (6), the measurement bias is defined for the full population, i.e. including those persons that do not have a registered phone number. Consequently, the coverage bias is different as well and is defined in terms of face-to-face answers, in (5), and telephone answers, in (6). M web ( y ) and M pap ( y ) can be decomposed analogously. For the paper survey mode there is no undercoverage, so it always holds that CO pap ( y ) = 0 . In the following, for convenience, we label decomposition (5) as 8
MEMOD (measurement bias for respondents with access to mode) and (6) as MEFULL (measurement bias for all respondents). As we mentioned, there are four alternative decompositions to the two we have considered so far. All of these decompositions contain population parameters for which we cannot construct straightforward estimation strategies. For this reason, we restricted attention to decompositions MEMOD and MEFULL. The bias terms and mode effects considered here, concern differences between unimode surveys. As such they cannot be used directly to draw conclusions about multimode surveys. Especially, sequential mixed-mode designs may lead to a complicated interplay of the various mode-specific bias terms. Respondents to a face-to-face survey, that did not respond to a previous wave in web, may form a subgroup in the population of face-to-face respondents. Vannieuwenhuize et al. (2010) discuss a number of assumptions that are needed in order to draw conclusions from mixed-mode designs. We restrict ourselves to unimode designs, but our findings may provide strong support to evaluations of such assumptions. In section 3, we propose estimators for the various bias terms. There, we discuss the two decompositions, since, apart from conceptual differences, the statistical properties of the estimators also serve as input to a preferred decomposition.
3. The estimation strategy for mode-specific bias We start by describing the experimental design, various estimators and the main assumptions. Next, we discuss various choices in the definition and estimation of mode effects. Finally, we give an overview of variables in the MEPS questionnaires. 3.1 Experimental design As explained in section 2, we treat face-to-face as the benchmark mode in relative mode effects. This choice forms the starting point of the experimental design. The experiment consists of two waves. In the first wave, 8800 sample units are randomly assigned to one of the four survey modes, CAPI (Computer Assisted Personal Interviewing), CATI (Computer Assisted Telephone Interviewing), web or paper. The data collection strategies for the four modes equal the standard strategies at Statistics Netherlands, e.g. length of data collection period and number of visits/calls/reminders. The full sample, excluding administrative errors and some exceptional nonresponse types like language problems, is approached once more in the second wave. Approximately 80% of the sample persons are administered by face-to-face in the second wave. The remaining 20% of the sample persons is interviewed through CATI. When a sample person has a registered telephone number, then the allocation to CATI or CAPI was random with probabilities 70% to
9
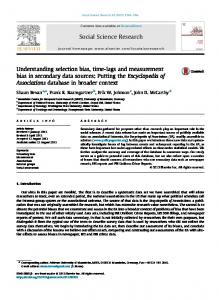
CAPI and 30% to CATI. When a sample person does not have a registered number, then he/she is always allocated to CAPI. The 70%-30% CAPI-CATI distribution is chosen such that anticipated mode effects between CATI and CAPI are much smaller than the sampling errors. Figure 3.1 presents the design of the experiment. The first wave of the experiment is the Crime Victimization Survey (CVS) with two modifications. Part of the modules at the end of the survey questionnaire is replaced by the Labour Force Survey (LFS) module for employment status and by two sets of four questions from the European Social Survey (ESS). The second wave of the experiment employs a new questionnaire, consisting of: •
A repetition of the key statistics from the CVS
•
General attitudes towards safety and politics
•
General attitudes towards surveys
•
Evaluation of survey participation in wave 1 and survey design features like the advance letter and the interviewer
•
Evaluation of the CVS questionnaire (wave 1 respondents only)
•
Access to web and mode preferences
As the wave 2 questionnaire is different from the wave 1 questionnaire, the experiment is not a test-retest study. The answers to the CVS key statistics are not used to perform a reinterview analysis, but to construct the ideal nonresponse adjustment variables in the weighting model of a calibration estimator. The wave 2 answers to the CVS key statistics may of course show some structural change due to the time lag between the two waves. Figure 3.1: Design of the experiment Sample=8800
Wave 1
CAPI
CATI
web
Response Wave 2
paper
Nonresponse
CAPI - CATI
The additional questionnaire blocks after the repeated CVS blocks in wave 2 are important; they allow for analysis of general attitudes towards the survey topics and towards surveys in general, and for an analysis of the various design features that are intrinsic to survey modes like the interviewer or the advance letter. The additional questions in wave 2 about access to web are necessary to identify wave 1 10
nonrespondents to web who were not able to respond because of undercoverage. The questions about mode preference are used to analyse whether the preferred mode induces smaller mode effects. However, we have to acknowledge that these questions are themselves subject to measurement error, e.g. to social desirable answering. The time lag between contacts in the two waves (if contact is established) varies between 4 and 8 weeks, depending on survey mode of wave 1 and the time of contact in both waves. The CVS questionnaire was selected as a vehicle to conduct wave 1 as the questionnaire has almost all mode-dependent features: It is relatively long with various batteries of similar items, it contains questions sensitive to social desirable answers, it contains questions that require memory and cognitive effort to recall details, and “no opinion” answers play an important role. 3.2 Estimators for mode effect components We use two estimators to disentangle coverage, nonresponse and measurement based on the experimental design of section 3.1: the response mean and the general regression estimator (GREG). Let yˆ Rp ,m be the response mean for mode m for respondents in population p of a variable y . Again, we choose p ∈ {tot , tel , web} , where abbreviations stand for total, telephone and web population, m ∈ {web, pap, tel , f 2 f } , short for modes web, paper, phone and face-to-face.
For the general regression (GREG) estimator, we distinguish two target populations: the respondents of wave 2 and the full sample: yˆ pp2,,mwave 2 = GREG estimator of wave 1 respondents in population p1 to wave 2 1
respondents in population p 2 ,
(7)
yˆ pp2,,msample = GREG estimator of wave 1 respondents in population p1 to sample in 1
population p 2 .
(8)
tel , wave 2 For example, yˆ tel is the GREG estimator for wave 1 respondents in the ,tel
telephone subsample to all respondents in wave 2 that have a telephone. The estimation strategy is as follows: Response means are used to estimate the population means y p ,m,m , i.e. the means where mode of recruitment and mode of measurement are the same. The GREG estimator to wave 2 is used to estimate the counterfactual population means y p ,m1 ,m2 where recruitment mode and interview mode are different. In section 6, we employ the GREG estimator to the sample. In the GREG estimator to wave 2, we always ignore respondents in wave 1 that did not respond in wave 2. This is a consequence of the GREG estimator, since auxiliary
11
variables are required for the sample units. We omit this group as we view wave 2 as a regular CAPI survey. The wave 1 respondents that do not respond to this survey are considered not to be part of the response to a regular CAPI survey. For example, part of the web response may consist of persons that would not participate in a CAPI survey. We elaborate the resulting estimators for CATI. Similar estimators can be constructed for web and paper survey modes. The two CATI mode effect components of decompositions MEMOD and MEFULL are estimated as follows R yˆ tel ,tel ,tel = yˆ tel ,tel
(9)
R yˆ tot , f 2 f , f 2 f = yˆ tot ,f 2f
(10)
R yˆ tel , f 2 f , f 2 f = yˆ tel ,f 2f
(11)
tel , wave 2 yˆ tel , f 2 f ,tel = yˆ tel ,tel
(12)
tot , wave 2 yˆ tot , f 2 f ,tel = yˆ tel . ,tel
(13)
So far, we have ignored the construction of the weighting models used by the GREG estimators. In order to build models we have to distinguish four types of variables: •
y : a target variable that is measured in both waves, i.e. the CVS core
variables •
~ y : a target variable that is measured in wave 1 only, i.e. other CVS
variables, LFS core variables and the ESS variables •
z : the vector of auxiliary variables that is measured in wave 2. The variables include survey attitudes and attitudes towards surveys about safety in the Netherlands
•
x : the vector of auxiliary variables linked from registries and administrative data
In the estimation, we have to treat variables that are repeated in wave 2, y , differently from those that are not, ~ y . For the first group, we can use all wave 2 variables, including the wave 2 analogues, as nonresponse weighting variables. For the second group, we have to resort to wave 2 variables that are most predictive of nonresponse to wave 1 and the survey variable itself. The models will for both types of variables consist of a vector composed of variables from x, z and y . The choice of the model is based on a stepwise procedure, in which potential covariates are added to the model so as to maximize the gain in AIC. Clearly, for variables that are measured in both waves, it is to be expected that the repeated question is one of the first variables selected. However, since structural changes may occur due to the time lag and, since some of the repeated variables had small modifications in wave 2, we treat all available variables as potential covariates in all cases. Response to the second wave is used only indirectly, in calibrating wave 1 response. This avoids
12
dealing explicitly with differences in outcomes between the waves that are due to the time lag between the waves, and the fact that some response in the second wave is collected using CATI. The estimators (9), (10) and (11) are all response means and do not make use of the wave 2 response. As an alternative, the CAPI respondents and the CAPI respondents with a telephone may be weighted to wave 2. We assume that wave 2 is a regular CAPI survey, and, hence, weighting towards wave 2 may improve efficiency, i.e. lead to smaller standard errors. The sample for the GREG estimator is, on the other hand, based on less sampling units since the respondents in wave 1 that did not respond in wave 2 are ignored. We, therefore, consider also the estimation strategy where (10) and (11) are replaced by corresponding GREG estimators tot , wave 2 yˆ tot , f 2 f , f 2 f = yˆ tot ,f2f
(14)
tel , wave 2 yˆ tel , f 2 f , f 2 f = yˆ tel ,f2f
(15)
Summarizing, we have proposed two decompositions (MEMOD and MEFULL) and two estimation strategies (R and GREG). We label these as follows: o
MEMOD-R: Coverage bias measured in terms of CAPI answers and no weighting towards wave 2 of wave 1 CAPI response.
o
MEMOD-GREG: Coverage bias measured in terms of CAPI answers and weighting towards wave 2 of wave 1 CAPI response.
o
MEFULL-R: Coverage bias measured in terms of mode answers and no weighting towards wave 2 of wave 1 CAPI response.
o
MEFULL-GREG: Coverage bias measured in terms of mode answers and weighting towards wave 2 of wave 1 CAPI response.
Analytic approximations to the standard errors for the various estimators (9) to (15), presented in this section, are straightforward. However, the approximation of standard errors for the coverage, nonresponse and measurement biases is less straightforward due to covariances between the estimators. For this reason, and since we do not expect a frequent replication of the experimental design, we resort to resampling methods for the approximation of standard errors. It is important to note that MEMOD-R and MEFULL-R do use GREG calibration towards the wave 2 response means in order to estimate the mean answer in a mode given selection was through CAPI. However, the total mode effect is expressed in terms of the difference between the unweighted response means. 3.3 Assumptions underlying the estimation strategy The proposed estimation strategies will provide unbiased estimators for the relative undercoverage, nonresponse and measurement biases with respect to CAPI, when four assumptions are met:
13
1. The response to wave 2 is similar to the response to a regular CAPI survey. This assumption can be broken down into two subassumptions. a. The CAPI response to wave 1 resembles a regular CAPI survey. b. The CAPI respondents that drop out between wave 1 and wave 2 are similar to the wave 1 CAPI nonrespondents that enter the response to wave 2. 2. The answering behaviour to wave 2 is CAPI, i.e. the answers to wave 2 are not affected by the mode in wave 1. 3. The nonresponse to wave 1 relative to wave 2, is missing at random for the CVS and LFS key survey variables, given the wave 2 variables and register variables. 4. The mode effects in wave 2 between CATI and CAPI have a negligible impact on the calibration estimators. Historical survey data provides strong evidence that assumption 1 is valid. This assumption corresponds to the well-known continuum of resistance assumption. Assumption 2 is enforced by demanding at least a 4 week time lag between the two waves. These two assumptions are evaluated in section 4. The third assumption cannot be tested, but we will evaluate the strength of the regression models underlying to the calibration in section 4. For variables that are observed in both waves it is a fair assumption. For target variables that are only observed in the wave 1, it must be assumed that wave 2 variables correlate either to the variables or to the selection in wave 1. If assumption 3 does not fully hold, then, depending on the decomposition, some selection bias will end up in the measurement bias or in the coverage bias. The fourth assumption could be evaluated by restricting the wave 2 calibration mean to CAPI respondents. We did not evaluate this assumption. 3.4 The choice of decomposition and estimators The various possible decompositions of the total mode effect are conceptually different and should, thus, in general lead to different estimates for the mode effect component. However, the various mode effect components should have the same order of magnitude. If not, then the definition plays a dominant role. We have restricted ourselves to two decompositions, because they allow for relatively straightforward estimation given the experimental design. Any other decomposition, in our view, would lead to assumptions that cannot be met using the design. In section 3.2, we introduced four sets of estimators for mode effect components. Here, we briefly describe the conceptual and statistical differences. The decompositions that define measurement bias for all respondents offer the advantage of comparability over modes; access to web, paper and telephone represent different populations and, hence, conceptually different measurement bias for the other decompositions. However, the decompositions that extrapolate measurement bias to the full population require stronger Missing-at-Random assumptions as the GREG estimators need also to adjust for the selectivity due to undercoverage. Furthermore, one can debate the existence of measurement bias for persons without access to a mode. Using GREG estimators instead of response means for wave 1 CAPI may 14
lead to gains in precision. However, since the GREG estimators use only those wave 1 respondents that also respond to wave 2, this gain may be lost by the reduction of the number of respondents. Table 3.4.1 summarizes the strengths of each strategy. We restrict ourselves to the group of estimators under MEMOD-R throughout most of the paper, as we feel this is overall the best strategy. In section 5, we evaluate differences in estimates between the strategies. Generally, the differences are small. Table 3.4.1: Differences between decompositions and estimation strategies. Strategy Strengths MEMOD-R Conceptual: No statements about counterfactual measurement bias of persons without access to mode Statistical: Requires weaker MAR assumption MEMOD-GREG Conceptual: No statements about counterfactual measurement bias of persons without access to mode Statistical: Requires weaker MAR, potential gain in precision MEFULL-R Conceptual: Measurement bias is comparable over modes MEFULL-GREG Conceptual: Measurement bias is comparable over modes Statistical: Potential gain in precision Table 3.5.1: Selection of survey variables from CVS and LFS Variable name empstat offtot victim nuisance unsafe
Variable contents Employment status (employed, unemployed, non-labour force) Total number of offences1 Percentage of population victim of crime2 Scale score related to nuisance Percentage of people feeling unsafe at times
3.5 Questionnaire variables In this section, we present an overview of wave 1 and wave 2 variables. The wave 1 variables are the target variables in the analyses, the wave 2 variables function as covariates in the GREG estimators. Table 3.5.1 contains a selection of the most important survey variables from the LFS (Labour Force Survey) and CVS (Crime Victimization Survey). They include facts, attitudes and opinions. These variables are all observed in the first wave of the experiment. Some of the wave 1 survey variables are repeated in wave 2, but not all. In particular, the LFS variables are not repeated in wave 2. The CVS survey variables that are repeated in wave 2 were slightly adapted in order to restrict the length of the questionnaire. In the following we will label these variables as indicated in table 3.5.1 but with a prefix “w2”. Some standard auxiliary variables are available from administrative registers, see Table
1
Per 100 inhabitants, in the last 12 months.
2
In the last 12 months.
15
3.5.2. These variables include the standard weighting variables for the CVS and LFS. Table 3.5.3 gives an overview of wave 2 variables that were added to the questionnaire in order to evaluate general attitudes towards safety en towards surveys in general. Table 3.5.2: Background variables available from administrative registers Variable name
Variable contents
age gender ethnic urban hhsize hhtype hhpos income inctype regempl
Age in categories (age3, age6 and age7 are commonly used) Male/female Ethnicity (Dutch, foreign (western), foreign (non-western) Degree of urbanization Household size Household type Position in household Income category Type of income (e.g. employment, social welfare,…) Registered unemployed
Table 3.5.3:. Additional wave 2 variables Variable Variable contents name betr1 betr2 betr3 betr4 vmatt2 vmatt3 vmatt5 intpol satt1 satt2 satt3 satt4 satt5 satt6 satt7 satt8 satt9 satt10 satt11 satt13 satt14 vmatt6 vmatt7
Opinion on Participation in surveys on safety is important Opinion on Safety should be on the top of the political agenda Opinion on Safety in The Netherlands is worrisome Opinion on The government should do more to improve safety Opinion on It is interesting to think about safety Opinion on Politics take opinions on safety seriously Opinion on Surveys about safety concern issues that I would like to keep to myself Extent to which a person is interested in politics Opinion on It is fun to participate in surveys on paper or the web Opinion on It is fun to be interviewed in a survey Opinion on In general surveys are interesting Opinion on Surveys are important for society Opinion on The government can learn a lot from surveys Opinion on Surveys are a waste of time Opinion on There are to many requests for surveys Opinion on Surveys are an invasion of privacy Opinion on It is tiring to fill in survey questionnaires Opinion on People in my environment generally participate in surveys Opinion on When asked for a survey, it is one’s duty to participate Opinion on My time is too precious to use on surveys Opinion on There is too little time to participate in surveys Opinion on CBS protects the confidentiality of survey data Opinion on CBS statistics are reliable
16
4. Validation of main experimental assumptions In this section, we investigate the basic experimental assumptions: 1) lack of impact of wave 1 on response to wave 2, 2) lack of impact of wave 1 on measurement in wave 2, and 3) missing at random assumptions in GREG estimators from wave 1 to wave 2. 4.1 Impact of wave 1 on wave 2 response The sample of 8,800 persons was randomly divided into four equal groups. Each group was surveyed through a different mode as explained in section 3.1. The response within the CAPI, CATI, paper and web groups for the two waves is listed in table 4.1.1. The fact that the effective sample sizes of the CAPI and web groups are smaller than 2,200 is due to the omission of population frame errors (unknown/wrong addresses). As expected, in wave 1, the CAPI response is the highest, 61%, and the web response the lowest, 29%. The relatively low response for CATI, 45%, is to some extent caused by undercoverage. Around 25% of the sample units do not have a registered phone number. Around 90% of Dutch households have access to the web at home. Hence, for web the response rate given access would be around 32%. In wave 2, response percentages are comparable between the four groups; they are all around 50%. This is an important finding as it induces that response rates were not affected by the mode of wave 1. This is verified formally by modelling the binary response variable of wave 2 using a logistic regression model, with the mode in wave 1 as independent variable. The mode used in wave 1 is found to be not significant (p = 0.24). We have also analysed the distributions of response to a number of background variables (results not shown) and found that none of the variables significantly interacted with the mode of wave 1. These findings led us to conclude that the wave 1 mode did strongly not impact wave 2 response behaviour.
Table 4.1.1: Sample sizes and response rates to wave 1, wave 2 and both waves. CAPI CATI Paper Web Total Sample 2182 2200 2200 2199 8781 Wave 1 response 1338 993 1076 631 4038 61% 45% 49% 29% 46% Wave 2 response 1077 1036 1099 1084 4296 49% 47% 50% 49% 49% Response to both waves 933 700 726 444 2803 43% 32% 33% 20% 32% Table 4.1.1 provides also the proportion of sample persons that responded to both waves. These respondents form an important subset, as they are used in decomposing the mode effect into different components; it is this group that is used to calibrate wave 1 to wave 2. The CATI and PAPI groups consist of approximately 700 respondents, while there are only 440 respondents in the CAWI group. From these response rates, we can conjecture that standard errors for the GREG estimators 17
may be similar to those of the simple response means. Or in other words, that the confidence intervals are not made smaller by weighting to wave 2. Shortly after the end of the wave 2 data collection a number of evaluations were held with face-to-face and telephone interviewers. The purpose was to detect irregularities in the process of obtaining response and conducting the interview during wave 2. Details can be found in Schouten et al. (2011). The evaluation evoked a lot of comments on the CVS questionnaire itself, but interviewers generally concluded that they did not encounter negative or different doorstep interactions. 4.2 Impact of wave 1 on wave 2 measurement The second basic assumption is that the answers given in wave 2 are independent of the mode used in wave 1. In order to assess this, we analyzed sample means of wave 2 answers given the mode of wave 1, see table 4.2.1. The last column in the table shows the significance of the mode used in the first wave, in predicting the answer in the second wave. It should be noted that the differences between the response mean, are the net result of selection differences into wave 2 and measurement differences in wave 2. While there are differences between the groups that seem rather large at first, the mode used in the first wave is never a significant predictor (all p-values are larger than 0.05). From these results, we conclude that the mode in wave 1 did not strongly impact the measurement in wave 2. The interviewer evaluations (Schouten et al. 2011) also devoted attention to wave 2 answering behaviour. Again, interviewers noted that the wave 2 interview for the repeated CVS questionnaire blocks appeared normal to them. Interviewers, however, remarked that some of the wave 1 evaluation questions at the end of the wave 2 questionnaire aroused acquiescence. In this paper, we do not use these questions.
Table 4.2.1: Effect of wave 1 mode on wave 2 sample means. Standard errors are given in brackets. The p-value is linked to the overall simultaneous F-test. Variable w2_offtot w2_victim w2_nuisance w2_unsafe
CAPI 27.4 (2.6) 10.4 (0.9) 1.31 (0.06) 22.0 (1.3)
CATI 22.0 (2.9) 8.7 (0.8) 1.24 (0.06) 24.0 (1.3)
PAPI 22.3 (2.2) 10.0 (0.9) 1.25 (0.06) 25.4 (1.3)
CAWI 30.4 (2.9) 10.7 (0.9) 1.34 (0.06) 25.4 (1.3)
p-value 0.087 0.429 0.553 0.213
4.3 Missing-at-Random assumptions in calibration to wave 2 In the disentanglement of the total mode effect into coverage, nonresponse and measurement effects, GREG estimators play an important role. The estimates for the mode effect components are unbiased, when the covariates in the regression models are strong predictors for the target variables and/or the response to wave 1. More 18
formally, the response to wave 1 should be missing at random for these target variables given the repeated CVS variables, the general attitudes about safety, the attitudes towards surveys in general and the available register variables. We cannot formally test this assumption. We can, however, evaluate the explanatory power of the models for the target variables. Tables 4.3.1 contains the adjusted R 2 for the regressions of the CVS and LFS target variables as they are used in section 5 to decompose mode effects. Table 4.3.1 contains also the correlation between the target variable Y and the predictor Z = βX in the calibration models from wave 1 to wave 2, the correlation between the 0-1 response indicator R and the predictor Z = βX , and the selection criterion W , as proposed by Schouten (2007). The latter equals the maximal width of the bias interval when a not missing at random assumption is made; values close to 1 indicate a weak model, while values close to 0 correspond to strong models. The measures provide insight into the potential remaining impact of nonresponse on the bias of the calibrated wave 1 response means. In general, the correlations between the predictors and the target variables are high and the correlations between the predictors and the response indicator are modest to small. Table 4.3.1: Adjusted R 2 , correlations between predictor Z = βX and Y and R, and maximal NMAR interval for the regressions of the CVS target variables. C(Z,Y) C(Z,R) W Variable name R2 offtot victim nuisance unsafe empstat - unemployed empstat - employed
0.223 0.174 0.474 0.276 0.144 0.559
0.47 0.42 0.69 0.53 0.39 0.75
-0.08 -0.05 -0.04 -0.05 -0.06 0.13
0.88 0.91 0.72 0.85 0.92 0.66
The adjusted R 2 values indicate that the models for CVS variables have medium to high explanatory power; this was to be expected as the models contain repeated variables. We can also conclude that the model for LFS variable employment status is still strong, despite the fact that this variable was not repeated in wave 2. The correlations between the predictors and the target variables are high but the correlations between the predictors and the response indicator are modest to small. As a consequence of the low correlation to the response indicator, also the selection criterion W is relatively big; implying that there is still room for Not-Missing-atRandom nonresponse to have an impact. For the LFS variables, it can, however, be expected that missing data in the CVS survey is at worst indirectly related to employment. Based on the various diagnostics, we conclude that there is no indication that the Missing-at-Random assumption is at risk. However, due to the low correlation to nonresponse, it cannot be ruled out that Not-Missing-at-Random nonresponse plays some role.
19
5. Application to CVS and LFS The total mode effect is decomposed into coverage, nonresponse and measurement bias following the MEMOD-R set of estimators. In section 5.1, results are presented for the selected LFS and CVS variables. In section 5.2, we evaluate the four different sets of estimators as defined in section 3.4. 5.1 Estimates of mode-specific selection and measurement bias In order to produce estimates for the various mode-specific bias terms, weighting models are needed for each of the selected variables for which the decomposition is to be performed. Table 5.1.1 shows the optimal models. Variables are selected following a forward-selection in the regression of a target variable on all covariates. In the selection, the relation of covariates to response is, thus, ignored. Interaction terms have not been considered. Variables in the models are listed in the order in which they were selected. The first variables provide the strongest explanation. As expected, for the CVS variables, the corresponding wave 2 variables are the most important ones. The weighting model for employment status, however, consists completely of register variables. It must be noted here that the employment status was not asked in the paper mode; paper is not considered to be a candidate mode for the LFS due to the complexity of the questionnaire. In the models for the CVS variables, some register variables appear; age, type of income and urbanization degree are selected. The register variables never are the strongest variables, but in some cases do provide strong additional explanation. The special wave 2 attitudinal question “Opinion on Safety in The Netherlands is worrisome” is also selected, but provides only little extra explanation. We have performed decompositions for a much wider range of CVS and LFS variables, and the observed patterns in table 5.1.1 hold for the full set. Table 5.1.1: Optimal regression models. Variable name
Model
empstat offtot
inctype + regempl + income + hhpos w2_offtot + w2_nuisance + age6 + w2_contpol + w2_offbike + w2_victviol w2_victim + w2_nuisance + w2_contpol + inctype + w2_offtot + w2_offviol w2_nuisance + w2_unsafe + urban + w2_victviol w2_unsafe + w2_nuisance + age3 + betr3
victim nuisance unsafe
Using the models of table 5.1.1, mode effects are quantified and decomposed, see Table 5.1.2. For the LFS variable employment status, the total mode effect is a mix of coverage, nonresponse and measurement effects. Importantly, the weighting model for this variable contains only standard registry variables, i.e. none of the CVS repeated variables and none of the attitudes towards politics, safety and surveys turned out to play a role in mode in mode-specific response or anwering
20
behaviour. For the CVS variables, all total effects that are significant are due to measurement error. When not significant, the measurement bias remains the largest of the three components. The coverage effect generally contributes the least to the total. In some instances the bias terms have different signs, indicating that the effects counteract against each other. For example in the web group, offtot is found to be lower due to nonresponse bias, and at the same time higher due to measurement and coverage bias. The total effect is – in absolute value – smaller than the measurement bias. The web group outcomes are more negative with respect to the target variables. This group shows more offences, more victimization, feeling less safe, and scoring higher for nuisance. These differences seem to be mainly caused by measurement bias. The opposite applies to the CATI group, showing a more positive picture. As discussed before, these comparisons are always made with respect to the reference level determined from the CAPI group. Table 5.1.2: Decomposition of the mode effect for the selected target variables, with significance levels indicated by * (p