Original Research Article
published: 08 October 2010 doi: 10.3389/fnsys.2010.00147
SYSTEMS NEUROSCIENCE
Disrupted modularity and local connectivity of brain functional networks in childhood-onset schizophrenia Aaron F. Alexander-Bloch1,2,3, Nitin Gogtay 2, David Meunier 1, Rasmus Birn 4, Liv Clasen 2, Francois Lalonde 2, Rhoshel Lenroot 5, Jay Giedd 2 and Edward T. Bullmore1,6* Department of Psychiatry, Behavioural and Clinical Neuroscience Institute, University of Cambridge, Cambridge, UK Child Psychiatry Branch, National Institute of Mental Health, Bethesda, MD, USA 3 David Geffen School of Medicine at University of California, Los Angeles, CA, USA 4 Department of Psychiatry, University of Wisconsin School of Medicine and Public Health, Madison, WI, USA 5 Prince of Wales Medical Research Institute, University of New South Wales, Sydney, NSW, Australia 6 GlaxoSmithKline Clinical Unit Cambridge, Addenbrooke’s Hospital, Cambridge, UK 1 2
Edited by: Silvina G. Horovitz, National Institutes of Health, USA Reviewed by: Barry Horwitz, National Institutes of Health, USA Malle A. Tagamats, University of Maryland, USA *Correspondence: Edward T. Bullmore, Department of Psychiatry, University of Cambridge, Herchel Smith Building, Cambridge Biomedical Campus, Cambridge CB2 0SZ, UK. e-mail:
[email protected]
Modularity is a fundamental concept in systems neuroscience, referring to the formation of local cliques or modules of densely intra-connected nodes that are sparsely inter-connected with nodes in other modules. Topological modularity of brain functional networks can quantify theoretically anticipated abnormality of brain network community structure – so-called dysmodularity – in developmental disorders such as childhood-onset schizophrenia (COS). We used graph theory to investigate topology of networks derived from resting-state fMRI data on 13 COS patients and 19 healthy volunteers. We measured functional connectivity between each pair of 100 regional nodes, focusing on wavelet correlation in the frequency interval 0.05–0.1 Hz, then applied global and local thresholding rules to construct graphs from each individual association matrix over the full range of possible connection densities. We show how local thresholding based on the minimum spanning tree facilitates group comparisons of networks by forcing the connectedness of sparse graphs. Threshold-dependent graph theoretical results are compatible with the results of a k-means unsupervised learning algorithm and a multi-resolution (spin glass) approach to modularity, both of which also find community structure but do not require thresholding of the association matrix. In general modularity of brain functional networks was significantly reduced in COS, due to a relatively reduced density of intra-modular connections between neighboring regions. Other network measures of local organization such as clustering were also decreased, while complementary measures of global efficiency and robustness were increased, in the COS group. The group differences in complex network properties were mirrored by differences in simpler statistical properties of the data, such as the variability of the global time series and the internal homogeneity of the time series within anatomical regions of interest. Keywords: graph theory, brain, network, modularity, schizophrenia, clustering, fMRI
Introduction One of the most ubiquitous properties of complex systems, like large-scale functional brain networks, is that they generally have a modular community structure (Bullmore and Sporns, 2009). Using resting-state fMRI analysis, functional communities or modules can be broadly defined as groups of brain regions whose fMRI time series are similar to each other and dissimilar from other groups. How to partition the brain into such functional communities, and the related question of how to assess the quality of these partitions, are methodological issues that have been approached from the perspectives of both unsupervised learning and graph theory. In the context of unsupervised learning, where brain regions are considered as objects in n-dimensional functional space to be classified into their “natural” groups, hierarchical cluster analysis has been used to decompose the brain into a small number of functional modules that resemble known patterns of neural connectivity (Cordes et al., 2002; Salvador et al., 2005). In graph theory, on the other hand, brain regions are nodes (or vertices), functional connections between nodes are edges (or links), and modules are
Frontiers in Systems Neuroscience
groups of nodes with many intra-modular links to each other but few inter-modular links to external groups (Newman and Girvan, 2004). Graph theoretical work has shown that human brain functional modules are hierarchically organized (Meunier et al., 2009b; Bassett et al., 2010), that their structure is altered in normal aging (Meunier et al., 2009a) and in adolescence (Fair et al., 2009), and that their structure is relatively consistent for fMRI and diffusion spectrum imaging (DSI) of the same subjects (Hagmann et al., 2008). The brain, at least the healthy brain, is a modular system. Here we test the hypothesis that the normal modular community structure of functional brain networks might be somehow disrupted in neuropsychiatric disease, specifically in schizophrenia. There are theoretical reasons to posit that the brain’s modularity is crucial in terms of its evolution and healthy neurodevelopment. Modularity may allow the brain to adapt to multiple, distinct selection criteria over time (Kashtan and Alon, 2005). Modules may also represent stable subcomponents of the brain, which facilitate the construction of a complex system from simple building blocks (Simon, 1962). In the context of the recent focus on the
www.frontiersin.org
October 2010 | Volume 4 | Article 147 | 1
Alexander-Bloch et al.
Modularity and local connectivity in schizophrenia
evelopmental phenotypes of neuropsychiatric disease (e.g., d Gogtay et al., 2008; Giedd et al., 2009), it makes sense to measure properties of neuroimaging data, such as modularity, that are theoretically linked to network development and that may provide sensitive markers of abnormal brain development in disorders such as schizophrenia. In fact, dysmodularity in schizophrenia has already been proposed as a neuropsychological theory, implying the breakdown of information encapsulation between brain systems that are specialized to carry out different tasks (Fodor, 1983; David, 1994). In the functional neuroanatomical context, possible examples might include pathological crosstalk between inner speech and auditory areas in the pathogenesis of hallucinations (Shapleske et al., 2002), or between left and right prefrontal cortex in working memory tasks (Lee et al., 2008). However, it is clear that this point can be argued from both sides: For example, patients seem to be more susceptible than controls to the Müller-Lyer illusion (Pessoa et al., 2008), a visual illusion that persists in spite of explicit knowledge about the nature of the illusion, which has been held up as an exemplar of perceptual modularity. At any rate, it is not obvious how to relate the notions of psychological modularity and topological modularity as it is quantified in complex systems, and the dysmodularity hypothesis has not yet been tested with any rigor in neuroimaging experiments. There are methodological barriers to testing this hypothesis. As already noted there are a number of possible ways in which the community structure of functional networks can be described, and these alternatives have not been comparatively evaluated. Moreover it is non-trivial to make comparisons of modularity, however measured, between two groups of brain graphs with different topological properties. Even random graphs show complex properties including modularity to an extent that varies depending on the number of nodes and edges in the graphs (Bollobás, 1985; Anderson et al., 1999; Guimerà et al., 2004). Network properties can change dramatically around the percolation threshold where graphs become node-connected (Dorogovtsev et al., 2008), where “node-connected” means that none of the nodes is entirely isolated, each is linked by at least one edge to a single giant connected cluster. To ensure that statistical comparisons of brain network properties are meaningful, therefore, all of the graphs should ideally have the same number of nodes and edges, and they should all be nodeconnected. This last point is crucial because graphs constructed by global thresholding from data on different subjects may often show different degrees of node-connectedness, especially if the graphs are sparse. While differences in node-connectedness, e.g., as measured by percolation threshold, may be informative in their own right (Chen et al., 2007), they should ideally be controlled when considering group differences in other more edge-based network metrics such as degree. One conceptually simple way of doing this is to restrict evaluation of network metrics to a range of connection densities for which all graphs are node-connected (Bassett et al., 2008; Lynall et al., 2010). However, this approach may preclude comparative analysis of network properties at sparser connection densities where complex topological features such as modularity are typically most prominent. We explore some of these methodological issues in the context of a preliminary investigation of the modularity and other properties of brain functional networks measured using fMRI in
Frontiers in Systems Neuroscience
childhood-onset schizophrenia. We devise a way of applying a local threshold to construct brain graphs, which ensures that all of the graphs are node-connected at minimal densities, in contrast to the variability of node-connectedness that typically arises when graphs are constructed by a global threshold. We compare standard graph theoretical modularity results with the results of an unsupervised learning approach, using a generalization of the k-means algorithm known as partition around medoids (PAM), and a multi-resolution spin glass algorithm. In addition to modularity, we estimate several other properties of the graphs, most of which have previously been investigated in adult-onset schizophrenia (Liu et al., 2008; Rubinov et al., 2009; Lynall et al., 2010). Finally, we ground the complex network analysis by looking at simpler properties of the fMRI time series in these subjects, such as the variability of the time series and its internal homogeneity within anatomical regions of interest. We find evidence in support of network dysmodularity in COS, and explain this finding in the context of the other properties of the fMRI phenotype that we investigate. To our knowledge this is the first study to report less modular brain organization or abnormal community structure of brain functional networks in any human population.
Materials and Methods Sample
Thirteen COS patients and 19 controls or “normal volunteers” (NV) were recruited as part of an ongoing National Institute of Mental Health study of COS and normal brain development (ClinicalTrials. gov Identifier: NCT00001246). All patients met the DSM-IV criteria for childhood-onset schizophrenia, and consent was acquired from both patients and their legal guardians. The populations did not differ significantly in terms of age (COS sample mean age = 18, standard deviation = 4; NV sample mean age = 19, standard deviation 4; t-test p-value = 0.29) or gender (8 female, 5 male COS; 10 female, 9 male, NV; chi squared test p-value = 0.89). Image Acquisition and Preprocessing
All images were acquired using a 1.5T General Electric Signa MRI scanner located at the National Institutes of Health Clinical Center (Bethesda, MD). One anatomical T1-weighted fast spoiled gradient echo MRI volume was acquired: TE 5 ms; TR 24 ms; flip angle 45°; matrix 256 × 256 × 124; FOV 24 cm. In addition, two sequential 3 min EPI scans were acquired while subjects were lying quietly in the scanner with eyes closed: TR 2.3 s; TE 40 ms; voxel 3.75 mm × 3.75 mm × 5 mm; matrix size 64 × 64; FOV 240 mm × 240 mm; 27 interleaved slices. The first four volumes of each functional scan were discarded to allow for T1 equilibration effects. AFNI was used for slice time correction and for motion correction (Cox, 1996). In terms of motion, the maximum displacement of brain voxels due to motion did not differ significantly between the groups (sample mean COS maximum displacement = 2.45 mm; sample mean NV maximum displacement = 1.93 mm; t-test p-value = 0.41). FSL’s FLIRT (Jenkinson and Smith, 2001; Jenkinson et al., 2002) was used to register each subject’s functional scans to that subject’s structural scan using a 6 degrees of freedom transformation, and to register the structural scan to MNI stereotactic standard space using a 12 degrees of freedom transformation. Although registering both pediatric and adult
www.frontiersin.org
October 2010 | Volume 4 | Article 147 | 2
Alexander-Bloch et al.
Modularity and local connectivity in schizophrenia
brains to the MNI adult brain template image could result in some age-specific differences in spatial normalization, these differences are unlikely to affect fMRI results because of fMRI’s relatively low spatial resolution (Burgund et al., 2002; Kang et al., 2003) and because functional activity is represented by regional mean time series averaged over multiple voxels comprising regions of the parcellation template image. Both these factors suggest that the scale of any possible age-related mis-registration is likely to be small in comparison to the relatively coarse-grained scale of functional network analysis applied to the data. We note that adult template images have previously been used as a basis for normalization of fMRI data on participants in similar and even younger age-ranges than our sample (Durston et al., 2003; Turkeltaub et al., 2003; Cantlon et al., 2006; Crone et al., 2006; Galvan et al., 2006). Wavelet measures of variability and covariability at different scales
For each functional scan, 111 anatomical regions were defined using the combined cortical and subcortical Harvard-Oxford Probabilistic Atlas (Smith et al., 2004) thresholded at 25%. Because of low quality signal due to susceptibility artifacts in some regions, quantified as the majority of a region being absent from the EPIs of the majority of subjects, the brainstem and 5 bilateral cortical regions at the inferior frontotemporal junction were excluded, which resulted in a dataset of 100 regions for each functional scan. In addition to the voxel time series, 100 regional time series were estimated by averaging the voxels within each of the regions, while one global time series was estimated by averaging the voxels within all of the regions. The maximal overlap discrete wavelet transform (MODWT) with a Daubechies 4 wavelet was used to band-pass filter the time series (Percival and Walden, 2006) and, in what follows, we will focus on the results obtained using the scale 2 frequency interval, 0.05–0.111 Hz. This frequency scale was chosen to minimize the impact of higher frequency physiological noise while maximizing the degrees of freedom available for wavelet correlation, as well as for consistency with previous work. Wavelet coefficients with boundary effects from the MODWT were excluded, and the coefficients of the sequential functional scans were concatenated to form a single series of 144 wavelet coefficients which was the basis for all further analyses of variability and covariability (e.g., see Figures 2B,D). Variability of the global and regional signals
We quantified the variability of the low frequency MRI signal simply as the sample variance of the MODWT wavelet coefficients at scale 2. (To make comparisons between the variability of the signal at different temporal scales, the wavelet variances would have to be corrected for the redundancy of the MODWT, but we focus exclusively on differences between the clinical populations at the same scale.) Variability was estimated for each of the anatomical regions and also for the global signal. Covariability between and within regions
The wavelet correlation, −1 ≤ ri,j ≤ +1, was used as an estimate of the covariability between two time series i and j. For N anatomically defined regions, this value was found for all (N 2 − N)/2
Frontiers in Systems Neuroscience
pairs of regions. The regional strength of connectivity s(i) for a region i was defined as the mean of the correlations with the N − 1 other regions: s (i ) =
∑r j ≠i
i,j
(1)
N −1
We also explored the covariability of the voxels within each anatomical region, treating each anatomical region as a distinct subnetwork. If x is a voxel within a region i, and K is the number of voxels within i, the average voxel connectivity strength s(x) over all K is a measure of the internal homogeneity of the signal from region i. Although at a different spatial and temporal scale, this statistic is similar to so-called regional homogeneity (ReHo; Zang et al., 2004), which has been calculated between neighboring voxels. For greater consistency with this prior work, we also calculated Kendall’s coefficient of concordance, 0 ≤ W(i) ≤ +1, between the voxels in each region i:
∑ (R )
2
W (i ) =
x
(
− n(R )2
1 2 3 K n −n 12
)
(2)
Here, K is the number of voxels in region i; n is the length of the − time series; Rx is the sum of the ranks of the xth voxel; and R is the mean of Rx, over all K voxels. The numerator in Eq. 2 is the variance of the sums of the ranks, and the denominator is the maximum possible variance given the number of voxels and the length of the time series (Sheskin, 2007). The advantages of this statistic are that it is non-parametric and that it is defined for a region containing any number of voxels. The average regional concordance is the mean of W over all N regions. Graph construction
Note that R code used for graph construction is publicly available at http://brainnetworks.sourceforge.net, and the Appendix contains definitions of some commonly used graph theoretical terms. To make a graphical model of brain network connectivity, the usual approach is to generate a binary adjacency matrix A from a continuous association or connectivity matrix C. It is also possible to measure network properties by analysis of the connectivity matrix using tools which do not require a binary thresholding operation to generate an adjacency matrix. Here we explored two different (global and local) thresholding methods to construct an adjacency matrix from the 100 × 100 connectivity matrix, C, where Ci,j = |ri,j|, the absolute wavelet correlation coefficient for a pair of regional time series i and j. We also investigated two complementary methods – the unsupervised learning algorithm “partition around medoids” (PAM) and the multi-resolution spin glass model of modularity – to measure network properties without thresholding the connectivity matrix. Most human neuroimaging studies to date have used global thresholding to construct functional brain networks. Using this method, any |ri,j| of the functional connectivity matrix greater than a threshold, τ, implies an edge in the corresponding element of the adjacency matrix, A, meaning that Ai,j = 1. If ri,j 2 (Watts and Strogatz, 1998; Schank and Wagner, 2004). Clustering is a measure of the locally aggregated structure in a graph. Small-worldness
Small-world networks have high clustering, C, but low average minimum path length, L, compared to random networks. The small-worldness, σ(G), of a graph G is calculated as: C (G ) γ (G ) C σ(G ) = = R λ(G ) L(G ) LR
(6)
Here, CR is the clustering of random graph rewired so as to preserve the degree distribution of G, and LR is the average minimum path length of such a random graph. For connected graphs, the average minimum path length is identical to the inverse of the (unweighted) global efficiency, so we can also write λ(G) = ER/E(G). For disconnected graphs, formally σ(G) is undefined, but we can again substitute λ(G) = ER/E(G) to get a related quantity. A network is generally accepted as “small-world” if σ > 1 (Humphries et al., 2006). Robustness
As a measure of robustness, we looked at the resistance of the network to fragmentation after removal of nodes either in random order or in decreasing order of their degree. Suppose that there are M fragments in the network, i.e., M subgraphs that are connected internally but disconnected from each other. Resistance to fragmentation is defined as:
∑ N (N M
R(G ) =
j =1
j
j
)
−1
N (N − 1)
(7)
where Nj is the number of nodes in fragment j, and N is the number of nodes in the graph. N − 1 nodes are removed in order, and robustness is the mean of R over all of these smaller graphs (Chen et al., 2007). Modularity
We explored modularity using three complementary methods from unsupervised learning and graph theory: partition around medoids (PAM), fast greedy optimization of thresholded graphs, and simulated annealing of a spin glass model. See Figure 1 for an illustration of these methods, applied to a model network.
www.frontiersin.org
October 2010 | Volume 4 | Article 147 | 5
Alexander-Bloch et al.
Modularity and local connectivity in schizophrenia
PAM
PAM, like the more widely known method of hierarchical clustering, is an unsupervised learning algorithm that does not require thresholding of the connectivity matrix (Kaufman and Rousseeuw, 1987). Modules are referred to as “clusters” in the unsupervised learning literature, but to avoid confusion we will use the graph theory terminology. PAM is a generalization of the k-means algorithm that is more robust to noise and outliers. It requires as inputs the number of expected modules and the dissimilarity between every pair of nodes i and j. For our purposes, the dissimilarity between i and j is defined as 1 − Ci,j for the connectivity matrix C. The algorithm finds each module a representative node (medoid), and assigns other nodes to modules so as to minimize their dissimilarity with these medoids. The silhouette width, S, can be used to assess the quality of this partition:
( Ai − Bi ) Si = max ( Ai , Bi )
(8)
Here, i is a brain region, Ai is the mean dissimilarity between i and the other regions in its module, and Bi is the mean dissimilarity between i and the regions in the next nearest module. The silhouette width ranges from −1 to 1, and a high positive number means that i is well-classified. The mean silhouette width over every region provides a global measure of the quality of the partition. It is explored over a range of possible numbers of modules. Graph theoretical modularity
The modularity, Q, of a graph G can be quantified as the proportion of G’s edges that fall within modules, subtracted by the proportion that would be expected due to random chance alone, for a given partition of nodes into modules. This can be written as (Newman and Girvan, 2004): Q(G ) =
(
)(
1 ∑ Aij − Pij δ M i , M j 2m i ≠ j
)
(9)
Here, m is the total number of edges; Aij = 1 if an edge links i and j and 0 otherwise; δ(Mi, Mj) is 1 if i and j are in the same module and 0 otherwise, and ensures that only intra-modular edges are added to the sum; finally, Pij is the probability that there would be an edge between i and j, given a random graph comparable to G. The value of Pij depends on what counts as a “comparable” random graph, the so-called null model. We use Pij =
ki k j 2m
(10)
where ki is i’s degree, the number of other nodes to which i is linked by an edge. We include this information in the null model because it affects the expected proportion of intra-modular edges. Weighted modularity is calculated analogously. In Eqs 9 and 10, the total number of edges, m, becomes the total weight of the edges. The degree, ki, is replaced by i’s strength, which is the total weight of i’s edges. And finally the adjacency matrix, A, is replaced by the weight matrix, W; the ones in the adjacency matrix are replaced weights of the edges. Pij can be understood as the expected weight between i and j. Note that an edge’s
Frontiers in Systems Neuroscience
weight in the weighted modularity calculation is actually one minus that edge’s weight in the calculations of weighted global or local efficiency. There are several known algorithms to assign nodes to modules so as to maximize Q. The principal benefits of the fast greedy algorithm that we use are its computational speed and the fact that it has been used in prior fMRI studies (e.g., Meunier et al., 2009a,b). This algorithm starts by assigning each node to its own module, and then agglomerates modules in a step-wise fashion, choosing the 2 modules whose combination results in the highest Q. The modularity value for the graph is then the highest Q that results throughout this step-wise process (Clauset et al., 2004). We applied this algorithm over the full cost range using a global threshold and a local threshold, for weighted and unweighted graphs. Multi-resolution spin glass model
Finally, we employed a graph theoretical algorithm that looks at the modular structure at different resolutions. It has been shown that there is a resolution limit to modularity, in that modules smaller than a certain size are not found by traditional approaches (Fortunato and Barthélemy, 2007). Thus the modular structure is biased toward a certain scale, which is particularly problematic when considering a multi-scale system like the brain. This problem can be addressed by adding an additional parameter into the definition of modularity. One approach (Reichardt and Bornholdt, 2006) equates the problem of partitioning a graph with the problem of minimizing the energy of an infinite range Potts spin glass model, where the group indices become spin states. Groups of nodes with dense internal connections end up having parallel spins. The Hamiltonian, H, of a graph G is:
(
)(
H(G ) = − ∑ Aij − γPij δ M i , M j i≠j
)
(11)
Here, γ > 0 is the additional, adjustable parameter. The γ parameter can be thought of as a resolution parameter, such that higher values result in higher number of modules, each of which has fewer members on average. To find the optimal partition at different resolutions, this quality function H is minimized for different values of γ, using a simulated annealing approach. When γ = 1, minimizing this function is equivalent to maximizing modularity as defined in Eq. 10. One of the virtues of the spin glass algorithm is that, although it can be applied to graphs with any cost, it can also be appropriately applied to the unthresholded connectivity matrix, so we do not have to set a threshold (Heimo et al., 2008). One drawback of the algorithm is that there is no obvious way to choose between the partitions found with different values of γ. A potential solution is to focus on partitions that are stable over a range of values of γ if a such a partition exists (Lambiotte, 2010). It is also informative to look at the pattern of how the modular structure changes with different values of γ.
Results Variability and covariability of the MRI time series
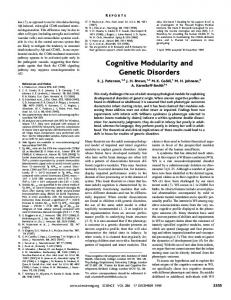
There were clear differences between groups in terms of some statistically elementary properties of the images: global mean variability, strength of functional connectivity, and within-regional homogeneity. The global mean wavelet-filtered time series had significantly reduced variability in COS versus healthy volunteers (sample mean global variability NV = 2.08; COS = 0.95; permutation test p = 0.007; Figures 2A,B). There
www.frontiersin.org
October 2010 | Volume 4 | Article 147 | 6
Alexander-Bloch et al.
Modularity and local connectivity in schizophrenia
was a similar but less obvious trend towards decreased variability at the regional level in the COS population (Figures 2C,D). The mean strength of between-regional functional connectivity was significantly reduced in COS versus healthy volunteers (sample mean pair-wise wavelet correlation NV = 0.37; COS = 0.26; permutation test p = 0.001). This finding extends to decreased strength of functional connectivity at the level of individual regions, if we consider each region’s average wavelet correlation with all other regions of the brain (Figure 2E). The within-regional homogeneity of the fMRI signal was significantly reduced in COS versus healthy volunteers (sample mean regional concordance, Kendell’s W, NV = 0.11; COS = 0.08; permutation test p = 0.002). This decreased regional concordance extends to almost every region considered individually (Figure 2F).
A
Graph theoretical properties
Comparing locally thresholded with globally thresholded graphs, both methods of network construction revealed a similar pattern of results. However, there were clear advantages to using locally thresholded networks, because differences in node-connectedness complicate group comparisons on other metrics at low costs. On average, using a global threshold, not all of the graphs become connected until a cost of 0.3, and the healthy volunteers generally become connected at higher costs than the patients (for some healthy subjects the minimum cost of node-connectedness >0.5). Another way of saying this is that the percolation threshold is set higher in healthy volunteers than in people with COS. On one level this difference is perhaps diagnostically interesting, but it is also
B Global Signal of Median NV and COS Subjects
0
1
2
3
Variance
4
5
Wavelet Coefficient
Variability of Global Signal
Controls
C
COS
0
D
Variability of Regional Signal ***
**
*
*
**
**
40
60
Region Number
80
100
80
Time (TR)
100
120
Left Insula Signal of Median Subjects
Mean Correlation Between Regions (Strength) ****************************************************************************** *********************
0
F
20
40
60
80
Time (TR)
100
120
Kendall's Concordance (W) Within Regions ******* * * ** *** * ********** *************** ** **** * ** *** ** **** ****** ** *** *
0.1
0.00
0.2
0.10
0.3
0.4
Strength
0.20
Kendall's W
0.30
20
0.5
0.6
60
Wavelet Coefficient
20 15
Variance
10 5 0
E
40
*
25
*
20
0
20
40
60
Region Number
80
100
Figure 2 | Plots showing differences between the schizophrenic patients and the controls in terms of relatively simple, non-graph-theoretical properties of their MRI time series. (A) The variability in the scale 2 (0.05–0.111 Hz) global MR signal is higher in the controls than in the COS population. (B) The difference in the variability of the global MR signal is illustrated with the time series from the median subjects of each population. The green line shows the boundary between the successive scans, whose wavelet coefficients were concatenated. (C) There is a trend toward greater variability in the MR signal of anatomical regions, in the control population
Frontiers in Systems Neuroscience
0
20
40
60
Region Number
80
100
relative to the COS population. (D) The difference in the variability of the regional MR signals is illustrated with the time series from the median subjects of each population for one of the regions that shows a difference, the left insula. (E) Regional strength, the average wavelet correlation between each region and every other region, is decreased in the COS population. (F) Kendall’s coefficient of concordance (W), a measure of the homogeneity of the signal within each anatomical region, is decreased in the COS population. Error bars are standard mean error, and asterisks signify p COS
7
4.6/4.6
7
-log(p value < .01)
Regional Differences in Efficiency between COS and NV
COS > NV NV > COS
7
4.6/4.6
7
-log(p value < .01)
Figure 5 | Illustrations of the anatomical foci of decreased clustering and increased global efficiency in schizophrenic (COS) patients relative to controls (NV). At a local threshold of 0.3 topological cost, permutation tests estimated the significance of the differences in regional clustering and efficiency, which are calculated in the same way as the clustering coefficient and the global efficiency, but for each of the 100 nodes individually. Estimations of significance were based on 2000 permutations per region, with p-values corrected for 100 multiple comparisons using a false positive correction p