Wolfgang Theilmann, Kurt Rothermel. Institute of Parallel and Distributed High-Performance Systems (IPVR),. University of Stuttgart, D-70565 Stuttgart, Germany.
Disseminating Mobile Agents for Distributed Information Filtering Wolfgang Theilmann, Kurt Rothermel Institute of Parallel and Distributed High-Performance Systems (IPVR), University of Stuttgart, D-70565 Stuttgart, Germany E-mail: [theilmannjrothermel]@informatik.uni-stuttgart.de Abstract An often claimed benefit of mobile agent technology is the reduction of communication cost. Especially the area of information filtering has been proposed for the application of mobile filter agents. However, an effective coordination of agents, which takes into account the current network conditions, is difficult to achieve. This contribution analyses the situation that data distributed among various remote data servers has to be examined with mobile filter agents. We present an approach for coordinating the agents’ employment, which minimizes communication costs. Validation studies on the possible cost savings for various constellations show that savings up to 90% can be achieved in the face of actual Internet conditions.
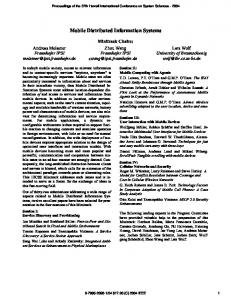
to send out an agent to a remote place (i.e. reduces communication cost) depends fundamentally on the characteristics of network connections between agent platforms and data servers. Secondly, the employment of agents has to be coordinated in order to achieve effective reduction of communication cost. We have to decide to which of the available agent platforms a replica of the agent should be sent to and which data servers the respective replicas have to examine. To be realistic, we cannot assume that every host in the network provides an agent platform. Figure 1 presents an example of how the dissemination of mobile filter agents may look like. The data that has to be transmitted between the different agent platforms and data servers is shown, too. Note that one agent transfer is not originating from the base platform, but from a platform that receives the agent during the dissemination process. base agent platform
1. Introduction An often claimed benefit of mobile agent technology is the reduction of communication cost, either for decreasing an application’s latency or for reducing the load on a network. This prediction has been made especially for scenarios of information filtering (e.g. in [8]), where mobile agents travel to large remote data sources, examine them locally and return with a comparatively small result. In this paper, we analyse the situation that data distributed among various remote data servers has to be examined with one filter method. We explore the benefit of using mobile filter agents to perform this task.1 An application, in which exactly this situation occurs, is presented in [13]. Two major problems have to be solved for the successful employment of mobile agents in scenarios like the one above. Firstly, we need knowledge about the current network conditions. The decision whether it might be useful 1 Our agent model simply requires the agent’s ability to perform a remote execution, i.e. to copy (replicate and transfer) its code on a remote server and to start it there with some arguments.
agent platform data server transfer of agent code and invocation parameters result transfer data download
Figure 1. Example for the dissemination of mobile filter agents.
We sketched some first ideas to solve the two problems recognized above in [12]. The approach for gathering and representing knowledge about network characteristic was extended and validated in [14]. We developed so called network distance maps that allow the scalable representation of and efficient access to host-to-host distances in computer networks. In this paper, we present our approach for coordinating the dissemination of a mobile filter agent. We introduce the concept of dissemination schedules, which describe exactly, where mobile agents are sent to and which data servers each agent has to examine. We show two algorithms that compute dissemination schedules. These schedules minimize
the communication costs resulting from the examination of remote data servers. The remainder of this paper is organized as follows. After discussing the dissemination problem more formally in Section 2 we take a look on related work in Section 3. Then, we briefly introduce the approach of network distance maps in Section 4. These maps are the basis for the computation of effective dissemination schedules, presented in Section 5. Section 6 provides an experimental evaluation of the communication cost savings in various constellations and finally, Section 7 reports the possible cost savings for a real application in the context of information retrieval.
2. The Dissemination Problem System Model. Our model of a network is a set of hosts x; y that assigns a distance to together with a function each pair x; y of hosts. We assume distances to be nonnegative and symmetric2 . A pair of hosts that are not connected due to a host or network failure can be modelled with an infinite distance value. Every network host is also called a data server since it possibly stores data for public access. The set of data servers is denoted D. Some network hosts may provide a platform for hosting mobile agents. This set of agent platforms is denoted A. We explicitly do not assume that every host provides an agent platform because such an assumption seems to be unrealistic. We consider communication cost as a function of the amount of shipped data and the network distance. For the sake of simplicity of our presentation and for the evaluations in Sections 6 and 7 we use the product function. Our approach does not impose any special distance metric, i.e. distances might be expressed in number of hops, round trip time, available bandwidth or anything else.
�( )
( )
Problem Formalization. The dissemination problem is characterized by the following parameters: 1. a set of data servers DE
� D to be examined,
2. the amount of data to be examined on each data server SE DE ! ,
:
IN
3. the amount of data resulting from the examination at the data servers SR DE ! ,
:
IN
4. the size of the mobile filter agent Sa
2 IN and
5. the base agent platform B 2 A, where the agent code is initially available and where all results must be delivered to. 2 The symmetry assumption is only necessary for our approach of constructing network distance maps, while the algorithms for computing dissemination schedules do not rely on it.
A dissemination schedule describes how the dissemination of an agent is coordinated for the filtering of a given set of data resources. It consists of a sequence of agent transfers and replications in form of a tree (compare to Figure 1). The nodes of this tree represent agent platforms to which the agent shall go to. The edges of the tree correspond to agent transfers. At each platform, represented by a tree node, the agent has to be replicated in order to go to the platforms, represented through child nodes. In addition, the schedule assigns to each visited agent platform the data servers that have to be examined from this platform. If we are only interested in reducing the communication cost it does not matter whether we send a clone to every child or whether we let the agent migrate to one of the children (after having examined the local data) and send clones to the others. The first alternative will increase the overall speed of the application, the second will reduce the number of existing replicates of the agent. A dissemination schedule can be formally described by three parameters: 1.
AV denotes the set of agent platforms to be visited (with B 2 AV ).
:
2. The function ex DE ! AV assigns an agent platform to each examined data server. To access a server’s data an agent moves to the assigned platform.
:
3. The function src AV n fB g ! AV describes the source from which the agent shall be copied to the respective agent platform.
The communication costs resulting from the execution of a dissemination schedule are: c
=
X
a V B | 2A
+
X d E 2D
nf
�( ( ) ) � src a ; a
{z
g
agent transfer costs
( �( |
a
(1)
S
}
( {z)) � E ( }) + |�( ( ) {z) � R( }) )
d; ex d
S
d
data transfer costs
�( )
ex d ; B
S
d
;
result transfer costs
where �; � denotes the distance between two hosts of the network. Now, we can define the dissemination problem as the problem of finding a dissemination schedule that minimizes the above cost function. Complexity. We can show that the dissemination problem is NP-complete in the number of agent platforms jAj. For that, we sketch a polynomial reduction of the Steiner tree problem which is known to be NP-complete [7]. The Steiner tree problem is based on an undirected, weighted V ; E and a set of nodes N � V . The probgraph G lem is to find a minimum cost spanning tree which contains
=(
)
all nodes from N . So given an arbitrary Steiner tree problem with N fn1 ; : : : ; nk g we can establish an equivalent dissemination problem by the following assignments which can be computed in polynomial time:
=
E � 1; SR � 0; Sa = 1; A := V ; B any 2 N ; DE := fd1 ; : : : ; dk g with � DE \ A = ;; S
2 A : �( ) := j1( )j � 0 8 i 2 DE 8 2 A : j i j := 1
8
a; b
d
a; b
a; b
;
a
d ;a
G
;
;
( )2E
if a; b else ; ;
if a else
=
i
n
In this special version of the dissemination problem, any data server is reachable via exactly one agent platform (with download cost of 0). Therefore, the cost in the dissemination problem is determined only by the agent transfer cost and the optimal solution is exactly a minimum spanning tree of those agent platforms that are connected to the respective data servers. That shows that any solution of the Steiner tree problem is as well a solution of this special dissemination problem and vice versa. Even polynomial algorithms that solve the dissemination problem with a satisfactory quality have to meet serious scalability requirements since they might have to deal with a large number of agent platforms (several thousands) and even more data servers (millions).
3. Related Work In mobile agent literature, performance aspects have been rarely examined. A performance model for single interactions (remote procedure call or migration) and for sequences of interactions has been proposed by Straßer and Schwehm [10]. The necessary network characteristics (delay, throughput) and information about the size of requests and responses must be available. In our scenario we differ from [10] in three aspects: (1) we take into account the aspect of gathering the relevant network data; (2) we do not impose any order for the agent transfers; and (3) we distinguish between agent platforms and data servers and do not assume a static assignment from which platform data servers are to be examined. Ranganathan et al. present a mobile agent application that considers current network characteristics [9]. They use agents to dynamically replace a chat server such that latency to the chat clients is minimized. The server can be placed at any client. Latencies are frequently measured from each client to each other. Such a solution of completely measuring all distances would not scale for our scenario in which possibly all Internet hosts are involved. At a first glance, the problem of IP-Multicast-Routing [11] seems to be quite similar to the dissemination problem. Nevertheless, there are some fundamental differences
that hinder us from adopting techniques developed for multicast routing. Multicast groups are persistent for a large number of messages. Their participants may change over time, but the group as a whole (and its address) remains. For this reason, multicast routing can adapt its paths over time according to the network conditions and according to the group members. In contrast to this, the group of agent platforms involved into a specific dissemination problem is only valid for a single message or mobile agent. Setting up a new multicast group for every single agent dissemination would impose an extreme network load since group members are widely distributed. Creating a predefined group for every combination of involved platforms would require an exponential number of groups. For each of these two alternatives there would still remain the problem to determine the appropriate group of agent platforms for a special scenario. The dual problem to the agent dissemination problem is that of server-based document replication towards large client populations. Bestavros presents an approach in which documents are replicated along a hierarchy of proxy servers [2]. Such a hierarchy has to be set up for any home server. The optimization criterion at each proxy is to maximize the number of document requests that can be satisfied by this proxy. In contrast to our approach, network distances are not explicitly considered by this optimisation. Gwertzman and Seltzer suggest to partition the client hosts into clusters of geographically closely located hosts [5]. Then, replication decisions are performed independently for each cluster. We differ from this approach since we use hierarchical clustering, which improves scalability, and distances are measured from the network. An important difference between these two approaches and ours is that we consider the interdependence between single replication decisions, e.g. agents may be copied from other agent platforms that received the agent code during the dissemination process and data servers might be examined by an agent sent to a neighboured cluster.
4. Network Distance Maps This section provides an overview of our approach to represent host-to-host distances in computer networks. A detailed description and discussion of the approach can be found in [14], together with an experimental validation performed on the basis of large scale measurements in the Internet. Distance maps are computed on the basis of a set of measurement servers that allow to measure the distance between themselves and arbitrary other network hosts. For our scenario, we assume that the agent platforms can adopt this function. The basic idea is to partition the set of measurement servers (resp. agent platforms) into clusters of closely
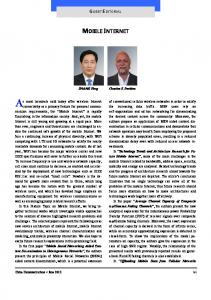
connected hosts. By recursively repeating the partitioning process we finally obtain a tree structure in which each node represents a cluster of hosts. These clusters are refined in a root-to-leaf direction. The tree’s leaf nodes correspond to single agent platforms. The additional data servers are assigned to their closest agent platform afterwards. In [14], we evaluated various cluster criteria. The experiments in this article are based on the Min k-Clustering criterion, which aims to minimize the maximum distance between any two hosts in one cluster. The parameter k determines the number of clusters into which a set of hosts is to be divided. The cluster tree is extended by distance values between sibling nodes. The distance between two sibling clusters is an estimation for the average distance between arbitrary agent platforms belonging to these clusters. The distance between sibling platforms is directly derived from the corresponding network measurement. In addition, distances between data servers and their closest agent platforms are stored, too. Figure 2 shows a graphical representation of a cluster tree. Network
cluster
Cluster 2
Cluster 2.1 ...
...
Cluster 2.2
...
is partitioned into distance between 2 clusters / platforms distance between data server and closest agent platform
Figure 2. A cluster tree computed on the basis of agent platforms.
Distances can be derived from this tree representation as follows. They are denoted by k�; �k. The distance ka1 ; a2 k between two agent platforms a1 and a2 is estimated as the distance between the children of the least common ancestor3 of a1 and a2 . Using the auxiliary function cl D ! A, which maps data servers to their closest agent platform, the distance between an agent platform a and a data server d is estimated as ka; dk fka; cl d k; d; cl d g. Note, that the first argument in the max-function is estimated from the cluster tree while the second one directly results from a network measurements. We use the maximum instead of the simple distance between agent platform and closest agent platform in order to obtain more precise distance estimations for data servers, which are not closely connected to any platform, i.e. which are not well covered from the cluster tree. The derivation of any distance is feasible in linear time, i.e. linear to the tree’s depth.
:
:= max
3 The
( ) �(
The presentation of our approach for computing dissemination schedules is done in two steps. First, we describe a basic algorithm that solves the NP-complete dissemination problem in a suboptimal way but in polynomial time. Then, we apply this mechanism to our hierarchical network representation thus achieving a hierarchical algorithm, which follows a divide-and-conquer strategy. This second algorithm satisfies scalability issues much better than the first one. Both algorithms require the availability of the parameters that characterize the dissemination problem, presented in Section 2, and the relevant network distances.
5.1. Basic Algorithm The basic algorithm for computing a suboptimal but effective schedule follows a greedy heuristic. It tries to improve a current solution by adding that agent platform to the set of visited agent platforms that promises the largest benefit with regard to the communication costs. The initial solution is the client server solution in which all data servers are examined from the base agent platform. The trivial schedule for this solution is described by AV fB g and ex � B . The function src does not need to be specified since no agent transfer occurs in the client server solution. Originating from a schedule characterized by AV , ex and src, we can compute an extended schedule A0V , ex0 , 0 src that includes an additional agent platform a 2 = AV : Firstly, a is included into the set of visited platforms: A0V AV [ fag: Secondly, we check if any data server should be examined from the new agent platform:
:=
agent platform data server Cluster 1
5. Computing Dissemination Schedules
( ))
ancestor-relation is the transitive extension of the parent-relation.
:=
8 2 DE : d
~
~
~
�
ex
0
�( ( ) := ~ ( ) ifelse. d
ex d
;
a
;
( )) � �( ~)
d; ex d
d; a
Finally, we determine the closest agent platform from which the agent can be transfered to the new one:
:= [ f(~ closest )g closest such that �(~ closest ) = mina 0
src
src
a; a
;
�(~ )
with a a; a a; a . 2AV The cost function 1 allows to compute the costs related to any dissemination schedule. Therefore, we are able to compare the costs of any two schedules. By this, we can formulate our algorithm for computing a suboptimal dissemination schedule, which minimizes the communication cost. It is described in Figure 3. Complexity. The computation of any extended schedule (and its cost function) requires O jDE j jAV j steps. Each iteration of our algorithm’s main loop computes jAj jAV j
(
+
)
initial schedule: examine all data servers from the base platform do for all a 2 = AV : compute extended solution including a choose a 2 = AV such that the costs resulting of the schedule including a are minimal if (schedule with a is better than the current solution) add a to current schedule (i.e. AV := AV [ fag) else stop, since no more improvements are possible od
Figure 3. Basic dissemination algorithm. extended schedules. Thus, the computation of a solution that includes t agent transfers can be done in
t+1 X i=1
(jAj ) � (jDE j + ) i
O
i :
An upper bound for this complexity, which is tight if
jAj, is
( +1) �jAj� (jDE j + ) = ( �jAj� (jDE j + )) t
O
t
O t
t
t
:
(3) Every node, receiving the agent from a parent node, checks for beneficial siblings which shall get another agent copy. Again, this is done by applying the basic algorithm. Figure 4 shows a possible scenario of this process. The tree traversal starts at the base platform node (1). It is checked, if any of the sibling nodes should get a copy of the agent. This is the case for one of them (2). The first step is repeated for the parent node (3) for which no beneficial sibling exists. At the next parent node (4) one beneficial sibling (5) is detected. The node that receives the agent selects the rightmost child to forward the agent to (6) and so on. Finally, the agent has been copied to five additional agent platforms (2, 7–10). The resulting schedule is shown on the right side of Figure 4. The agent platforms are labeled with the same numbers as used in the cluster tree. The representation of data servers and their assignment to agent platforms (the function ex) is omitted for the sake of simplicity. The resulting schedf; ; ; ; ; g ule can be formally described by AV and src f ; ; ; ; ; ; ; ; ; g. Again, the function ex is omitted.
:= 1 2 7 8 9 10 = (2 1) (8 1) (7 8) (9 8) (10 8)
� (2)
We can see that though we achieved an algorithm that runs in polynomial time, the complexity is still enormous for large numbers of agent platforms, agent transfers or data servers.
5.2. Hierarchical Algorithm based on Distance Maps To improve the scalability of the basic algorithm we developed an extended, hierarchical version that exploits the abstraction of network clusters from the network distance maps. The main idea is to traverse the cluster tree and to apply the basic algorithm to each set of sibling clusters. The traversal starts from the base agent platform, which is a leaf node of the cluster tree. From this point the traversal is done by performing the following three basic actions: (1) Every ancestor n of the base platform checks if placing a copy of the agent at some of the node’s sibling nodes would save communication costs. This check is done by applying the basic algorithm described in Section 5.1 to the set of nodes consisting of the node n and its siblings. (2) A node that receives an agent and that is no leaf node (i.e. agent platform) specializes the agent assignment by selecting that child node that achieves the greatest benefit if taking the agent. This is done by computing the costs of each dissemination alternative (Equation 1) and selecting the best one.
4
5
3
7
2
1
10
1 2
6 9
8
8 10
9
7
node checking for beneficial siblings
node receiving agent and specializing
node receiving agent
node receiving, (specializing,) and checking
Figure 4. Example for a hierarchical schedule computation: traversal of the cluster tree (left) and resulting schedule (right).
Complexity. The following discussion uses two parameters to describe the size of a cluster tree: h denotes the tree’s depth and k denotes the maximum number of children a node can have. The algorithm’s running time can be optimized by precomputing a function that assigns the data servers to all their ancestors in the cluster tree. This is feasible in O jDE j � h . An important aspect for the complexity of the hierarchical algorithm is that the execution of the basic algorithm is always done for a comparatively small set of sibling nodes and for the subset of data servers that belong to the considered nodes. A data server is relevant for at most h � k 2 schedule computations because it has at most h ancestors in the cluster tree, each of them has at most k siblings and at most k agent transfers can occur. Each schedule computation has to consider at most k possible sources from where the agent can be copied. The
(
)
number of schedule computations during a cluster tree traversal (resulting to t agent transfers) can be specified to O
(|
{z�
h
k
} + �( | � t
h
sibling checks from base and ancestors
= (� � ) O
t
h
k
+ {z
h
� } )) k
specialisation and additional sibling checks
( | � 2{z� jDE j} + | � {z� � } ) #agent platform h
k
#data server considerations
k
t
h
k
considerations
= O(h � k2 � (jDE j + t)):
168
= 10
k :
Combining the above results, the overall running time of a tree traversal is O
were successfully measured. If, in the subsequent analysis, we needed to rely on a distance we were not able to measure we used a default value, which is the median of the respective distance metric. The median for the #hops metric is 16, the median for rtt is ms. On the basis of these data, we computed a cluster tree . More inforwith the Min k-Clustering criterion and k mation about the measurement methodology and a detailed analysis of cluster trees can be found in [14]. In order to evaluate the quality of the computation of dissemination schedules we ran various test series. We assumed that all the measurement servers provide an agent platform. Then, our network measurements allow to compare the costs of the traditional client server approach to the costs resulting from the application of any dissemination schedule. For every test scenario we ran 100 tests each with a distinct base agent platform and distinct data servers. The presented results are always averaged over these 100 runs. The size of the agent is normalized to 1. Data amounts are described as multiples of the agent size. In order to reduce the number of variables in our graphical presentations we set SE d (the amount of examined data) to be constant for all data servers d and the result size to 0. This last assumption does not restrict the validity of our experiments since rather than setting the result size to some value v we could achieve similar results by decreasing the value for SE by v .
(3)
This equation differs from equation 2 for the basic algorithm in the first two factors. Instead of t � jAj, we obtain 2 h � k for the hierarchical algorithm, which is better by orders of magnitude. (Note, that jAj � k h .) In addition, we have to consider that the running time estimation for the hierarchical algorithm is quite pessimistic, e.g. we supposed that every additional agent copy would result in additional schedule computations on all h levels of the cluster tree. We expect that the tree traversal is much faster in the average case.
()
6. Experimental Validation
6.2. Results
In this section, we present an experimental validation of the possible cost reductions that can be achieved by disseminating mobile filter agents. We performed Internet measurements for two distance metrics: the number of hops (the number of network routers existing on a path between two hosts) and the round trip time (the time needed to transmit a simple datagram packet to a remote host and back).
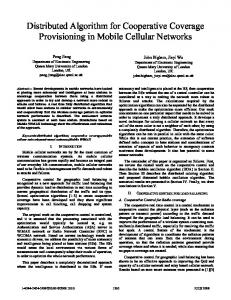
Basic Dissemination Algorithm. At first, we explored the quality of the basic dissemination algorithm. Network distances are directly used as measured instead of relying on the cluster tree. We varied the number of data servers (1, 10, 50, : : :, 400) and the amount of the examined data. The graphs in Figure 5 show the achieved cost reduction and the associated number of agent transfers (both averaged over 100 runs). The cost reduction is defined as agent solution cost=client server cost . For the first experiments we used the #hops distance metric. We can see that already for a small data amount of one quarter of the agent size and 50 data servers a cost reduction of more than 30% can be achieved. For a data size four times larger than the agent size and again 50 data servers a cost reduction of nearly 60% is possible. The additional communication costs that result from the agent transfer(s) seem to have almost amortized for 50–100 data servers. The cost reduction for larger numbers of data servers is no more significantly increased. The number of agent transfers depends roughly linearly on the number of data servers and the data amount. However, the latter dependence will not be valid for larger data amounts since the number of agent platforms (and therefore the number of reasonable agent transfers) is limited. An in-
6.1. Methodology We performed network measurements on the Internet by using the tool traceroute, which determines the routing path between two Internet hosts [6]. The resulting data allows to derive the number of hops and a very rough estimation of the round trip time (rtt). However, traceroute does not always succeed since it is not supported by every host or router. A detailed discussion of traceroute’s caveats can be found in [4]. Various web servers on the Internet are offering to perform traceroute measurements from their location to an arbitrary Internet host. We compiled a set of 119 such web servers (measurement servers) and 460 additional hosts and performed measurements from every measurement server to every host, in total 68782 measurements. 67961 of them
(1
)
100 data amount = 0.25 0.5 1 2 4
80
Number of agent transfers
Hops * bytes reduction (%)
100
60
40
20
0
data amount = 0.25 0.5 1 2 4
80
60
40
20
0 0
50
100 150 200 250 300 Number of data servers
350
400
0
50
100 150 200 250 300 Number of data servers
350
400
Figure 5. Basic dissemination (#hops metric): cost reduction (left) and #agent transfers (right). 100
80
60
40
data amount = 0.25 0.5 1 2 4
20
0
Number of agent transfers
Rtt * bytes reduction (%)
100
data amount = 0.25 0.5 1 2 4
80
60
40
20
0 0
50
100 150 200 250 300 Number of data servers
350
400
0
50
100 150 200 250 300 Number of data servers
350
400
Figure 6. Basic dissemination (rtt metric): cost reduction (left) and #agent transfers (right). teresting point is that the number of agent transfers seems to be almost independent of the achieved cost reduction. Since we do not assume that every data server also provides a platform for mobile agents there must be an upper bound for the achievable cost reductions. To explore this bound we performed another test with a large data amount of 100 and 400 data servers. The reduction for this scenario was 64%. We ran the same experiments, now based on the rtt distance metric. The results are depicted in Figure 6. We observe that cost reductions are much higher than for the #hops metric. The reason for this effect can be found in the empirical distribution of the two distance metrics. #hops distances are distributed with a small deviation around their mean. In contrast, rtt variations are much larger. This leads to the fact that the average #hops distance between a data server and its closest agent platform is about 7 (� = of the mean), whereas the average rtt distance between data servers and their closest agent platform measures ms (� = of the mean). Therefore, filter agents can be transfered much closer to their data servers, if rtt defines the distance.
1 10
25 27
The number of agent transfers is relatively higher than for the #hops metric. Dependencies on the number of data servers and the data amount are similar. The upper bound of the possible cost reduction is 91% (estimated by the scenario used above with a data amount of 100 and 400 data servers). Hierarchical Dissemination Algorithm. Next, we evaluated the quality of the hierarchical dissemination algorithm. Now, network distances are derived from the cluster tree. The resulting cost reductions are shown in Figure 7. It is not surprising that the cost reductions are higher for the basic algorithm than for the hierarchical one. Firstly, the hierarchical algorithm is based on the network distances derived from a cluster tree. These distances are only estimations for the real distances, which are used by the basic algorithm. Secondly, the hierarchical algorithm is based on the abstraction of clusters and hence considers groups of data servers, which may lead to less accurate estimates. However, the cost reduction achieved by the hierarchical algorithm is still significant. The advantage of the basic algorithm compared to the hierarchical one decreases for larger
100 data amount = 0.25 0.5 1 2 4
80 60
Rtt * bytes reduction (%)
Hops * bytes reduction (%)
100
40 20 0
80 60 40 data amount = 0.25 0.5 1 2 4
20 0
0
50
100 150 200 250 300 Number of data servers
350
400
0
50
100 150 200 250 300 Number of data servers
350
400
Figure 7. Hierarchical dissemination: cost reduction for #hops metric (left) and rtt metric (right). numbers of data servers and data amounts. It nearly vanishes for a data amount of 4 and 400 data servers. Another interesting observation is the negative cost reduction for the #hops metric, a data amount of : and 10 data servers. We found out that the distances between agent platforms and closely connected data servers are generally underestimated by the cluster tree. Therefore, the cost estimations for solutions including some agent transfers are too optimistic which can result to the observed negative cost reduction. The effect vanishes for larger numbers of data servers or larger data amounts because the achievable cost reduction determines the result. The estimation of the upper bound through the scenario with a data amount of 100 and 400 data servers was 62% for the #hops metric and 89% for the rtt metric. These are almost the same values as for the basic algorithm. The characteristics of the number of agent transfers are similar to those for the basic algorithm.
0 25
Discriminating the Approximation Effects. We tried to determine how much the two mentioned approximation effects (derived distances and cluster abstraction) contribute to the less effective dissemination schedules resulting from the hierarchical algorithm. For this, we computed a dissemination schedule with the linear algorithm but on the basis of distances derived from the cluster tree. Surprisingly the achieved cost reductions were almost equal to those of the hierarchical algorithm. This shows that the less effective schedules are mostly caused by the unprecise distance estimations, which are done on the basis of the cluster trees. Empirical Running Time. A final interesting remark is that we compared the real running time needed to compute the schedules in the four above test series. We observed that the computation of the hierarchical algorithm turned out to be about 100 times faster than the basic algorithm.
We expect that this effect becomes even more dramatic for larger numbers of agent platforms.
6.3. Considering the Costs of Distance Maps The cost savings calculated in our experiments do not consider the network load that is caused by the process of constructing and maintaining a network distance map. However, the latter costs are difficult to assess because their relevance depends on the number of clients that make use of a network map service and the profit they can draw from this service for their network communication. In [14], we identified a large variety of applications that can profit from network distance maps. These range from replication services to any kinds of distributed object repositories In addition, the costs of a distance map depend on the used distance metric, the measurement method and the desired accuracy. For example, the measurement of the currently available bandwidth causes an overhead much higher than the measurement of the current round trip time. The variation scale of the respective metric is also an important factor. For example, #hops distances are supposed to be relatively static, thus they need to be updated only seldomly, while current round trip time is highly dynamic. However, also the latter one can be successfully estimated. Acharya and Saltz found out that the mean of an rtt sample (which describes the current distribution of the current round trip time very well) remains valid for about 45 minutes [1]. A detailed discussion of the costs of constructing and maintaining network distance maps can be found in [14]. Finally, it is possible that an application requires only the distances for a subset of interesting network hosts. For such an application much smaller distance maps can be constructed. For the Internet, the set of considered hosts can be at least reduced to the set of used address prefixes [3].
query term
#examined documents
#relevant documents
160 127 66
22 29 4
”mobile agent” ”information retrieval” multicast ”software engineering” ”petri net” invariant
cost reduction (#hops metric) basic hier. 57% 52% 52% 40% 62% 57%
cost reduction (rtt metric) basic hier. 85% 76% 77% 65% 88% 85%
Table 1. Cost reduction for some test queries.
7. Application This section presents an application that can profit from the use of mobile filter agents, especially from their dissemination towards interesting information sources. Application scenario. The application’s idea is to construct specialized search engines, so called domain experts, which are able to recognize documents belonging to their domain. Domain experts roughly work as follows: An incoming query is first forwarded to a traditional search engine from which a list of Uniform Resource Locators (URLs) is received. The documents corresponding to these URLs are then analysed whether or not they are relevant for the expert’s domain. Relevant documents are included into the expert’s knowledge base and finally, the user query is answered. In order to achieve an efficient examination of the remote documents we proposed to use mobile agents for the filtering process. The application of our dissemination algorithms is possible since we know the size of the agent and the remote documents. The latter ones are also returned by the traditional search engine. We developed an example filter component that is able to recognize scientific articles (written in English and available in HTML-format) and proved the filter’s effectiveness through some example queries. More details about domain experts and the filter component for scientific articles can be found in [13]. Achievable Cost Savings. We evaluated the employment of our dissemination methods for three example queries, which may typically occur in the context of a search for scientific articles. Each query was submitted to AltaVista and the resulting list of URLs was collected. We eliminated those links that were invalid or pointed to documents not in HTML-format. The documents corresponding to the remaining links were examined by the filter function. The agent dissemination and cost reduction calculation is based on the following parameters: We assumed that all the measurement servers, compiled for the experiments in the previous section, provide an agent platform. We measured the distances between them and each host that contains a document relevant for one of the three queries. A host in
Stuttgart (one of the measurement servers) is always assumed as the base platform. The size of the filter agent’s code is 16 kByte. Document sizes are given by the traditional search engine. The amount of data sent back from the remote filter agents to the domain expert is 2 bytes for every analysed document (a rating) plus the document itself for the documents recognized as being relevant. Table 1 provides the main results of our evaluation. The table shows for each query the number of documents that needed to be examined by the domain expert, the number of scientific articles found on these pages by a manual analysis and the cost reductions for the two metrics (#hops and rtt) and dissemination algorithms (basic and hierarchical). We can conclude that the dissemination mobile filter agents can significantly reduce the communication costs caused by the application. Again, cost savings are much larger for the rtt metric and also larger for the basic dissemination algorithm.
8. Conclusions and Future Work This contribution has shown that the employment of mobile filter agents can significantly reduce the communication cost needed for the examination of remote data servers. We have presented two algorithms that compute effective schedules for the dissemination of mobile agents and validated them on the basis of extensive Internet measurements. Our experiments have shown that the hierarchical clustering of agent platforms can improve the efficiency of the schedule computation by orders of magnitude. However, we also saw that the basic dissemination algorithm is more effective than the other one. We believe that our approach for computing disseminan tion schedules can be applied to arbitrary scenarios of communication where 1 message has to be send to n recipients. It is even possible that the recipients are not exactly known but given by a set of hosts towards which the message must be send to. (This occurs in our agent dissemination scenario and also in scenarios of replication disseminan communication, a host that is tion.) In a scenario of able to forward a message to other hosts takes the role of an agent platform and a recipient takes the role of a data server. The cost functions have to be adapted, accordingly.
1:
1:
Future work concentrates on the improvement of the distance estimations in cluster trees. These estimations turned out to be the major reason for the less effective cost savings of the hierarchical algorithm. In addition, we will try to decouple the application of agent dissemination from the construction of network distance maps. Finally, we intend to apply our approach of coordinating the employment of agents to other scenarios (for example, itineraries).
References [1] A. Acharya, J. Saltz: A Study of Internet Round-trip Delay. Technical report CS-TR-3736, Department of Computer Science, University of Maryland, USA, December 1996 [2] A. Bestavros: WWW Traffic Reduction and Load Balancing through Server-Based Caching. IEEE Concurrency, Special Issue on Parallel and Distributed Technology, vol. 5, January – March 1997, pp. 56–67 [3] P. Francis, S. Jamin, V. Paxon et al.: An Architecture for a Global Internet Host Distance Estimation Service. Proc. 18th IEEE Infocom’99, New York, USA, March 21–25, 1999, IEEE Press [4] G. Gardner: Understanding Traceroute. GeoNet Communications, white paper, 1998 URL: http://www.noc.geo.net/support/traceroute.html [5] J. Gwertzman, M. Seltzer: The Case for Geographical Push-Caching. Proc. 5th Conf. on Hot Topics in Operating Systems (HotOS’95), Orcas Island, USA, May 1995; details (1996) at URL: http://www.eecs.harvard .edu/ vino/web/server.cache/icdcs.ps
~
[6] V. Jacobsen: traceroute. December 1988. Documentation and software available from URL: ftp://ftp.ee.lbl.gov/pub/traceroute.tar.Z [7] R.M. Karp: Reducibility among combinatorial problems. Complexity of computer communications, R.E. Miller, J.W. Thatcher (Eds.), Plenum Press 1972, pp. 85–103
[8] K. Rothermel, F. Hohl, N. Radouniklis: Mobile Agent Systems: What is Missing? Proc. 1st Int. Working Conf. on Distributed Applications and Interoperable Systems (DAIS’97), Cottbus, Germany, September 30 – October 2, 1997, H. K¨onig, K. Geihs, T. Preuß (Eds.), Chapman & Hall, London [9] M. Ranganathan, A. Acharya, S. Sharma, J. Saltz: Network-aware Mobile Programs. Proc. USENIX 1997 Ann. Technical Conf., Anaheim (CA), USA, January 6– 10, 1997 [10] M. Straßer, M. Schwehm: A Performance Model for Mobile Agent Systems. Proc. Int. Conf. on Parallel and Distributed Processing Techniques and Applications (PDPTA’97), Las Vegas, June 30 – July 3, 1997, Volume II, H. R. Arabnia (Ed.), ISBN: 0-9648666-8-4, pp. 1132–1140 [11] A.S. Tanenbaum: Computer Networks. 3rd edition, Prentice Hall, New Jersey, 1996, pp. 370–372 [12] W. Theilmann, K. Rothermel: Efficient Dissemination of Mobile Agents. Proc. 19th IEEE Int. Conf. on Distributed Computing Systems Workshop on Web Based Applications, Austin (TX), USA, May 31–June 5, 1999, W. Sun et al. (Eds.), IEEE Press, pp. 9–14 [13] W. Theilmann, K. Rothermel: Maintaining Specialized Search Engines through Mobile Filter Agents. Proc. 3rd Int. Workshop on Cooperative Informative Agents (CIA’99), Uppsala, Sweden, July 31 – August 2, 1999, M. Klusch, O. Shehory, G. Weiß (Eds.), Lecture Notes in Artificial Intelligence 1652, Springer, July 1999, pp. 197–208 [14] W. Theilmann, K. Rothermel: Dynamic Distance Maps of the Internet. Technical Report (Fakult¨atsbericht) 1999/08, Computer Science Department, University of Stuttgart, Germany, July 1999 URL: ftp://ftp.informatik.uni-stuttgart.de/pub/library/ ncstrl.ustuttgart fi/TR-1999-08