with apperceptive disorders (Warrington & James, 1988). In contrast ... As Humphreys and Riddoch (1987b) pointed out, visual form recognition requires the ...
VISUAL COGNITION, 1997, 4 (3), 275 –310
Dissociation between Contour-based and Texture-based Shape Perception: A Single Case Study Lorella Battelli Dipartimento di Psicologia, Universita’ di Trieste, Italy
Clara Casco, and Guiseppe Sartori Dipartimento di Psicologia Generale, Universita’ di Padova, Italy A single case study of a patient suffering from a temporo-parietal lesion is presented. He was impaired at recognizing shape on the basis of texture information, whereas shape recognition on the basis of contours seemed comparatively preserved. To investigate the impaired level in texture processing, we used two alternative forced-choice tasks to test figure-ground segregation based on textural differences in contrasting modalities (tactile vs. visual) and viewing conditions (static vs. apparently moving stimuli). The results showed that the deficit was specific to visual stimuli (both static and dynamic). Moreover, this deficit did not occur with local texture analysis, but was always present in global texture segregation tasks. This suggests that contour analysis and texture segregation are separable operations in shape processing. The patient’s impairments are attributed to an inability to activate global processing of stimuli defined by texture but not by contours.
INTRODUCTION Visual agnosia has been defined as a disturbance of pattern recognition and identification without sensory defects and general mental deterioration. It has been classified as apperceptive or associative, depending on whether patients show an inability to integrate incoming sensory signals to form the percept, or an inability in mapping a perceptual representation onto stored knowledge Requests for reprints should beaddressed to C. Casco, Dept. of General Psychology, University of Padova, via Venezia 8, 35131 Padova, Italy. Email casco@ psico.unipd.it An early version of this paper was presented at the European Brain and Behaviour Society held in Madrid, September 1993. We thank the patient, A.B., for his limitless patience and co-operation. The research was supported by C.N.R. grants (1992, 1993) to C. Casco and G. Sartori. We thank Professor J. Kulikowski for providing helpful comments on an earlier version of the manuscript.
Ó 1997 Psychology Press Ltd.
276
BATTELLI, CASCO, SARTORI
about the object’s form and function (Benson & Greenberg, 1969; Campion, 1987; Kertesz, 1987; Lissauer, 1890/1988; Ratcliffe & Newcombe, 1982). Classically, the two forms of visual agnosia may be distinguished on the basis of ability to copy drawings, which is usually impaired only in patients with apperceptive disorders (Warrington & James, 1988). In contrast, some patients have been documented who are relatively good at copying the objects they fail to recognize (Ratcliffe & Newcombe, 1982). The object recognition deficits, in these latter cases, appear not to be consequent on an impairment in establishing adequate perceptual representations of visual forms. The distinction between apperceptive and associative agnosia, first introduced by Lissauer (1890), emphasizes a two-stage view of visual object recognition. More recent accounts propose that both the apperception and association stages may themselves be further divided into various substages (Humphreys & Riddoch, 1987a; Marr, 1982). According to this view, breakdow ns in visual object recognition processes can be identified (Riddoch & Humphreys, 1987a) additional to those captured by the apperceptive–associative distinction. As Humphreys and Riddoch (1987b) pointed out, visual form recognition requires the analysis of both local object features and global shape. A deficit in global shape processing may be investigated in different ways. For instance, one might experimentally demonstrate the presence of a specific deficit in the ability to identify more than one object among several simultaneously presented. This has been done by Riddoch and Humphreys (1987a) in a single case study. They have documented the case of a patient, H.J.A., with a severe modality specific deficit in visual object recognition. All of his difficulties have been interpreted as due to a problem in integrating local form information. The tasks he performed well did not require descriptions of integrated visual forms; examples include: They copying of objects he failed to identify, the matching of objects across different views, object decision to silhouettes. They also showed that, whereas H.J.A. was capable of discriminating between geometrical patterns that differed in orientation, his performance increasingly deteriorated as the number of elements in which the target was embedded increased. The same patient, however, was able to copy on the basis of a feature-by-feature reproduction strategy. This suggests that he was able to distinguish local features of complex patterns but was unable to integrate them into a whole configuration. Such a visual recognition disorder has been named “integrative agnosia”. An interesting question is whether integrative processes in contour perception are independent from those global processes involved in texture discrimination. Texture processing (Beck, 1972; Julesz, 1981) requires global visual perception in the sense that a large number of local figural elements must be integrated as a coherent region in a scene. When this global process is operative, discontinuities in surface features (texture elements) are detected to produce shape features, the two-dimensional contours of objects to which figure–ground
AGNOSIA FOR TEXTURE
277
segregation may be linked. However, both psychophysical (Cavanagh, Arguin, & Treisman, 1990; Treisman & Gelade, 1980) and physiological studies (Allman & Kass, 1976; Van Essen & Maunsell, 1983) suggest that surface features such as texture and motion are extracted and analysed in separate channels, whereas shape contours derived from this specialized region (De Yoe & Van Essen, 1988) are combined in common representations (Van Essen, Anderson, & Felleman, 1992). In a single case study, Vaina (1990) described a patient who showed a severe impairment in tasks involving visual texture segregation. In contrast, shape discrimination (between a square and an oblong) was impaired only for small stimulus differences (0.5cm). Vaina proposed that the patient’s specific impairment occurred at a stage at which details relating to a particular stimulus are assembled in proper local spatial relationships; the impairment was found in binding visual details together to form larger features of specific texture patterns, while binding of coarse aspects of form was normal. Further evidence for a dissociation between surface (texture) processing and shape integration has been provided by a single case study (Abadi, Kulikowski, & Maudell, 1981) with a patient who had very grave difficulty in recognizing common objects although he could recognize their texture. We describe here a patient suffering from a post-traumatic temporo-parietal lesion. Neuropsychological tests showed a rather specific visual disorder in the recognition of texture-defined shapes. The difficulties in texture recognition have been interpreted as being caused by a specific deficit in the processing of visually presented textural stimuli in the absence of a contour recognition deficit. This suggests two different stages of processing: One involved in shape discrimination and another, different, process involved in textural region segregation.
CASE REPORT A.B., the patient, was a seventeen-y ear-old boy with eight years of formal education. In March 1991 he was admitted to the neurological ward after a severe head injury following a road accident. He scored eight on the Glasgow Coma Scale which increased to ten after fifteen days. Discharge diagnosis after two months was: “Severe cranio-encephalic trauma with temporal and parietal haemorragic focus.”
CT Scans He was submitted to a CT scan at one day post lesion and small high density areas were seen in the fronto-parietal-occipital regions on the left hemisphere and there was a deep fronto-temporal haemorragic focus on the left. At three
278
BATTELLI, CASCO, SARTORI
days post lesion the high density areas, revealed in the previous examination, were less evident.
EEG Recording of EEG at two months post lesion revealed bilateral slow wave activity in the temporo-parietal regions. Basic rhythm at 11c/s. At five months there were persisting bilateral anomalous waves in the temporo-parietal regions and, at seven months, slow and pointed waves in the temporo-parietal regions.
BASIC NEUROPSYCHOLOGICAL ASSESSMENT A formal neuropsychological investigation was performed 11 months post lesion. At the time of testing the patient was disoriented in space and time. He had lowered verbal fluency and his behaviour was mildly disinhibited.
Intelligence Tests Performance on Raven’s Coloured Matrices was 80, indicating non-verbal intelligence level in the lower normal range. This result also shows that form discrimination and analysis can be accomplished at a satisfactory level, with stimuli defined by brightness contours.
Visual Attention When required to search for a target number in a large set of similar digits (numbers different from the target; Attentive Matrices taken from Spinnler & Tognoni, 1987), A.B.’s performance did not significantly differ from that of age-matched control subjects. He scored 46 out of 60 (z = – 1.1, relative to 10 age-matched controls). Performance in line bisection was good, with no signs of visual neglect.
Language Tests Verbal Naming Test. A.B. performed various tasks requiring naming to verbal description. A total of 36 items were used; A.B. scored 20/36 correct. One interesting aspect of these results was that when required to produce a name corresponding to a functional/encyclopaedic description of the item his performance was worse relative to naming from a visual description of the item. Performance in each task relative to 15 age-matched control subjects was: Functional/encyclopaedic description 2/8, z = – 3.6; visual description, 4/8, z = – 1.8; concrete description 7/10, z = 2.2; and abstract description 7/10, z = – 1.7. For example, when required to name “which animal lives in the pond and makes big jumps?”, he answered “kangaroo”. The verbal/visual percentage
AGNOSIA FOR TEXTURE
279
correct ratio was 0.5 for A.B. and 1 for controls. Data on picture naming will be reported in the next section. The results of naming from verbal description signalled a mild naming disorder but, more important for our investigation, his knowledge of visual appearance of the stimuli did not have any major impairment at least when compared to other cognitive functions.
Reading. Single word and non-word reading was tested, yielding a score of 15/15 correct.
Memory Tests Short-termMemory. A.B. was impaired on both auditory digit span (2) and word span on a verbal repetition task (2). When required to repeat complex sentences he succeeded in 2/3. Long-term Memory. In a free recall task of 3 lists of 10 words each he scored 14/30, z = – 1.1 relative to 53 controls, while in prose memory (recalling a short story) his performance was 3/27 (z = – 2.8, relative to 53 controls). Paired associated words (30 items) learning was only mildly impaired (absolute score was 11/22.5, z = – 0.9, relative to 53 age-matched controls). Taken together, the results of the basic neuropsychological assessment show that A.B. was only slightly impaired in many tasks testing attention, language, and memory functions. This is quite a typical outcome of moderate traumatic head injury, with a Glasgow Coma Scale (GCS) of around eight; such patients may often present with mild disorders of attention, episodic memory, and naming; from this point of view A.B. did not show any selective deficit.
SENSORY TESTS Visual Acuity Visual acuity for each eye was measured with the Snellen letter chart. A.B. had an acuity of 10/10 in each eye without corrective glasses. A.B. was also measured by defining the minimum separation between two lines. A.B. could distinguish the separation between two lines 1.05 ¢ apart from each other and his performance did not differ from that of an age-matched subject with normal visual acuity. Contrast sensitivity was evaluated with the Maione–Maffei test (Linea Oftalmologica Angeli) for spatial frequencies of 0.66, 1.5, 3, 6, 12, 24, 48 cycles/degree. The results of A.B. and of an age-matched control subject (L.B.) are shown in Figure 1. A.B.’s performance differed little from the control. Sensory tests did not show any visual field reduction.
FIG. 1. The result of the contrast sensitivity tests. The corresponding values are: (1) 0.66 cycles/deg; (2) 1.5 cycles/deg; (3) 3 cycles/deg; (4) 6 cycles/deg; (5) 12 cycles/deg; (6) 24 cycles/deg; (7) 48 cycles/deg.
280
AGNOSIA FOR TEXTURE
281
Eye Movements Recordings were made using an infrared device while A.B. moved his eyes from a central fixation cross to a stimulus randomly presented either to the right or to the left of 5 or 10° eccentricity for 500ms. Figure 2 shows that the mean amount of overshooting (that is the difference between target eccentricity and saccadic endpoint position) is equal to 1.2° for A.B. and to 0.9° for the control subject. Moreover, percentage of direction errors (Figure 3) in the left vs. right direction are very low for both A.B. and the normal subject. A.B.’s overshooting was not significantly greater than that of the control.
Motion Detection In this test, observers had to detect the direction of motion of a small bright spot. On each trial the stimulus was a bright spot presented twice in different positions on a dim background. The interval between the two images was 20ms. The duration of each image was 20ms. Spot diameter was 0.8 arc min. The stimulus was presented on a computer monitor screen and viewed in the dark. Over a run of 90 trials the distance between the two spots was varied randomly from trial to trial, across five levels (1, 2, 3, and 4 arc min) for each of the two displacement directions. The subject was instructed to look at the central region of the screen and he was required to detect the right vs. left direction of motion of a bright spot presented in that region. The percentage of correct responses
FIG. 2. Eye movement amplitudes. The figure shows the mean amount of overshooting, defined as the error in the displacement towards an eccentric target (either 5 or 10° eccentricity) for A.B. and an age-matched control subject (G.L.). The bars in the figure represent standard deviation.
282
BATTELLI, CASCO, SARTORI
FIG. 3. Eye movement directions. The figure presents the percentage of times that a saccadic eye movement was made in the direction (left or right with respect to the fixation point) opposite to that of the stimulus direction.
as a function of the distance between the pair of spots is shown for two subjects, A.B. and the age-matched control L.B. in Figure 4. The performance of A.B. did not differ from that of the control subject. In all the above reported tests, A.B.’s performance did not differ from that of normal subjects. Although A.B.’s sensory functions were only investigated within a restricted range of spatio-temporal parameters, the results suggest that basic visual sensory processes are unaffected.
VISUAL TESTS REQUIRING FORM PROCESSING These tests aimed at investigating A.B.’s capacity to recognize and reproduce simple shapes.
Efron Test A.B. was presented with black geometrical shapes on a white background (Efron, 1968). The shapes were squares and oblongs that were matched for their surface area equated for total flux (see Figure 5).
Task 1. Ten squares were used with side of different sizes (2.6, 2.8, 3.0, 3.2, 3.4, 3.8, 4.2, 5.0, 5.8, 6.2°) presented in pairs. The difference in size within a pair varied according to seven levels of difference (0.0, 0.2, 0.4, 0.6, 0.8, 1.0,
FIG. 4. The test of the perception of the direction of motion. Performance in detecting the direction of apparent motion of a dot presented in a two frames sequence as a function of the displacement of the dot from frame to frame. Percentage of correct responses increases as the displacement increases in the same way for A.B. and an age-matched control subject (L.B.).
FIG. 5. Results from Efron shape test. The percentage of correct responses under two task conditions: (1) striped bars: Same/different judgements of two adjacent black shapes; (2) dotted bars; Naming of a single black shape (square or rectangle).
283
284
BATTELLI, CASCO, SARTORI
1.2°). Each pair was presented once except for the 0.0 difference, which was repeated twice. In total, 12 stimuli were presented. The subject had to perform a same/different matching task.
Task 2. Six squares and six oblongs were presented singly in pseudorandom order. The six squares’ sides were: 4.0, 4.5, 5.0, 5.5, 6.0, 7.0° and the six oblongs’ dimensions were: 3.25 ×3.5, 5.0 × 5.5, 5.0 × 6.5, 6.5 ×7.75 , 7 × 7.5, 6.5 ×9.0°. On each trial the subject was required to judge whether the presented shape was a square one or an oblong. A.B.’s performance in this shape recognition test was 75% and 83% correct in tasks 1 and 2 respectively, two control’s performance was 81% and 91% (SD = 0.7 and 0.0), in tasks 1 and 2 respectively.
Copy of Drawings We assessed A.B.’s ability to perceive basic properties of shapes in a copying task. As Figure 6 shows, A.B. produced relatively good copies of a variety of both 2D and 3D drawings.
Letter-form Recognition The observer’s task was to find one symbol (either a letter or a shape) randomly presented in a background of a set of similar elements presented on white cards. Six different shape pairs were used. If viewing time was long enough, A.B. could easily detect all present targets. However, as Figure 7 shows, whereas no errors were made on some simple configurations, a certain number of false positives were produced (in the pairs U/O, U/V, I/H, E/H, and X/N). Controls’ performance was 100% correct in this task. In these experiments we have seen that the patient was able to recognize and reproduce simple visual forms satisfactorily. The following set of tests were administered to investigate a higher level perceptual task involving object recognition.
Object Naming A.B. was given a set of 64 pictures to name taken from Snodgrass and Vanderwart (1980). The pictures were line drawings drawn from categories of stimulus in which there were either many exemplars with similar perceptual structures (mainly from biological categories) and with some stimuli with structurally dissimilar structures (mainly artefacts) (see Riddoch & Humphreys, 1987a).
AGNOSIA FOR TEXTURE
285
(a)
(b)
FIG. 6. A.B.’s copy of drawings (a) and the originals (b).
The patient was unable to name aloud many visually presented pictures. He named correctly 25/64 (z = –56.8), performance of eight age-matched control subjects was 63.1/64, with a standard deviation of 0.67. A.B.’s performance in picture naming is greatly impaired when compared to his ability to name from a verbal description. Half of the visual shapes in the verbal description task were the same of those used in picture naming, and, when compared with the same items in object naming, performance was better at naming to the descrip2 tion (12/18 vs. 3/18; McNemar test of change, c = 10.5, p < 0.001) indicating a form of visual impairment. This cannot be attributed to a low level visual processing problem, as we have already shown previously.
286
BATTELLI, CASCO, SARTORI
FIG. 7. Letter-form recognition test. The figure shows the number of times a non-target was marked as a target. Errors occurred in the configurations U/O, U/V, I/H, E/H, E/N but not in – / =, ‘’/ ‘, o/ ‘, T/I.
Matching of Visual Knowledge In the matching of visual knowledge task the subject was asked to match one incomplete part of an animal with four examples of the missing parts each belonging to a different animal, for example, the subject had to match the body of a horse with no tail, with four different tails of a pig, of a dog, of a cow, and of a horse. The stimuli were presented one at a time to A.B., who was told to point to the appropriate part for each body. A.B. made 11/16 (z = – 5) correct responses (chance level = 4/16; mean score of 10 age-matched controls was 15/16, SD = 0.7).
Gollin Test This test consists of a graded series of incomplete line drawings of common objects (Gollin, 1960). A very fragmented version of the drawing was initially presented, and the subject was asked to identify it. If the response was incorrect, increasingly complete versions of the drawing were presented until the object was identified. A.B. scored 55/150 (z = – 67.5). His performance was severely impaired; 10 age-matched control subjects performed almost perfectly on this task with a mean score of 149.5/150, SD = 1.4.
Drawing from Memory A.B. was asked to draw a set of five objects from memory. This set included insects (fly, spider) and complex objects (bicycle, motorbike, and ball).
AGNOSIA FOR TEXTURE
287
Examples are given in Figure 8, A.B.’s drawings are very good compared to those of a control subject, suggesting that he has intact stored visual knowledge about at least some objects.
Discussion The results from the tests requiring the processing of visual forms from brightness contours indicates that A.B. is able to discriminate simple forms, whereas he is greatly impaired in object naming. His performance on tasks which did not require naming (drawing from memory, matching of visual (a)
(b)
FIG. 8. (a) A.B.’s drawings from memory (fly, spider, bicycle, motorbike, and ball), and (b) the same drawings from memory carried out by a control subject (C.P.).
288
BATTELLI, CASCO, SARTORI
knowledge) do not clearly show if A.B. was able to access stored visual knowledge normally but at least his drawing from memory and naming to verbal description give evidence of some preserved visual knowledge about objects. In the following experiments, we only used stimuli recognizable by A.B. and tasks he was able to perform. Impaired performance in the Gollin test could be due to an impairment in grouping individual short line segments together. Such a disorder can depend on a deficit in “integrative operations” (Riddoch & Humphreys, 1987a) or in texture perception (Vaina, 1990). The integrative agnosic patient described by Riddoch and Humphreys (1987a) was unable to recognize line drawings and he was also impaired at segmenting overlapping figures defined by brightness contours. We presented A.B. with a test selected to analyse his ability to integrate different parts into a global configuration.
Perceptual Segregation of Overlapping Figures The contour shape association task consisted of 24 trials in which A.B. was required to match overlapping geometrical shape contours with the proper isolated shapes. The task was to observe the isolated shapes and find the intersection between them when they overlapped. The overlapping shapes varied randomly with respect to the proper isolated shapes in both size and orientation (Figure 9). In different conditions the number of overlapping contour shapes varied according to four levels (2, 3, 4, 5). For instance in level 4, two squares, one circle, and one triangle overlapped. For each level, five different overlapping configurations were used and reaction times were measured. Figure 10 shows the percentage of correct intersections detected independently for each level and for two observers (A.B. and E.P., an age-matched control). The mean reaction times for A.B. and the control were: 2.6, 7.5, 13.2, 20.2 sec and 1.6, 4.4, 7.7, 9.0 sec respectively, for levels 1, 2, 3, and 4. These results indicate that A.B. was able to segregate up to five overlapping shapes although his response time was slower than the control subject. A control experiment was run to establish whether A.B. was generally slow or whether his slow response times were specific to the task. To choose between these two possibilities we have recorded reaction times in a matching task with non-overlapping version of the shapes. Mean reaction times for three independent levels (3, 4, and 5 shapes) were: 7.0, 10.0, 18.7 and 2.7, 7.6, 17.0 for A.B. and the age-matched control subject respectively. The ratio between the response time with overlapping and non-overlapping version is similar for A.B. (1.09) and the control (1.01). Therefore A.B. seems able to perform a task with overlapping figures, considered to require global integration of parts, that is difficult for integrative agnosic patients (Riddoch & Humphreys, 1987a).
FIG. 9. Two examples of the shapes to be matched. The overlapping geometrical shape contours and the proper isolated shapes are shown for each.
FIG. 10. Perceptual segregation of overlapping figures.
289
290
BATTELLI, CASCO, SARTORI
Conclusions The experiments reported in this section provide evidence that not only visual sensory processes but also the global processing of brightness contour is carried out normally in A.B. This preservation of detailed and global analysis of shape will be contrasted in the next section with an impaired processing of textural elements.
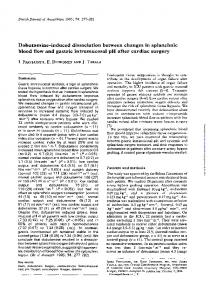
EXPERIMENTAL INVESTIGATION OF TEXTURAL PROCESSING We suspected an impairment in texture processing when A.B. was asked to name visually presented textures (Figure 11) with no global contour cues (there were black and white photos of texture-defined stimuli; e.g. human skin, wool, animal fur). In this task he scored 3/12; six age-matched control subjects scored mean 11.1/12, with an SD of 0.4. To test A.B.’s ability to perceive textures more formally, he was submitted to some preliminary evaluations followed by a number of psychophysical experiments.
Texture–Semantic Association Three Textures to One Object Match. The task consisted of 18 trials in which A.B. had to match the image of three visual textures with no global contour cues to one object picture (without texture) (e.g. he was presented with the texture of hair, wool, and straw and the target was the shape of a jumper) (Figure 12). A.B. scored 17% correct. Three Objects to One Texture Match. The test consisted of 12 trials in which the observer was asked to match three objects (shown without textures) to one visual textured region with no global contours cues. A.B. scored 33% correct. In both these tests the performance of six normal subjects was at ceiling while A.B. performed at chance.
Tactile Texture Discrimination In this experiment, tasks requiring tactile texture discrimination were administered to establish whether textural access to semantic knowledge was generalized or specific to visual presentations. The tactile discrimination task consisted of matching one tactile texture with no global contour cues to three real objects. For example the subject had to perform a tactile exploration of a proper surface with closed eyes. After that he saw the contour shape of three objects (a book, a leaf, a carpet) and he had to match it to the appropriate object touched before. A.B. performed 18/18 correct.
AGNOSIA FOR TEXTURE
291
FIG. 11. Photograph of wood, representing natural texture with no contours.
Discussion The results of the tests carried out on texture processing are quite clear. A.B. is able to match tactile textures to the appropriate object but he is not able to match visual textures to the appropriate object. We attempted to confirm the hypothesis of a specific deficit in texture processing. Texture perception has at least two components. The first one is the detection of local structure by means of local comparison strategies, and the other is a global process involving simultaneous grouping of all elements in the texture
292
BATTELLI, CASCO, SARTORI
FIG. 12. One object (chair) to three textures (hair, wool, chair) match.
(Beck, 1972; Julesz, 1981). Rentschler, Treutwein, and Landis (1994) showed a dissociation of local and global processing in texture perception. They studied two patients, a prosopagnosic and an alexic. The first patient had no problem with seeing texture elements when presented in isolation, but was selectively impaired in texture discrimination and the authors concluded that she suffered from a selective loss of global visual perception. The alexic patient performed well with global perception of patterns made of dots (texture discrimination) but she was impaired in perceiving local texture elements. They argued that she could locally and globally process patterns composed of simple figural elements but failed with stimuli that required the integration of features. The question is whether this dissociation is also present in A.B. A.B. was then submitted to a detailed set of visual tasks to test the underlying mechanism of shape perception and recognition based on textural properties.
Experiment 1: Texture Segregation Based on Local Properties The first experiment tests texture segregation based on local properties, that is on the differences in colour, curvature, and contour which distinguish a target from background elements.
AGNOSIA FOR TEXTURE
293
Method. Stimulus generation and presentation, timing and data collection were controlled by an IBM PC AT compatible. Stimuli were presented on the PC monitor (NEC multi sync). The stimuli consisted of various geometrical shapes regularly arranged within a constant stimulus area which subtended 4.2 ×4.2°. Within a stimulus area the number of elements varied in independent condition, according to four levels (16, 36, 64, and 100). The width and height of single elements was in the range of 0.2 to 0.3°. The elements were positioned so as to be aligned along a virtual line. Inter-element distance was constant within each trial and was equal to 0.3, 0.5, 1.0 and 2.0° in the 100, 64, 36 and 16 element conditions, respectively. On each trial the fixation cross appeared at the centre of the display for 1200ms and was followed, after a 1000ms interval, by the display. The display remained on until the subject responded. Feedback was presented after wrong responses in the form of an auditory “bip”. This was followed by a 200ms interval. The viewing distance was 114cm. The subject had to press one of two alternative keys of the keyboard after each trial, according to whether the target was present or not. Within a block, ten trials were devoted to each of the four levels of background numerosity, for both target present and target absent conditions. The total number of 80 stimuli (repetitions of 20 stimuli for 4 display sizes) were presented in random order. At the beginning of the experiment 20 practice trials were presented. A.B.’s performance was compared with that of an age-matched control.
Experiment 1a: Search for Single Features Search for Colour . The target was a green square (12 ¢ × 12¢ ) and the background items were red squares of the same size. Search for Orientation. Target and background were both line segments 18¢ long, 45° apart in orientation. Search for Curvature. The target was a circle with a diameter (13.8 ¢ ) approximately equal to the background squares (sides 12 ¢ ). Results. The results are shown in Figure 13. In all the stimulus conditions A.B.’s response times were slower than the control (see Table 1). For both subjects (A.B. and age-matched N.N.), search time on present trials was independent of the number of background elements, though there were increases in latencies with the number of distractors on absent trials.
FIG. 13. Simple visual search for three stimulus conditions: colour feature, orientation, contour (a) target present and (b) target absent.
294
AGNOSIA FOR TEXTURE
295
TABLE 1 Mean Reaction Times, Slopes, and Intercepts on Experiment 1. Texture Segregation Based on Local Properties (Experiment 1a and Experiment 1b) A.B.
N.N.
—–———————— Simple search Colour Mean RT Slope Intercept Orientation Mean RT Slope Intercept Curvature Mean RT Slope Intercept Conjunction search Contours and colour Mean RT Slope Intercept Colour and orientation Mean RT Slope Intercept
—–—————————
Present
Absent
Present
Absent
624 0.5 650
681 –2.3 809
498 0.0 494
523 0.4 500
861 0.1 868
1254 0.5 1281
560 0.37 539
603 1.59 517
905 2.8 1061
1156 5.7 847
524 0.2 538
547 0.17 537
1600 19.0 572
2085 8.5 1628
1138 13.0 399
1715 19.0 678
2140 20.5 1057
2963 6.0 2691
936 9.0 856
2184 21.0 1068
Experiment 1b: Search for Conjunctions of Features Search for Contours and Colour. Half of the distractors were red squares and half green circles. The target was a green square. Search for Conjunction: Colour and Orientation. Half of the distractors were green line segments tilted right and half red line segments tilted left. The target was a green line tilted left. Results. The results show that reaction times increased with the number of distractors for both A.B. and for the age-matched control subject and more in the absent than in the present condition (Figure 14). One general characteristic of A.B.’s search functions was that they all show an intercept which was much higher than that of the normal subject. Moreover,
FIG. 14. Search for feature conjunction targets, (a) target present and (b) target absent.
296
AGNOSIA FOR TEXTURE
297
in conjunction tasks, the slopes for present responses for A.B. were steeper than those of the control subject, while those for absent responses were flatter (see Table 2). The slope ratio for present to absent responses was approximately 1:2 for the control and 2:1 for A.B. From Table 2 it appears that A.B. made almost no errors on absent responses and few errors on present trials. By comparing reaction times and error data together, it appears that, at least with the largest displays, conjunction search is exhaustive. The difference between yes and no responses, at small display sizes, cannot be interpreted as evidence of a self-terminating search strategy because the slope for absent responses is very small. Therefore taken all together the conjunction search data suggest that A.B. has a conservative response criterion (so that he waits for a longer time before responding absent) even with small display sizes. Recent electrophysiological studies (Luck & Hillyard, 1990) have suggested that differences in ERP scalp distributions indicate that different physiological processes are utilized for the detection of feature presence and absence. Luck and Hillyard found that the maximum ERP for feature present responses was sited over the occipital lobe, while the maximum for feature absent responses was sited over the parietal lobes. A.B.’s performance could be in accordance with the electrophysiological studies previously reported and his pattern of results in target absent conditions could depend on the parietal involvement caused by the lesion. It is however interesting that the search for conjunction targets is particularly difficult with small displays. The global shape of the display is easily perceived with small displays. This may interfere with the search task by reducing figure (target) to background (non-target) segregation (Duncan & Humphreys, 1989).
Experiment 2: Grouping of Local Features of Textural Elements We followed the method used by many authors (Beck, 1972; Julesz, 1981; Julesz & Bergen, 1983) to assess effortless texture segregation on the basis of textural properties alone. According to this logic, simultaneous processing of features at all positions in the visual field can be carried out by effortless segregation of texture-defined shapes from a background of a very large number of different textural elements. Experiment 2a: Groupings of Shorter Line Segments and Smaller Size Circles
Experiment 2 investigated A.B.’s ability to segregate a subregion defined by elements of different size from those in the background.
Method. Stimuli were computer generated and laser printed with black ink on white cards. The task was to detect the location (top or bottom) position of
298 Absent
Present
Absent
16 0 0
Conjunction search Contours/colour Colour/orientation
36 0 0
36 0 1 0
64 4 3
64 1 0 3 100 4 3
100 0 0 1 16 0 1
16 0 1 0 36 0 0
36 0 0 0 64 0 1
64 1 0 0 100 0 0
100 0 1 0 16 0 0
16 0 0 1 36 2 0
36 0 0 0 64 2 2
64 0 0 0
100 0 2
100 1 0 0
16 0 0
16 0 1 0
36 0 0
36 0 0 0
64 0 0
64 0 0 0
100 0 0
100 0 0 0
——————————————–—————————————————————————————————————————————————
16 0 1 0
Simple search Colour Orientation Curvature
———————————————————————————————————————————————————————————————————————–
Present
N.N.
——–————————————————————————
A.B.
——————————————————————————
—————————————————————————————————————————————————————————————–——
TABLE 2 Error Data on Texture Segregation Based on Local Properties (Experiment 1a and Experiment 1b)
AGNOSIA FOR TEXTURE
299
a squared subregion containing either lines shorter than those in the background or circles of smaller size than those in the background. The dimensions of the background elements were fixed (10.2 ¢ for the lines and 9 ¢ for the circle diameter), whereas that of the target elements varied in independent conditions according to four levels of line length (10.2 ¢ , 9 ¢ , 7.8¢ , 6.6 ¢ ) and four levels of circle diameter (9 ¢ , 7.9 ¢ , 6.8 ¢ , 5.7 ¢ ). Three trials were devoted to each target level and each target area position. The total number of 24 stimuli were manually presented in a random order. The viewing distance was 114cm and the exposure time was unlimited. A.B.’s performance was contrasted with a group of eight age-matched control subjects.
Results. The percentage of correct responses for A.B. and the eight agematched controls in both tasks are reported in Figures 15 and 16 respectively. A.B.’s performance was at chance level in all but the condition of highest difference in linear element length (3.6¢ ) and the highest difference between target and background diameter (3.3 ¢ ). Experiment 2b: Detection of Single Items’ Difference
Although A.B.’s visual acuity was good, Warrington (1985) has shown that performance in single items comparisons cannot be directly predicted on the basis of acuity tests. To establish whether A.B. presents difficulty in detecting differences between pairs of stimuli singly presented, in Experiment 2b we measured A.B.’s performance in a task in which he had to compare the size of two elements, belonging to the target and background subset. Presentation, method, size of target, background element, experimental procedure, and viewing conditions were the same as Experiment 2a. The two (target and background) elements were presented 1° apart from the fixation mark either on the left or on the right. The task was to report whether the larger size stimulus (either the longer line or the larger circle) was on the left or on the right.
Results. As Figures 17 and 18 show, A.B. made no errors in this task. Results show that he was able to perform a single-item discrimination test, thus he could discriminate the size differences used in the texture detection task. Discussion
One possibility is that, rather than using parallel grouping operations, A.B. executed the tasks in Experiment 2a on the basis of local serial comparisons. In this case, impaired performance could simply indicate difficulties in matching element pairs. Although this is unlikely because, as Experiment 2b shows, A.B. had no difficulties in detecting differences between individual pairs of stimuli of any of the sizes and lengths we used, a formal experiment was
FIG. 15.
Grouping of shorter line segments.
FIG. 16. Grouping of smaller size circles.
300
FIG. 17. Detection of differences between single items.
FIG. 18. The percentage of correct responses as a function of the differences in diameter between target and comparison circles.
301
302
BATTELLI, CASCO, SARTORI
conducted in which differences between target and background surfaces were not affected by visual acuity, because they were not defined by feature values but by statistical properties in the image.
Experiment 3: Texture Segregation Based on Statistical Properties in the Image These experiments aimed to test whether A.B.’s impaired performance in texture perception tasks depended on difficulties in matching element pairs, or on a deficit in the parallel grouping operations underlying texture perception. Experiment 3a: Detection of First Order Statistical Differences.
Method. Stimulus generation was the same as in Experiment 2b. The first order of complexity (Julesz, 1975) was manipulated by varying the mean number of dots (i.e. the mean density) in a comparison stimulus (CS) to that in a standard one (SS). The task was to detect the location (top or bottom) of the region with the higher dot density. Dot density of standard stimulus was fixed. Dot density difference between the two regions varied according to three levels: 0, 4, and 8 dots. Three trials were devoted to each density difference: The total number of 24 stimuli were presented in random order. The viewing distance was equal to 114cm and the exposure time was unlimited. A.B.’s performance was compared to that of a group of eight age-matched control subjects. Results. A.B.’s performance, expressed in Figure 19 as the percentage of correct responses as a function of the density level, is lower than age-matched control subjects in all conditions. Experiment 3b: Detection of Second Order Statistical Differences
Method. Stimuli were computer generated and laser printed with black ink on white cards. A trial consisted of a randomly generated pattern of distractor dots in the centre of which there was a vertical or horizontal virtual line composed by disconnected dots. The dots composing the line were equally spaced (interdot separation was equal to 1° and quasi-colinear). Deviation of colinearity was in the range of either plus or minus 4.2 arc min. The number of dots in the background varied in independent conditions across five levels to produce four different interdot spacings (1.15, 1.3, 1.45, 1.6, 1.75°) for both the vertical and the horizontal dotted line condition. Six trials were devoted to each background density level and each dotted-line orientation condition. Note that large differences between target and background dot spacings improve detectability. A total of 24 stimuli were presented in random order. The viewing
AGNOSIA FOR TEXTURE
FIG. 19.
303
First order statistics.
distance was 114cm and the exposure time was unlimited. Observers had to perform a two alternative forced-choice task in which they had to detect the horizontal vs. vertical orientation of the dotted target line.
Results. A.B.’s performance (Figure 20) was at chance level in all but the condition of largest difference between target and background interdots spacing. His performance was contrasted to that of eight age-matched control subjects. Discussion
It is interesting that in the task requiring detection of colinearity A.B. performed at chance level with an average difference in interdot spacing between target and background of 0.45°, many times larger than his resolution threshold. We conclude that A.B. is selectively impaired in the global operation underlying texture perception.
Experiment 4: Texture Segregation Based on Motion: Detection of Moving Textures In a final experiment, we assessed whether A.B.’s inability to process texture features simultaneously at all positions across the visual field occurs with moving, as well as with static, textures.
304
BATTELLI, CASCO, SARTORI
FIG. 20. Second order statistics
Method. The stimulus used in this test was the Random Dot Kinematogram (RDK): Four successive frames were presented in succession on a CRT screen (HP Model 1332A with a spot size of 0.02mm). The duration of each frame was 50msec with no delay between frames. Each of the four 0.24 ×1.4 stimulus areas contained 48 dots (average dot separation 3.95 ¢ ). The relative spatial position of 16/48 dots was fixed from frame to frame and all dots were displayed by the same amount from frame to frame. The density of the target area was equal to that of a corresponding area of the background. Over a run of 90 trials the stimulus displacement was randomly varied according to five levels (0, 5, 10, 15, 20 arc min) for both right and left displacement directions. The position of the dots in the surround was random and changed from frame to frame so as to make these dots move randomly in all directions. Observers were asked to report the movement direction of a group of dots that moved together against the randomly moving dots in the background. Within these displacements the observer perceived the central target area moving either left or right, according to the displacement direction. A.B.’s performance was compared with that of an age-matched control subject (L.M.). Results. The results are shown in Figure 21, where the percentage of correct responses are plotted as a function of the target area’s displacement from frame to frame, independently for A.B. and age-matched control subject. Whereas the number of correct responses increased as displacement decreased
AGNOSIA FOR TEXTURE
305
FIG. 21. Detection of moving texture (random dot kinematogram).
in the control subject, A.B.’s performance was at chance level in all but the smallest displacement condition. Discussion
In this task the average dot spacing (3.95 ¢ ) was large and A.B. could clearly resolve the dots, as is apparent from his performance in the smallest displacement condition which is above chance level. Since no local cues are available to detect the direction of motion of the dots in the target stimulus, these results clearly indicate a deficit in the global process underlying texture segregation with moving stimuli.
GENERAL DISCUSSION The primary intention of the present study was to attempt an understanding of A.B.’s visual difficulties, which consist of a major impairment in visual texture segregation. A.B. can identify a brightness-defined form when confronted with a similar one (Efron: task 2), when the comparison is based on shapes’ contours; in contrast his ability to detect a target texture (to discriminate the higher dot density between two textural regions) when compared with a similar one is markedly impaired (see Experiment 3a). Since contrast sensitivity is normal, we suggest that A.B. presents a clear asymmetry between contour-based and texture-based discrimination, the nature of which was the main focus of our experimental investigation.
306
BATTELLI, CASCO, SARTORI
A.B. has intact low level visual processing as shown by the tests on visual acuity and contrast sensitivity function, on eye movement measurements, and on measures of his ability to detect the apparent motion. In all these tests A.B.’s performance did not substantially differ from that of a control subject with normal visual acuity. This suggests that A.B.’s deficits in texture segregation are not due to a processing deficit at a level of elementary visual perception. A number of experiments were conducted to investigate the impaired level of visual textural processing. Theories such as those proposed by Beck et al. (1983) and Julesz (1981, 1986) describe how texture perception involves the extraction of features (textons) by means of low level units, like V1 simple cells, which act as spatial filters of centre-surround type. Similarly, computational theories also assume filtering by receptive fields. In addition however, these theories address the question of how texture boundaries are formed (Malik & Perona, 1990) by means of a global evaluation of resulting neural activities via an associative network. A dissociation between global and local processing has been shown in a single case study by Rentschler et al. (1994). A.B. also presents this dissociation, as local feature analysis was not impaired. This is evident from the results of visual search tasks for simple features (colour, orientation, and contours) as well as search for conjunction of features (either conjunction of contours and colour or conjunction of colour and orientation). In these tests, A.B.’s performance is similar to that of normals, indicating that, in the present conditions, he uses the same strategy as a normal subject in performing the visual search task. On the other hand, results from Experiments 2a, 3a, 3b, and 4 clearly show that A.B.’s performance was strongly impaired in visual processing involving segregation of texture-defined shapes based on the grouping of local texture features. This appears in A.B’s. results in several tasks. First, A.B.’s performance was degraded in tasks involving the detection of top vs. bottom position of a subregion of either shorter line segments or smaller circles with respect to those in the background. The percentage of correct responses as a function of size difference between target and background elements was at chance level at all but the level of largest size difference for both line and circle configurations (see Figures 15 and 16). This indicates that A.B. could not segregate texture-defined shapes on the basis of grouping of local texture features. Second, A.B. also failed in all tests requiring texture segregation based on statistical properties. This is true for the tasks involving detection of the left vs. right position of a region of higher dot density as well as for the task involving detection of vertical vs. horizontal tilt of a virtual dotted line embedded in a background of similar dots. In both of these tasks A.B.’s performance was at chance level in all but in the condition of the highest signal to noise ratio at which local cues could be used. Note that, with a high signal to noise ratio, in these tasks local cues can be used. Indeed, in both experiments, when the density difference between the target and the background is very large, the luminance difference between the
AGNOSIA FOR TEXTURE
307
target and the background can be detected before the global processing of the element configuration. This difference in luminance can provide local cues which can be used by the visual system to execute the task. Finally, A.B.’s performance was impaired on the random kinematogram technique (in Experiment 4), when texture segregation was based on local motion integration. In this stimulus, the form was not apparent in each static frame since it was defined solely by the common motion of its elements. A.B.’s performance was at chance level in all but the smallest displacement condition (see Figure 21). Altogether these findings support the hypothesis that A.B. suffers from a deficit in global processing of texture elements while local processing is not impaired. Indeed, one interesting aspect of A.B.’s results in all the texture segregation tests is that, in the stimulus conditions in which the difference between target and background was very large (at least three times larger than A.B.’s visual acuity threshold), the task could be executed on the basis of local rather than global cues. On the other hand, a global processing mechanism, responsible for textured-region segregation, which operates on spatial distribution cues such as the local density, orientation structure, and distance apart of visual elements, is markedly impaired inA.B. As Rentschler etal. (1994)pointed out, models of visual processing cannot avoid the assumption of local receptive-field type filtering and subsequent global evaluation of the filter response. This concept is consistent with the dissociation of local and global processing in A.B., where local filtering seems intact but global evaluation is impaired. Another important result of the present study is that A.B.’s performance was not impaired in several tasks involving global shape processing. For example, shape discrimination (the Efron test), form/letter recognition, search for conjunction of features, the ability to identify an object among several overlapping and simultaneously presented objects, and the matching task with nonoverlapping shapes were not impaired. This clearly indicates A.B.’s ability to discriminate geometrical shapes on the basis of contour integration. However, despite the fact that A.B. can process shapes accurately, he is impaired at naming visually presented pictures. This impairment is not due to a loss of visual stored knowledge about the presented item. In fact A.B. can access such visual knowledge when asked questions probing the visual attributes of objects and he can use such visual knowledge to guide drawing from memory (Farah, 1984; Riddoch & Humphreys, 1987b; Sartori & Job, 1988). From such results we may conclude that A.B. seems to have a problem in accessing stored knowledge from vision and this causes his impairment in naming. However, this impairment is subsequent to the global integration of parts, as demonstrated in matching tasks. A.B. provides evidence for a dissociation between the integration processes as involved in texture analysis and those involved in integrating contours. This is the opposite dissociation to that described by Abadi et al. (1981). Their patient
308
BATTELLI, CASCO, SARTORI
(R.C.) had severe difficulty in recognizing any common object encountered in daily life. In contrast, he was able to locate objects and comment on their texture and colour. To conclude, this single case study shows that at least two processing stages involved in shape recognition are intact in A.B., namely the processing of local geometric features and global shape recognition based on contour cues (Humphreys & Riddoch, 1987b). On the other hand, texture segregation based on global processing of local elements is impaired, so that shape recognition based on texture segregation cannot be achieved. From this we may distinguish between single and multiple coding of shape contours. One possibility is that contours are coded separately, but in a very similar way when they are defined by luminance, colour, texture, motion, etc. Another possibility is that contours are coded in a final common representation, irrespective of how they are defined. A.B.’s dissociation strongly supports the first possibility. A.B.’s ability to identify the shape contours defined by luminance but not by texture and motion is in agreement with the model of feature coding proposed by Cavanagh et al. (1990), according to which object contours are signalled by discontinuities in luminance, colour, and texture. The contours defined by these different media are analysed by different modules or pathways. These different representations have two levels: First order (colour and luminance) and second order (texture and relative motion). A.B. seems impaired at second order processing of the features making contours. As a final point, it could be interesting to relate our findings to recent psychophysical theories of normal vision. In many recent works (Cavanagh et al., 1990; He & Nakayama, 1994) it has been pointed out that global operations in texture segregation occur at a processing stage that is (1) higher than feature analysis carried out by the activation of spatial filters of centre-surround type, and (2) lower than the operations at which the final representation underlying object recognition occurs (Cavanagh et al., 1990; Treisman & Gormican, 1988). To conclude, our results support this view and indicate that the neural basis of size and orientation coding with luminance defined stimuli is separate from that on which features coding with texture defined contours is based.
REFERENCES Abadi, R.V., Kulikowski, J.J., & Meudell, P. (1981) Visual performance in a case of visual agnosia. In M.V. Van Hoff & E. Mohn (Eds.), Functional recovery from brain damage. Amsterdam: Elsevier. Allman, J.M., & Kaas, J.H. (1976) Representation of the visual field on the medial wall of occipital-parietal cortex in the owl monkey. Science, 191, 572 –575. Beck, J. (1972) Similarity grouping and peripheral discriminability under uncertainty. American Journal of Psychology, 85, 1 –19. Benson, D.F., & Greenberg, J.P. (1969) Visual form agnosia: A specific defect in visual discrimination. Archives of Neurology, Chicago, 35, 82 –89.
AGNOSIA FOR TEXTURE
309
Campion, J. (1987) Apperceptive agnosia: The specification and description of constructs. In G.W. Humphreys & M.J. Riddoch (Eds.), Visual object processing: A cognitive neuropsychological approach (pp. 197 –232). Hove, UK: Lawrence Erlbaum Associates Ltd. Cavanagh, P., Arguin, M., & Treisman, A. (1990) Effect of surface medium on visual search for orientation and size features. Journal of Experimental Psychology: Human Perception and Performance, 163, 479 –491. De Yoe, E.A., & Van Essen, D.C. (1988) Concurrent processing streams in monkey visual cortex. Trends in Neuroscience, 11, 219 –226. Duncan, J., & Humphreys, G.W. (1989) Visual search and stimulus similarity. Psychological Review, 96, 433 –458. Efron, R. (1968) What is visual perception? Boston Studies in Philosophy of Science, 4, 173. Farah, M. (1984) The neurological basis of mental imagery: A componential analysis. Cognition, 18, 241 –269. Gollin, E.S. (1960) Developmental studies of visual recognition of incomplete objects. Perceptual and Motor Skills, 11, 289 –298. He, Z,J., & Nakayama, K. (1994) Perceiving textures: Beyond filtering, Vision Research, 34(2), 151 –162. Humphreys, G.W., & Riddoch, M.J. (1984) Routes to objects constancy: Implications for neurological impairments of object constancy. Quarterly Journal of Experimental Psychology, 36A, 385 –415. Humphreys, G.W., & Riddoch, M.J. (1987a) The fractionation of visual agnosia. In G.W. Humphreys & M.J. Riddoch (Eds.), Visual object processing: Acognitive neuropsychological approach (pp. 281 –306). Hillsdale, NJ: Lawrence Erlbaum Associates Inc. Humphreys, G.W., & Riddoch, M.J. (1987b) To see but not to see: Acase study of visual agnosia. Hove, UK: Lawrence Erlbaum Associates Ltd. Julesz, B. (1981) Textons, the elements of texture perception, and their interactions. Nature, 290, 91 –97. Julesz, B. (1986) Textons gradients: The texton theory revisited. Biological Cybernetics, 54, 464 –469. Kertesz, A. (1987) The clinical spectrum and localisation of visual agnosia. In G.W. Humphreys & M.J. Riddoch (Eds.), Visual object processing: A cognitive neuropsychological approach (pp. 175 –191). Hillsdale, NJ: Lawrence Erlbaum Associates Inc. Lissauer, H. (1988) A case of visual agnosia with a contribution to theory (M. Jackson, trans.). Cognitive Neuropsychology, 5, 157 –192. (Original work published 1890) Luck, S.J., & Hillyard, S.A. (1990) Electrophysiological evidence for parallel and serial processing during visual search. Perception and Psychophysics, 48 (6), 603 –617. Malik, J., & Perona, P. (1990) Preattentive texture discrimination with early vision mechanisms. Journal of the Optical Society of America A, 7, 923 –932. Ratcliff, G., & Newcombe, F. (1982) Object recognition: Some deductions from the clinical evidence. In A.W. Ellis (Ed.), Normality and pathology in cognitive functions. London: Academic Press. Rentschler, I., Treutwein, B., & Landis, T. (1994) Dissociation of local and global processing in visual agnosia. Visual Research, 34(7), 963 –971. Riddoch, M.J., & Humphreys, G.W. (1987a) A case of integrative visual agnosia. Brain, 110, 1431 –1462. Riddoch, M.J., & Humphreys, G.W. (1987b) Visual object processing in optic aphasia: A case of semantic access agnosia. Cognitive Neuropsychology, 4, 131 –185. Sartori, G., & Job, R. (1988) The oyster with four legs: A neuropsychological study on the interaction of visual and semantic information. Cognitive Neuropsychology, 4, 105 –132. Snodgrass, J.G., & Vanderwart, M. (1980) A standardised set of 250 pictures: Norms for name agreement, image agreement, familiarity and visual complexity. Journal of Experimental Psychology: Human Perception and Performance, 6, 174 –215.
310
BATTELLI, CASCO, SARTORI
Spinnler, H., & Tognoni, G. (1987) Standardizzazione e Taratura Italiana di Test Neuropsicologici. The Italian Journal of Neurological Sciences, Suppl. 8. Treisman, A., & Gelade, G. (1980) A feature integration theory of attention. Cognitive Psychology, 12, 97 –136. Vaina, L.M. (1990) Common functional pathways for texture and form vision: A single case study. Synthese, 83, 93 –131. Van Essen, D.C., Anderson, C.H., & Felleman, D.J. (1992) Information processing in the primate visual system: An integrated system perspective. Science, 255, 419 –423. Van Essen, D.C., & Maunsell, J.H.R. (1983) Hierarchical organisation and functional streams in the visual cortex. Trends in Neuroscience, 6, 370 –375. Warrington, E.K. (1985) Agnosia: The impairment of object recognition. In P.J. Vinken, G.W. Bruyn, & H.L. Klawans (Eds.), Handbook of clinical neurology, Elsevier: Amsterdam. Warrington, E.K., & James, M. (1988) Visual apperceptive agnosia: A clinico-anatomical study of three cases. Cortex, 24, 13 –32.
Manuscript received 10 June 1995 Revised manuscript received 10 June 1996