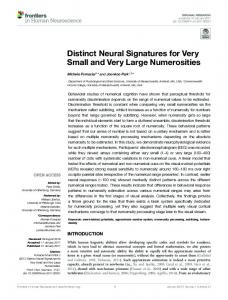
RESEARCH ARTICLE
Distinct and Shared Endophenotypes of Neural Substrates in Bipolar and Major Depressive Disorders Toshio Matsubara1,2, Koji Matsuo1*, Kenichiro Harada1, Masayuki Nakano1,3, Mami Nakashima1,4, Toshio Watanuki1, Kazuteru Egashira1,5, Matakazu Furukawa6, Naofumi Matsunaga6, Yoshifumi Watanabe1
a1111111111 a1111111111 a1111111111 a1111111111 a1111111111
1 Division of Neuropsychiatry, Department of Neuroscience, Yamaguchi University Graduate School of Medicine, Ube, Yamaguchi, Japan, 2 Health Service Center, Yamaguchi University Organization for University Education, Yamaguchi, Yamaguchi, Japan, 3 Katakura Hospital, Ube, Yamaguchi, Japan, 4 Nagato-ichinomiya Hospital, Shimonoseki, Yamaguchi, Japan, 5 Egashira Clinic, Kitakyusyu, Fukuoka, Japan, 6 Department of Radiology, Yamaguchi University Graduate School of Medicine, Ube, Yamaguchi, Japan *
[email protected]
Abstract OPEN ACCESS Citation: Matsubara T, Matsuo K, Harada K, Nakano M, Nakashima M, Watanuki T, et al. (2016) Distinct and Shared Endophenotypes of Neural Substrates in Bipolar and Major Depressive Disorders. PLoS ONE 11(12): e0168493. doi:10.1371/journal.pone.0168493 Editor: Huiguang He, Chinese Academy of Sciences, CHINA Received: July 8, 2016 Accepted: November 30, 2016 Published: December 28, 2016 Copyright: © 2016 Matsubara et al. This is an open access article distributed under the terms of the Creative Commons Attribution License, which permits unrestricted use, distribution, and reproduction in any medium, provided the original author and source are credited.
Little is known about disorder-specific biomarkers of bipolar disorder (BD) and major depressive disorder (MDD). Our aim was to determine a neural substrate that could be used to distinguish BD from MDD. Our study included a BD group (10 patients with BD, 10 firstdegree relatives (FDRs) of individuals with BD), MDD group (17 patients with MDD, 17 FDRs of individuals with MDD), and 27 healthy individuals. Structural and functional brain abnormalities were evaluated by voxel-based morphometry and a trail making test (TMT), respectively. The BD group showed a significant main effect of diagnosis in the gray matter (GM) volume of the anterior cingulate cortex (ACC; p = 0.01) and left insula (p < 0.01). FDRs of individuals with BD showed significantly smaller left ACC GM volume than healthy subjects (p < 0.01), and patients with BD showed significantly smaller ACC (p < 0.01) and left insular GM volume (p < 0.01) than healthy subjects. The MDD group showed a tendency toward a main effect of diagnosis in the right and left insular GM volume. The BD group showed a significantly inverse correlation between the left insular GM volume and TMT-A scores (p < 0.05). Our results suggest that the ACC volume could be a distinct endophenotype of BD, while the insular volume could be a shared BD and MDD endophenotype. Moreover, the insula could be associated with cognitive decline and poor outcome in BD.
Data Availability Statement: All relevant data are within the paper. Funding: This work was supported by JSPS KAKENHI (https://www.jsps.go.jp/j-grantsinaid/) with grant numbers 24591716 ,15K09832, 25861011, 25861012, and a Grant-in-Aid for Scientific Research on Innovative Areas (Comprehensive Brain Science Network) from the Ministry of Education, Science, Sports and Culture of Japan. A part of this study contained results of “Integrated Research on Neuropsychiatric
Introduction Differentiating between a diagnosis of bipolar disorder (BD) and major depressive disorder (MDD) is of clinical importance, as 69% of individuals with BD are misdiagnosed with MDD [1]. These errors cause harmful consequences for patients with BD, such as inappropriate medication prescription, drug-induced switching of the mood phase, and a poor prognosis. Although
PLOS ONE | DOI:10.1371/journal.pone.0168493 December 28, 2016
1 / 16
Neural Substrates of Mood Disorders
Disorders” carried out under the Strategic Research Program for Brain Sciences by the Ministry of Education, Culture, Sports, Science and Technology of Japan. The funders had no role in study design, data collection and analysis, decision to publish, or preparation of the manuscript. Competing Interests: The authors have declared that no competing interests exist.
empirical markers that could allow these two disorders to be distinguished are desired, the biological mechanisms that would underlie such markers remain unknown. Accumulating evidence from neuroimaging studies suggests that patients with BD and MDD show reduced brain volume and altered brain metabolism in regions related to emotional and cognitive processing, such as the orbital, inferior, medial, and dorsolateral prefrontal cortex, as well as in subcortical regions involving the hippocampal/amygdala complex and the striatum [2–9]. For instance, meta-analysis studies of voxel-based morphometry (VBM) have revealed that patients with BD exhibit small gray matter (GM) volumes in the inferior frontal/anterior insula [2,3], medial frontal/anterior cingulate cortex (ACC) [2], and temporal regions [3], while patients with MDD show small GM volumes in the ACC [5,6] and dorsolateral and dorsomedial prefrontal cortex [6]. Moreover, a few volumetric neuroimaging studies have directly compared patients with BD and MDD to identify disorder-specific abnormalities. Relative to patients with MDD, patients with BD show reduced GM volumes in the habenula [10], middle cingulate gyrus [11], hippocampus, and amygdala [12], while those with BD have larger GM volumes in the anterior cingulate gyrus [12]. In functional magnetic resonance imaging (fMRI) studies, patients with BD demonstrated altered resting- state brain activity and connectivity relative to patients with MDD[13, 14]. Although these results indicate that patients with BD and MDD have differences in the brain, disorder-specific structural abnormalities remain unclear. Epidemiological genetic studies of BD and MDD can also be used to evaluate biological markers for distinguishing between the two disorders. Family studies show a relative risk of 10.7 for BD in first-degree relatives (FDRs) of BD probands, while the comparable relative risk for MDD is 2.8 [15]. Moreover, a twin study has shown that the heritability of BD is twice as high as that of MDD [16]. These results suggest a stronger genetic vulnerability for BD than for MDD. Unaffected FDRs of probands are also known to be at higher risk of developing BD or MDD than the general population [17, 18]. Sub-clinical traits of mood disorders show additional common traits that have been defined as candidate endophenotypes of mood disorders among unaffected relatives as compared to the general population [19]. There have been a few VBM studies on FDRs of patients with BD and MDD. For example, it has been shown that the FDRs of individuals with BD exhibit smaller [20] and larger GM volumes [21,22] in the inferior frontal gyrus and insula than healthy control subjects. Moreover, the FDRs of individuals with MDD show reduced hippocampal volumes [23] and increased amygdala volumes as compared to healthy control subjects [24]. Twin studies have also demonstrated decreased hippocampal volumes in FDRs of individuals with BD and MDD, as compared to healthy control subjects [25,26]. These results suggest that brain volumetric abnormalities reflect the vulnerability of FDRs and may reveal candidate endophenotypes for BD and MDD. However, there is, to our knowledge, no study comparing morphometric abnormalities of patients with BD and MDD to their respective FDRs in order to identify disorder-specific volumetric changes. To facilitate discrimination of BD from MDD, we investigated differences in brain volume and function between patients with BD and the FDRs of individuals with BD (BD group) and patients with MDD and the FDRs of individuals with MDD (MDD group). We examined brain volumes using VBM in both groups, and explored executive functioning in these patients, as impaired executive function has been revealed as a candidate endophenotype of BD [27]. Based on prior VBM studies of individuals with BD and MDD, we hypothesized that BD and MDD groups would show GM volume changes in regions related to emotional and cognitive processing. Such regions would include the medial frontal/ACC and inferior frontal/ insula cortex, as well as subcortical regions. We also expected to observe abnormalities in
PLOS ONE | DOI:10.1371/journal.pone.0168493 December 28, 2016
2 / 16
Neural Substrates of Mood Disorders
executive function, and that these deficits would be more pronounced in the BD group than in the MDD group.
Materials and Methods Participants This study was approved by the Institutional Review Board of Yamaguchi University Hospital. Written informed consent was obtained from all participants after a complete description of the study was provided. Our study consisted of 81 subjects, which included 10 patients with BD and 10 FDRs of individuals with BD (BD group), 17 patients with MDD and 17 FDRs of individuals with MDD (MDD group), and 27 healthy control subjects who had no immediate family members that had any psychiatric disorder (Table 1). Among the patients with BD, seven were diagnosed with bipolar I disorder (BD-I) and three with bipolar II disorder (BD-II). In patients with MDD, seven were undergoing their first major depressive episode, while 10 were classified as having recurrent episodes. All patients were screened by the International Neuropsychiatric Interview (M.I.N.I., Japanese version 5.0.0) [28] and underwent an interview to confirm their diagnosis by psychiatrists according to the DSM-IV-TR. Patients who had a history of electroconvulsive therapy or comorbid psychiatric disorders, including anxiety disorders and current or previous substance use disorders, were excluded. Current mood states of the patients were evaluated by a 17-item Hamilton Depression Rating Scale (HDRS) [29] and the Young Mania Rating Scale (YMRS) [30]. History of suicide was rated in six grades: 1, “never”; 2, “a brief thought”; 3, “planned at least once but did not attempt”; 4, “planned at least once and really wanted to die”; 5, “attempted suicide but did not want to die”; 6, “attempted suicide and hoped to die”. All patients were taking mood stabilizers (10 with BD, one with MDD), antidepressants (four with BD, 17 with MDD), or antipsychotics (secondgeneration antipsychotics: seven with BD, four with MDD; first-generation antipsychotics: two with BD, three with MDD). Eight of the 10 patients with BD took lithium. Antipsychotic doses Table 1. Demographics and clinical characteristics of participants. HC (n = 27)
BD group (n = 20) patients (n = 10)
FDRs (n = 10)
p
MDD group (n = 34) patients (n = 17)
FDR (n = 17)
p
Age (y)
48.3 ± 13.0
46.9 ± 12.3
54.8 ± 20.1
0.409
51.8 ± 11.4
45.5 ± 14.5
Gender(M/F)
10/17
3/7
5/5
0.109
7/10
5/12
0.03
Premorbid IQ
99.7 ± 7.9
107.4 ± 2.6
97.9 ± 2.6
0.049
94.8 ± 2.0
97.8 ± 2.0
0.097
Years of education (y)
14.0± 2.0
14.7± 1.6
12.7± 2.5
0.094
13.8± 2.3
13.4± 2.0
0.64
Handedness
88.7± 12.7
91.0± 13.9
97.0± 5.4
0.179
90.0± 15.8
86.5± 24.5
0.84
GAF
99.4± 2.1
42.0± 17.0
98.3± 3.3
< 0.01
40.3± 7.8
97.5± 3.1
< 0.01
HDRS
0.3± 0.7
21.3± 6.7
0.2 ± 0.4
< 0.01
23.5 ± 5.1
0.4± 1.0
< 0.01
YMRS
0.0 ± 0.0
0.0 ± 0.0
0.1± 0.3
0.158
0.2 ± 0.5
0.06± 0.1
Antipsychotic doses
0.37
0.18
181.4± 113.7
81.0± 69.8
0.072
Antidepressants doses
158.8± 36.1
211.7± 96.2
0.25
Duration of illness (m)
74.1± 110.3
49.5± 65.1
0.8
Onset age of illness (y)
32.2 ± 11.5
43.6 ± 13.9
0.047
The number of depressive episodes
6.4±5.2
2.2±1.1
< 0.01
HC, healthy control subjects; BD, bipolar disorder; MDD, major depressive disorder; GAF, Global Assessment for Function by DSM-IV-TR; HDRS, Hamilton Rating Scale for Depression; YMRS, Young Mania Rating Scale; TMT, Trail Making Test; the value was represented the mean ± SD. Statistics were done by ANOVA or Mann-Whitney test. doi:10.1371/journal.pone.0168493.t001
PLOS ONE | DOI:10.1371/journal.pone.0168493 December 28, 2016
3 / 16
Neural Substrates of Mood Disorders
were estimated using chlorpromazine dose equivalents and antidepressant doses were estimated using imipramine dose equivalents. Of the FDRs of individuals with BD, four had a parent with BD, four had a sibling with BD, and two had a child with BD. In FDRs of individuals with MDD, three had a parent with MDD, 12 had a sibling with MDD, and two had a child with MDD. The FDRs were screened by the M.I.N.I. and were excluded from the study when the examination revealed any psychiatric disorders. Twenty-seven healthy control subjects were screened using the M.I.N.I., and were excluded if any of their immediate family members had psychiatric disorders or heritable neurological diseases. Exclusion criteria for all participants included the presence of neurological or endocrine diseases, or abnormal results on medical laboratory tests, such as hypothyroid function, head trauma, Parkinson’s disease, family history of hereditary neurological disorder, severe hypertension and diabetes, active liver disease, kidney problems, and respiratory problems. All subjects were right-handed, as assessed using the Edinburgh handedness inventory [31]. The Global Assessment of Function (GAF) from the DSM-IV-TR was used to assess social functioning. Premorbid IQ scores were estimated using the Japanese Adult Reading Inventory (JART) [32].
Magnetic resonance imaging Brain images were collected on a 1.5-tesla Magnetom Vision scanner (Siemens Medical System Inc., Erlangen, Germany). A three-dimensional gradient-echo sequence (FLASH, fast low-angle shot) yielding 160–180 contiguous slices (1.0 mm thick) in the sagittal plane was used for image analysis. The MRI parameters were as follows: echo time = 5 ms, repetition time = 24 ms, flip angle = 40˚, field of view = 256 mm, matrix size = 256 × 256, voxel size = 1 × 1 × 1 mm. MR images were manually checked for quality before the VBM analysis, and abnormal findings were identified by psychiatrists with expertise in MRI studies, as well as by radiologists who were blinded to the subjects’ diagnosis.
Image analysis Image preprocessing was performed using SPM8 software (Wellcome Department of Imaging Neuroscience, London, UK) using Matlab R2012b 8.0.0.783 (MathWorks, Natick, MA, USA). T1-weighted images were segmented and imported into a format that could be used by the VBM8 algorithm. The segmented images were normalized to the Montreal Neurological Institute (MNI) space and smoothed with an 8-mm Gaussian filter.
Executive function Cognitive function was assessed by a trail making test (TMT). Recent meta-analyses of executive function in individuals with BD and MDD have shown poorer performance in patients than in healthy control subjects [33, 34]; thus, poor executive function could be a candidate endophenotype for BD [35]. Here, we used the time it took to complete a task for assessing function. The test consists of two parts (A and B) that must be performed as quickly as possible. Part A required individuals to connect a series of 25 numbered dots randomly distributed on a sheet of paper by drawing a line between them (1-2-3. . .), and assessed visual attention and processing speed [36]. Part B required individuals to connect a series of alternating numbered and lettered dots in order (1-A-2-B. . .), and assessed set-shifting [37]. The difference between the time it took subjects to complete Part A and Part B (TMT B-A) was also determined. The TMT B-A score is meant to remove the speed component from the test evaluation and represents executive function; it has been reported as a sensitive tool for assessing frontal
PLOS ONE | DOI:10.1371/journal.pone.0168493 December 28, 2016
4 / 16
Neural Substrates of Mood Disorders
lobe function [38]. Higher scores on the TMT B-A represented lower executive function. Furthermore, the score of the TMT was reportedly associated with medial frontal, insula, and ACC volumes [39, 40].
Statistical analysis VBM. We used SPM8 software to implement a general linear model analysis. First, we performed a whole-brain analysis using a factorial design, with age, sex, and premorbid IQ scores as covariates, in SPM8, to determine whether there was an effect of diagnosis when comparing either the BD or the MDD group with healthy control subjects. A voxel-wise F-test was performed with the threshold set at p < 0.05, corrected by a family-wise error (pFWE-corr). Mean GM volumes of regions that showed a significant main effect of diagnosis were then extracted by MarsBar (http://marsbar.sourceforge.net/) and compared among patients, FDRs, and healthy control subjects using an analysis of variance (ANOVA) in SPSS for Windows statistical software, version 16.0 (SPSS, Inc., Chicago, IL). We anatomically identified regions using automated anatomical labeling via WFU PickAtlas version 2.4 (http://www.fmri. wfubmc.edu/download.html). Second, another whole brain analysis was carried out in SPM8 using a factorial design with the condition having two factors (patients vs. FDRs) and diagnosis having two factors (BD vs. MDD) to determine whether there was an interaction between condition and diagnosis. TMT. We used the Kruskal–Wallis test for TMT Parts A, B, and B-A among the five groups. The Mann–Whitney U test was also used to compare differences between the two groups. Statistical significance was set at p < 0.05. Medication effect. To examine the effects of medication load on brain volume, we calculated the dosage of psychiatric medications. Antipsychotic doses were estimated using chlorpromazine dose equivalents. Antidepressant doses were estimated using imipramine dose equivalents. Mood-stabilizer medication was coded as absent (0), taking lithium (1), or taking lithium and valproate (2). Correlation analysis. A correlation analysis was applied to determine the relationship between significant results on the VBM and TMT. We also performed correlation analysis of the following clinical variables: age of illness onset; duration of illness; numbers of depressed, manic, and total episodes; scores on the HDRS and YMRS; medication load, and suicide history.
Results Demographics There was no significant difference in mean age, premorbid IQ, handedness, and years of education among the patients, FDRs, and healthy control subjects (Table 1). The distribution of sex among patients with MDD, FDRs of individuals with MDD, and healthy control subjects was significantly different. The mean age of onset in patients with BD was earlier than that of patients with MDD (U = 45.5, p = 0.05 by Mann–Whitney U test). No significant difference was observed between patients with BD and MDD in terms of illness duration (U = 80.0, p = 0.82) or in use of antipsychotics and antidepressants (U = 12.5, p = 0.072; U = 22.0, p = 0.25, respectively). Patients with BD had more mood episodes than patients with MDD (U = 9.0, p < 0.001). Eight of 10 patients with BD took lithium.
VBM For the BD group, a significant main effect of condition was found in the GM volume of the left medial prefrontal cortex adjacent to the ACC (coordinates of the voxel of maximum statistical
PLOS ONE | DOI:10.1371/journal.pone.0168493 December 28, 2016
5 / 16
Neural Substrates of Mood Disorders
Fig 1. Anterior cingulate GM volumes among the BD group in the whole brain analysis. The patients with BD and FDRs of individuals with BD showed significantly smaller volumes compared to healthy control subjects. FDR first-degree relatives; HC healthy subjects. doi:10.1371/journal.pone.0168493.g001
significance: x = -1.5, y = 48, z = -7.5, F = 22.96, k = 13, pFWE-corr = 0.01; Fig 1) and left insula (x = -39, y = 19.5, z = -1.5, F = 29.34, k = 103, pFWE-corr < 0.01; Fig 2(A)) in the whole brain analysis. In a post hoc analysis, patients with BD and FDRs of individuals with BD showed significantly smaller GM volumes in the left ACC than healthy control subjects (p < 0.01, 95% confidence interval, 95%CI [0.03, 0.13]; p < .05, 95% CI [0.002, 0.11], respectively). Moreover, patients with BD showed significantly smaller GM volumes in the left insula than did healthy control subjects, p < .01, 95% CI [0.05, 0.21]. There was no significant correlation between any medication load and left ACC or left insular GM volume in patients with BD (antipsychotics; r = -0.66, p = 0.076; r = -0.36, p = 0.93, respectively, antidepressants; r = -0.32, p = 0.68; r = -0.32, p = 0.68, respectively, and mood stabilizers; r = 0.23, p = 0.52; r = 0.23, p = 0.52, respectively). For the MDD group, there was a significant main effect of condition in the GM volume of the left and right inferior frontal gyrus adjacent to the insula (x = -42, y = 42, z = 7.5, F = 12.53, k = 347, uncorrected p = .05 × 10−4; x = 45, y = 52.5, z = 9, F = 14.18, k = 248, uncorrected p < .01 × 10−4, respectively) in the whole brain analysis (Fig 2(B) and 2(C)), although neither of these were significant after FWE correction. We overlaid the results of the whole-brain analysis of the BD group with those of the MDD group and found that the ACC was a region that was identified specifically in the BD group, while the insula was a shared region that was highlighted in both groups (Fig 3).
PLOS ONE | DOI:10.1371/journal.pone.0168493 December 28, 2016
6 / 16
Neural Substrates of Mood Disorders
Fig 2. Comparisons of GM volumes in the left and right insula of patients in BD and MDD groups. Patients with BD showed significantly smaller GM volumes in the left (a) and insular cortex compared to healthy control subjects. There was a trend of a main effect of diagnosis in the GM volume of the left (b) and right (c) insular cortex in the MDD group. doi:10.1371/journal.pone.0168493.g002
A two-by-two ANOVA of the whole brain revealed that there was no significant main effect of condition (patients vs. FDRs) or diagnosis (BD vs. MDD). Furthermore, there was no interaction between condition and diagnosis.
TMT Patients with BD took a significantly longer time to complete Part B, and had higher scores for the B-A of the TMT than did healthy control subjects (U = 76.0, p = 0.044; U = 66.0, p = 0.017, respectively). Patients with MDD took a significantly longer time to complete Part A and Part B than did the FDRs of individuals with MDD (U = 12.5, p < 0.001; U = 53.5, p = 0.001, respectively) and healthy control subjects (U = 91.0, p = 0.001; U = 80.0, p < 0.001, respectively) (Table 2).
Correlations The BD group showed a significantly inverse correlation between GM volumes of the left insula and the time it took patients to complete Part A of the TMT (r = -0.31, p < 0.05 by Spearman’s rho test; Fig 4). When excluding the subject with a TMT score of 160, who appeared to be an outlier, the result was still significant (r = -0.46, p < 0.05). In patients with BD, the severity of suicide history was also inversely correlated with GM volumes of the left insula (r = -0.76, p = 0.011 by Spearman’s rho test). No other significant correlations were found between VBM and TMT data and any clinical variables in the BD or MDD groups.
PLOS ONE | DOI:10.1371/journal.pone.0168493 December 28, 2016
7 / 16
Neural Substrates of Mood Disorders
Fig 3. A superimposed image of results from the whole-brain analysis. Areas in red represent regional GM volumes that showed a significant main effect of diagnosis in the BD group. Areas in green represent regional GM volumes that showed a main effect of diagnosis in the MDD group. Areas in yellow represent shared results of a main effect of diagnosis in BD and MDD groups. doi:10.1371/journal.pone.0168493.g003
Discussion Our current study revealed a reduction in the GM volume in the ACC of patients with BD and FDRs of individuals with BD, but not in patients with MDD or in FDRs of individuals with MDD. A whole brain analysis revealed a significant main effect of condition in the GM volume of the insula in patients with BD and MDD, as well as a reduced insular GM volume in patients with BD. We further found delayed TMT performance in patients with BD and MDD, but not Table 2. The results of behavioral performance and statistics in the score of TMT. TMT scale
Behavioral performance (sec), M (SD) BD group patients
p
MDD group FDRs
patients
HC FDRs
A
55.2 (43.4)
35.3 (14.6)
49.8 (13.2)
27.5 (5.9)
33.4 (13.7)
< 0.01
B
126.5 (90.0)
98.1 (65.3)
126.1 (78.8)
67.4 (25.9)
67.4 (24.3)
< 0.01
B-A
71.3 (57.4)
62.8 (51.1)
76.3 (72.4)
39.9 (23.5)
34.0 (16.7)
0.12
BD Bipolar disorder; MDD Major depressive disorder; FDR First degree relatives; HC Healthy control subjects. doi:10.1371/journal.pone.0168493.t002
PLOS ONE | DOI:10.1371/journal.pone.0168493 December 28, 2016
8 / 16
Neural Substrates of Mood Disorders
Fig 4. The correlation between GM volumes of the left insula and the time it took patients to complete Part A of the TMT. The left insular GM volume was negatively correlated with scores of the TMT-A in the BD group. doi:10.1371/journal.pone.0168493.g004
in the FDRs of individuals with BD or MDD. Finally, we found that the smaller insular GM volumes were associated with poor performance on the TMT-A as well as a severe suicide history in patients with BD. These findings suggest that the ACC GM volume could represent a distinct endophenotype of BD and that the insular GM volume could be a shared endophenotype of BD and MDD. Further, these findings suggest that insular GM volume may indicate cognitive decline and poor outcome in individuals with BD, and moreover, that performance on the TMT cannot distinguish between BD and MDD. The ACC plays a key role in the regulation of emotion and executive function [41], and disruption to this region is involved in the pathophysiology of BD. Some meta-analytical studies have supported the evidence that patients with BD have small GM volumes in the ACC [2, 42– 44]; however, other studies have not reported this reduction [3, 45–47]. For example, previous VBM studies on relatives of individuals with BD have shown that genetic risk for BD is associated with a reduced ACC GM volume [48]. Moreover, it has been shown that FDRs of individuals with BD have smaller medial white matter volumes near the ACC than do healthy subjects [20]. In contrast, a manual-tracing study showed that unaffected offspring of parents with BD do not have statistically significantly different subgenual ACC volumes when compared to healthy control subjects [49]. The negative findings of the latter study may be due to the use of different imaging analyses from the former two studies. Moreover, the latter study tested younger participants (mean age, 19−20 y); thus, the unaffected offspring of individuals with BD may potentially include individuals with BD before onset. Our findings support the evidence that the ACC volume may be a candidate endophenotype of BD and that the ACC may be involved in the morphometric pathophysiology related to the genetic liability for BD.
PLOS ONE | DOI:10.1371/journal.pone.0168493 December 28, 2016
9 / 16
Neural Substrates of Mood Disorders
Another interesting finding of this study was that individuals in the BD and MDD groups exhibited decreased insular GM volumes. The insular cortex plays a crucial role in emotional arousal and feeling [50, 51], and is assumed to be involved in a network model of higher-level cognitive control and emotional processing [52]. Three previous meta-analyses of VBM findings have revealed that patients with BD show smaller insular GM volumes than do healthy control subjects [2,3,53]. Two family studies of BD have also supported evidence of a change in insular volume, with one study on patients with BD and FDRs of individuals with BD showing a smaller left anterior insular GM volume than seen in healthy control subjects [20] and the other study showing an association between increased volume of the left insula and a genetic predisposition to BD [23]. Although more family studies of BD are required to confirm whether increases or decreases in GM volume are indicative of BD predisposition, the findings of the present study, together with those of prior studies, indicate that insular GM volume is associated with the genetic liability for BD. The present study also demonstrated that insular GM volume was associated with a severe history of suicide in patients with BD, as well as scores for the TMT-A in patients with BD and FDRs of individuals with BD. In previous studies, it has been reported that individuals with BD that have attempted suicide have smaller insular GM volumes than do individuals with BD that have not attempted suicide [54] and patients with BD with a history of psychotic episodes and psychotic spectrum disorders [55]. It has also been reported that patients with depression and a history of attempted suicide take a significantly longer time to complete the TMT-A than do healthy control subjects, whereas no significant differences have been found between the time it takes patients with depression without a history of attempted suicide to complete the TMT-A and healthy control subjects [56]. The results of the present study therefore further support the hypothesis that the insula may play a role in mediating suicidal ideation and the execution of suicidal behavior in individuals with BD. Previous reports have indicated an association between the insular cortex and TMT performance in healthy control subjects [57, 58]. In addition, the insula is reported to be part of a frontal–striatal attention network [59]. These finding suggest that the insula may be involved in executive function as measured on the TMT. In terms of patients in the MDD group, we also found smaller GM volumes in the insula, but this finding was not statistically significant after correction for multiple comparisons. The evidence of the relationship between the insular volume and MDD has been controversial. Although some VBM and manual-tracing studies have reported reduced insular volumes in patients with MDD as compared to healthy control subjects [60,61], meta-analytical volumetric studies have failed to show reductions in this region in patients with MDD [6,62,63]. Furthermore, previous VBM family studies have not shown significant differences in the insular GM volume among the FDRs of individuals with MDD, patients with MDD, and healthy subjects [25,64]. The limited evidence of changes in insular volume in individuals with MDD may be partly due to the low genetic liability for MDD as compared to that for BD [15,16]. More familial neuroimaging studies of MDD across larger samples are required to evaluate the association between the genetic liability for MD and brain volume. Nonetheless, the results of the current study suggest that reduced insular GM volume may be involved in the shared pathophysiology of BD and MDD, and moreover, that this is associated with cognitive dysfunction and the grave outcome of individuals with BD. In terms of executive function on the TMT, we found that patients with BD and MDD, but not FDRs of individuals with BD or MDD, showed significantly poorer results than did healthy control subjects. Previous reports have demonstrated that patients with BD and MDD exhibit cognitive impairments on the TMT-A [65–67] and TMT-B [65,66,68,69] as compared to healthy control subjects. These findings are consistent with our results. However, our findings
PLOS ONE | DOI:10.1371/journal.pone.0168493 December 28, 2016
10 / 16
Neural Substrates of Mood Disorders
on the cognitive function of the FDRs of individuals with BD and MDD are inconsistent with several previous reports. For instance, it has been reported that the FDRs of individuals with BD show deficits in response inhibition but not in working memory or cognitive set-shifting as compared to healthy control subjects [70]. Another study has reported that the FDRs of individuals with BD show impairments in verbal working memory, but not in psychomotor performance as compared to healthy control subjects [71]. Additionally, a meta-analysis on neuropsychological tests has reported that cognitive impairments in response inhibition, setshifting, and sustained attention are observed in patients with BD and the FDRs of individuals with BD, while processing speed, verbal working memory, and visual memory are affected in patients with BD, but not in the FDRs of individuals with BD [72]. These results suggest that, although impaired executive functioning may be one promising endophenotype of mood disorders, deficits in the FDRs of individuals with mood disorders may be restricted to a certain domain of executive function. The current study had several limitations. Fist, the small sample size may have limited our statistical power. Second, all patients with BD and MDD that participated in the study were taking psychiatric medications. Some reports have demonstrated that antidepressant administration increases the GM volume of the dorsolateral prefrontal cortex [73] and hippocampus [74,75] in patients with MDD, and that lithium impacts cortical GM density [76]. One review has suggested that medicated patients with BD show no significant effects of psychotropic medications in terms of structural and functional neuroimaging measures [77]. Due to this finding, and despite the lack of significant correlations between medication load and volumetric changes in the patients with BD in the present study, we cannot exclude the possibility that medication may have masked our results. In conclusion, this is the first study to compare candidate endophenotypes related to changes in brain volume between BD and MDD. Our results suggest that the volumetric changes in the ACC represent a distinct endophenotype of BD and that the changes in insular volume constitute a shared endophenotype between BD and MDD. Furthermore, changes in these regions may be associated with the prognosis of BD, indicating that these findings may be used as biomarkers for distinguishing between BD and MDD. Although there were no differences on performance of the TMT between the FDRs of individuals with mood disorders and healthy control subjects, GM volumes in the left insula were significantly inversely correlated with TMT-A scores in patients with BD and FDRs of patients with BD, but not in MDD patients and FDRs of patients with MDD. Future studies should evaluate both volumetric and cognitive changes in order to reveal characteristics specific to BD. For instance, Almeida et al. have indicated that combined dimensional approaches, including neuroimaging and cognitive function studies, may be useful to identify individuals at future risk for BD versus MDD [78]. Thus, further studies are required to identify biomarkers that can be used for the early diagnosis of BD.
Acknowledgments This work was supported by JSPS KAKENHI with grant numbers 24591716, 15K09832, 25861011, 25861012, and a Grant-in-Aid for Scientific Research on Innovative Areas (Comprehensive Brain Science Network) from the Ministry of Education, Science, Sports, and Culture of Japan. A part of this study contained results from the “Integrated Research on Neuropsychiatric Disorders” carried out under the Strategic Research Program for Brain Sciences by the Ministry of Education, Culture, Sports, Science and Technology of Japan. We would like to thank Editage (www.editage.jp) for English language editing.
PLOS ONE | DOI:10.1371/journal.pone.0168493 December 28, 2016
11 / 16
Neural Substrates of Mood Disorders
Author Contributions Conceptualization: TM KM YW. Data curation: TM KM KH M. Nakano M. Nakashima TW KE. Formal analysis: TM KM MF NM. Funding acquisition: YW. Investigation: TM KH M. Nakano M. Nakashima TW KE. Methodology: TM KM MF NM. Project administration: KM YW. Resources: TM KM KH M. Nakano M. Nakashima TW KE YW. Software: TM KM MF NM. Supervision: KM YW. Validation: TM KM MF NM. Visualization: TM KM M. Nakano. Writing – original draft: TM. Writing – review & editing: KM YW.
References 1.
Hirschfeld RM, Lewis L, Vornik LA. Perceptions and impact of bipolar disorder: how far have we really come? Results of the national depressive and manic-depressive association 2000 survey of individuals with bipolar disorder. J Clin Psychiatry. 2003; 64:161–174. PMID: 12633125
2.
Goodwin FK, Jamison KR. Manic-Depressive Illness: Bipolar Disorders and Recurrent Depression. 2nd edition. Oxford University Press, 2007.
3.
Bertelsen A, Harvald B, Hauge M. A Danish twin study of manic-depressive disorders. Br J Psychiatry. 1997; 130:330–351.
4.
Klein DN, Lewinsohn PM, Seeley JR, Rohde P. A family study of major depressive disorder in a community sample of adolescents. Arch Gen Psychiatry. 2001; 58:13–20. PMID: 11146753
5.
Mortensen PB, Pedersen CB, Melbye M, Mors O, Ewald H. Individual and familial risk factors for bipolar affective disorders in Denmark. Arch Gen Psychiatry. 2003; 60:1209–1215. doi: 10.1001/archpsyc.60. 12.1209 PMID: 14662553
6.
Leboyer M, Bellivier F, Nosten-Bertrand M, Jouvent R, Pauls D, Mallet J. Psychiatric genetics: search for phenotypes. Trends Neurosci. 1998; 21:102–105. PMID: 9530915
7.
Bora E, Fornito A, Yu¨cel M, Pantelis C. Voxelwise meta-analysis of gray matter abnormalities in bipolar disorder. Biol Psychiatry. 2010; 67:1097–1105. doi: 10.1016/j.biopsych.2010.01.020 PMID: 20303066
8.
Selvaraj S, Arnone D, Job D, Stanfield A, Farrow TF, Nugent AC, et al. Grey matter differences in bipolar disorder: a meta-analysis of voxel-based morphometry studies. Bipolar Disord. 2012; 14:135–145. doi: 10.1111/j.1399-5618.2012.01000.x PMID: 22420589
9.
Cao B, Stanley JA, Selvaraj S, Mwangi B, Passos IC, Zunta-Soares GB, et al.Evidence of altered membrane phospholipid metabolism in the anterior cingulate cortex and striatum of patients with bipolar disorder I: A multi-voxel (1)H MRS study. J Psychiatr Res. 2016; 81:48–55. doi: 10.1016/j.jpsychires. 2016.06.006 PMID: 27376506
10.
Bora E, Fornito A, Yu¨cel M, Pantelis C. The effects of gender on grey matter abnormalities in major psychoses: a comparative voxelwise meta-analysis of schizophrenia and bipolar disorder. Psychol Med. 2012; 42:295–307. doi: 10.1017/S0033291711001450 PMID: 21835091
11.
Lai CH. Gray matter volume in major depressive disorder: a meta-analysis of voxel-based morphometry studies. Psychiatry Res. 2013; 211:37–46. doi: 10.1016/j.pscychresns.2012.06.006 PMID: 23146253
PLOS ONE | DOI:10.1371/journal.pone.0168493 December 28, 2016
12 / 16
Neural Substrates of Mood Disorders
12.
Bora E, Fornito A, Pantelis C, Yu¨cel M.J. Gray matter abnormalities in Major Depressive Disorder: a meta-analysis of voxel based morphometry studies. J Affect Disord. 2013; 138:9–18.
13.
Jie NF, Zhu MH, Ma XY, Osuch EA, Wammes M, The´berge J, et al. Discriminating Bipolar Disorder From Major Depression Based on SVM-FoBa: Efficient Feature Selection With Multimodal Brain Imaging Data. IEEE Trans Auton Ment Dev. 2015; 7:320–331. doi: 10.1109/TAMD.2015.2440298 PMID: 26858825
14.
He H, Yu Q, Du Y, Vergara V, Victor TA, Drevets WC, et al. Resting-state functional network connectivity in prefrontal regions differs between unmedicated patients with bipolar and major depressive disorders. J Affect Disord. 2016 15;:483–493.
15.
Arnone D, McIntosh AM, Ebmeier KP, Munafò MR, Anderson IM. Magnetic resonance imaging studies in unipolar depression: systematic review and meta-regression analyses. Eur Neuropsychopharmacol. 2012; 22:1–16. doi: 10.1016/j.euroneuro.2011.05.003 PMID: 21723712
16.
Du M, Liu J, Chen Z, Huang X, Li J, Kuang W, et al. Brain grey matter volume alterations in late-life depression. J Psychiatry Neurosci. 2014; 39:397–406. doi: 10.1503/jpn.130275 PMID: 24949867
17.
Savitz JB, Nugent AC, Bogers W, Roiser JP, Bain EE, Neumeister A, et al. Habenula volume in bipolar disorder and major depressive disorder: a high-resolution magnetic resonance imaging study. Biol Psychiatry. 2011; 69:336–343. doi: 10.1016/j.biopsych.2010.09.027 PMID: 21094939
18.
Cai Y, Liu J, Zhang L, Liao M, Zhang Y, Wang L, et al. Grey matter volume abnormalities in patients with bipolar I depressive disorder and unipolar depressive disorder: a voxel-based morphometry study. Neurosci Bull. 2015; 31:4–12. doi: 10.1007/s12264-014-1485-5 PMID: 25502401
19.
Redlich R, Almeida JJ, Grotegerd D, Opel N, Kugel H, Heindel W, et al. Brain morphometric biomarkers distinguishing unipolar and bipolar depression. A voxel-based morphometry-pattern classification approach. JAMA Psychiatry. 2014; 71:1222–1230. doi: 10.1001/jamapsychiatry.2014.1100 PMID: 25188810
20.
Matsuo K, Kopecek M, Nicoletti MA, Hatch JP, Watanabe Y, Nery FG, et al. New structural brain imaging endophenotype in bipolar disorder. Mol Psychiatry. 2012; 17:412–420. doi: 10.1038/mp.2011.3 PMID: 21321565
21.
Hajek T, Cullis J, Novak T, Kopecek M, Blagdon R, Propper L, et al. Brain structural signature of familial predisposition for bipolar disorder: replicable evidence for involvement of the right inferior frontal gyrus. Biol Psychiatry. 2013; 73:144–152. doi: 10.1016/j.biopsych.2012.06.015 PMID: 22818781
22.
Kempton MJ, Haldane M, Jogia J, Grasby PM, Collier D, Frangou S. Dissociable brain structural changes associated with predisposition, resilience, and disease expression in bipolar disorder. J Neurosci. 2009; 29:10863–10868. doi: 10.1523/JNEUROSCI.2204-09.2009 PMID: 19726644
23.
Baare´ WF, Vinberg M, Knudsen GM, Paulson OB, Langkilde AR, Jernigan TL, et al. Hippocampal volume changes in healthy subjects at risk of unipolar depression. J Psychiatr Res. 2010; 44:655–662. doi: 10.1016/j.jpsychires.2009.12.009 PMID: 20096419
24.
Romanczuk-Seiferth N, Po¨hland L, Mohnke S, Garbusow M, Erk S, Haddad L, et al. Larger amygdala volume in first-degree relatives of patients with major depression. Neuroimage Clin. 2014; 5:62–68. doi: 10.1016/j.nicl.2014.05.015 PMID: 25003028
25.
van Erp TG, Thompson PM, Kieseppa¨ T, Bearden CE, Marino AC, Hoftman GD, et al. Hippocampal morphology in lithium and non-lithium-treated bipolar I disorder patients, non-bipolar co-twins, and control twins. Hum Brain Mapp. 2012; 33:501–510. doi: 10.1002/hbm.21239 PMID: 21455943
26.
Amico F, Meisenzahl E, Koutsouleris N, Reiser M, Mo¨ller HJ, Frodl T. Structural MRI correlates for vulnerability and resilience to major depressive disorder. J Psychiatry Neurosci. 2011; 36:15–22. doi: 10. 1503/jpn.090186 PMID: 20964952
27.
Robinson LJ, Ferrier IN. Evolution of cognitive impairment in bipolar disorder: a systematic review of cross-sectional evidence. Bipolar Disord. 2006; 8:103–116. doi: 10.1111/j.1399-5618.2006.00277.x PMID: 16542180
28.
Otsubo T, Tanaka K, Koda R, Shinoda J, Sano N, Tanaka S, et al. Reliability and validity of Japanese version of the Mini-International Neuropsychiatric Interview. Clin Neurosci. 2005; 59:517–526.
29.
Hamilton M. A rating scale for depression. J Neurol Neurosurg Psychiatry. 1960; 23:56–62. PMID: 14399272
30.
Young RC, Biggs JT, Ziegler VE, Meyer DA. A rating scale for mania: reliability, validity and sensitivity. Br J Psychiatry. 1978; 133:429–435. PMID: 728692
31.
Oldfield RC. The assessment and analysis of handedness: the Edinburgh inventory. Neuropsychologia. 1971; 9:97–113. PMID: 5146491
32.
Matsuoka K, Uno M, Kasai K, Koyama K, Kim Y. Estimation of premorbid IQ in individuals with Alzheimer’s disease using Japanese ideographic script (Kanji) compound words: Japanese version of
PLOS ONE | DOI:10.1371/journal.pone.0168493 December 28, 2016
13 / 16
Neural Substrates of Mood Disorders
33.
National Adult Reading Test. Psychiatry Clin Neurosci. 2006; 60:332–339. doi: 10.1111/j.1440-1819. 2006.01510.x PMID: 16732750 ¨ , Balanza´-Martı´nez V, Bora E, Brissos S, Cavanagh JT, et al. Neuropsychological Bourne C, Aydemir O testing of cognitive impairment in euthymic bipolar disorder: an individual patient data meta-analysis. Acta Psychiatr Scand. 2013; 128:149–162. doi: 10.1111/acps.12133 PMID: 23617548
34.
Wagner S, Doering B, Helmreich I, Lieb K, Tadić A. A meta-analysis of executive dysfunctions in unipolar major depressive disorder without psychotic symptoms and their changes during antidepressant treatment. Acta Psychiatr Scand. 2012; 125:281–292. doi: 10.1111/j.1600-0447.2011.01762.x PMID: 22007857
35.
Glahn DC, Bearden CE, Niendam TA, Escamilla MA. The feasibility of neuropsychological endophenotypes in the search for genes associated with bipolar affective disorder. Bipolar Disord. 2004; 6:171– 182. doi: 10.1111/j.1399-5618.2004.00113.x PMID: 15117396
36.
Keefe RS, McClintock SM, Roth RM, Doraiswamy PM, Tiger S, Madhoo M. Cognitive effects of pharmacotherapy for major depressive disorder: a systematic review. J Clin Psychiatry. 2014; 75:864–876. doi: 10.4088/JCP.13r08609 PMID: 25099527
37.
Jacobson SC, Blanchard M, Connolly CC, Cannon M, Garavan H. An fMRI investigation of a novel analogue to the Trail-Making Test. Brain Cogn. 2011; 77:60–70. doi: 10.1016/j.bandc.2011.06.001 PMID: 21782309
38.
Vinberg M, Miskowiak KW, Kessing LV. Impairment of executive function and attention predicts onset of affective disorder in healthy high-risk twins. J Clin Psychiatry. 2013; 74:747–753.
39.
Yuan P, Raz N. Prefrontal cortex and executive functions in healthy adults: a meta-analysis of structural neuroimaging studies. Neurosci Biobehav Rev. 2014; 42:180–192. doi: 10.1016/j.neubiorev.2014.02. 005 PMID: 24568942
40.
Zimmerman ME, DelBello MP, Getz GE, Shear PK, Strakowski SM. Anterior cingulate subregion volumes and executive function in bipolar disorder. Bipolar Disord. 2006; 8:281–288. doi: 10.1111/j.13995618.2006.00298.x PMID: 16696831
41.
Gasquoine PG. Localization of function in anterior cingulate cortex: from psychosurgery to functional neuroimaging. Neurosci Biobehav Rev. 2013; 37:340–348. doi: 10.1016/j.neubiorev.2013.01.002 PMID: 23313645
42.
Ellison-Wright I, Bullmore E. Anatomy of bipolar disorder and schizophrenia: a meta-analysis. Schizophr Res. 2010; 117:1–12. doi: 10.1016/j.schres.2009.12.022 PMID: 20071149
43.
McDonald C, Zanelli J, Rabe-Hesketh S, Ellison-Wright I, Sham P, Kalidindi S, et al. Meta-analysis of magnetic resonance imaging brain morphometry studies in bipolar disorder. Biol Psychiatry. 2004; 56:411–417. doi: 10.1016/j.biopsych.2004.06.021 PMID: 15364039
44.
Hajek T, Carrey N, Alda M. Neuroanatomical abnormalities as risk factors for bipolar disorder. Bipolar Disord. 2005; 7:393–403. doi: 10.1111/j.1399-5618.2005.00238.x PMID: 16176432
45.
Arnone D, Cavanagh J, Gerber D, Lawrie SM, Ebmeier KP, McIntosh AM. Magnetic resonance imaging studies in bipolar disorder and schizophrenia: meta-analysis. Br J Psychiatry. 2009; 195:194–201. doi: 10.1192/bjp.bp.108.059717 PMID: 19721106
46.
Kempton MJ, Geddes JR, Ettinger U, Williams SC, Grasby PM. Meta-analysis, database, and metaregression of 98 structural imaging studies in bipolar disorder. Arch Gen Psychiatry. 2008; 65:1017– 1032. doi: 10.1001/archpsyc.65.9.1017 PMID: 18762588
47.
Hajek T, Kozeny J, Kopecek M, Alda M, Ho¨schl C. Reduced subgenual cingulate volumes in mood disorders: a meta-analysis. J Psychiatry Neurosci. 2008; 33:91–99. PMID: 18330455
48.
McDonald C, Bullmore ET, Sham PC, Chitnis X, Wickham H, Bramon E, et al. Association of genetic risks for schizophrenia and bipolar disorder with specific and generic brain structural endophenotypes. Arch Gen Psychiatry. 2004; 61:974–984. doi: 10.1001/archpsyc.61.10.974 PMID: 15466670
49.
Hajek T, Gunde E, Bernier D, Slaney C, Propper L, Grof P, et al. Subgenual cingulate volumes in affected and unaffected offspring of bipolar parents. J Affect Disord. 2008; 108:263–269. doi: 10.1016/ j.jad.2007.10.024 PMID: 18037495
50.
Singer T. The neuronal basis and ontogeny of empathy and mind reading: review of literature and implications for future research. Neurosci Biobehav Rev. 2006; 30:855–863. doi: 10.1016/j.neubiorev.2006. 06.011 PMID: 16904182
51.
Singer T, Critchley HD, Preuschoff K. A common role of insula in feelings, empathy and uncertainty. Trends Cogn Sci. 2009; 13:334–340. doi: 10.1016/j.tics.2009.05.001 PMID: 19643659
52.
Menon V, Uddin LQ. Saliency, switching, attention and control: a network model of insula function. Brain Struct Funct. 2010; 214:655–667. doi: 10.1007/s00429-010-0262-0 PMID: 20512370
53.
Ellison-Wright I, Bullmore E. Anatomy of bipolar disorder and schizophrenia: a meta-analysis. Schizophr Res. 2010; 117:1–12. doi: 10.1016/j.schres.2009.12.022 PMID: 20071149
PLOS ONE | DOI:10.1371/journal.pone.0168493 December 28, 2016
14 / 16
Neural Substrates of Mood Disorders
54.
Benedetti F, Radaelli D, Poletti S, Locatelli C, Falini A, Colombo C, et al. Opposite effects of suicidality and lithium on gray matter volumes in bipolar depression. J Affect Disord. 2011; 135:139–147. doi: 10. 1016/j.jad.2011.07.006 PMID: 21807414
55.
Giakoumatos CI, Tandon N, Shah J, Mathew IT, Brady RO, Clementz BA, et al. Are structural brain abnormalities associated with suicidal behavior in patients with psychotic disorders? J Psychiatr Res. 2013; 47:1389–1395. doi: 10.1016/j.jpsychires.2013.06.011 PMID: 23866739
56.
Richard-Devantoy S, Jollant F, Kefi Z, Turecki G, Olie´ JP, Annweiler C, et al. Deficit of cognitive inhibition in depressed elderly: a neurocognitive marker of suicidal risk. J Affect Disord. 2012; 140:193–199. doi: 10.1016/j.jad.2012.03.006 PMID: 22464009
57.
Zakzanis KK, Mraz R, Graham SJ. An fMRI study of the Trail Making Test. Neuropsychologia. 2005; 43:1878–86. doi: 10.1016/j.neuropsychologia.2005.03.013 PMID: 16168730
58.
Koutsouleris N, Patschurek-Kliche K, Scheuerecker J, Decker P, Bottlender R, Schmitt G, et al. Neuroanatomical correlates of executive dysfunction in the at-risk mental state for psychosis. Schizophr Res. 2010 Nov; 123(2–3):160–74. doi: 10.1016/j.schres.2010.08.026 PMID: 20826078
59.
Schmitz N, Rubia K, Daly E, Smith A, Williams S, Murphy DG. Neural correlates of executive function in autistic spectrum disorders. Biol Psychiatry. 2006; 59:7–16. doi: 10.1016/j.biopsych.2005.06.007 PMID: 16140278
60.
Liu CH, Jing B, Ma X, Xu PF, Zhang Y, Li F, et al. Voxel-based morphometry study of the insular cortex in female patients with current and remitted depression. Neuroscience. 2014; 262:190–199. doi: 10. 1016/j.neuroscience.2013.12.058 PMID: 24406440
61.
Takahashi T, Yu¨cel M, Lorenzetti V, Tanino R, Whittle S, Suzuki M, et al. Volumetric MRI study of the insular cortex in individuals with current and past major depression. J Affect Disord. 2010; 121:231– 238. doi: 10.1016/j.jad.2009.06.003 PMID: 19540599
62.
Kempton MJ, Salvador Z, Munafò MR, Geddes JR, Simmons A, Frangou S, et al. Structural neuroimaging studies in major depressive disorder. Meta-analysis and comparison with bipolar disorder. Arch Gen Psychiatry. 2011; 68:675–690. doi: 10.1001/archgenpsychiatry.2011.60 PMID: 21727252
63.
Sacher J, Neumann J, Fu¨nfstu¨ck T, Soliman A, Villringer A, Schroeter ML. Mapping the depressed brain: a meta-analysis of structural and functional alterations in major depressive disorder. J Affect Disord. 2012; 140:142–148. doi: 10.1016/j.jad.2011.08.001 PMID: 21890211
64.
Romanczuk-Seiferth N, Po¨hland L, Mohnke S, Garbusow M, Erk S, Haddad L, et al. Larger amygdala volume in first-degree relatives of patients with major depression. Neuroimage Clin. 2014; 5:62–68. doi: 10.1016/j.nicl.2014.05.015 PMID: 25003028
65.
Ryan KA, Vederman AC, McFadden EM, Weldon AL, Kamali M, Langenecker SA, et al. Differential executive functioning performance by phase of bipolar disorder. Bipolar Disord. 2012; 14:527–536. doi: 10.1111/j.1399-5618.2012.01032.x PMID: 22834461 ¨ , Balanza´-Martı´nez V, Bora E, Brissos S, Cavanagh JT, et al. Neuropsychological Bourne C, Aydemir O testing of cognitive impairment in euthymic bipolar disorder: an individual patient data meta-analysis. Acta Psychiatr Scand. 2013; 128:149–162. doi: 10.1111/acps.12133 PMID: 23617548
66.
67.
Gohier B, Ferracci L, Surguladze SA, Lawrence E, El Hage W, Kefi MZ, et al. Cognitive inhibition and working memory in unipolar depression. J Affect Disord. 2009; 116:100–105. doi: 10.1016/j.jad.2008. 10.028 PMID: 19042027
68.
Wagner S, Doering B, Helmreich I, Lieb K, Tadić A. A meta-analysis of executive dysfunctions in unipolar major depressive disorder without psychotic symptoms and their changes during antidepressant treatment. Acta Psychiatr Scand. 2012; 125:281–292. doi: 10.1111/j.1600-0447.2011.01762.x PMID: 22007857
69.
Preiss M, Kucerova H, Lukavsky J, Stepankova H, Sos P, Kawaciukova R. Cognitive deficits in the euthymic phase of unipolar depression. Psychiatry Res. 2009; 169:235–239. doi: 10.1016/j.psychres. 2008.06.042 PMID: 19765829
70.
Schulze KK, Walshe M, Stahl D, Hall MH, Kravariti E, Morris R, et al. Executive functioning in familial bipolar I disorder patients and their unaffected relatives. Bipolar Disord. 2011; 13:208–216. doi: 10. 1111/j.1399-5618.2011.00901.x PMID: 21443575
71.
Bora E, Vahip S, Akdeniz F, Ilerisoy H, Aldemir E, Alkan M. Executive and verbal working memory dysfunction in first-degree relatives of patients with bipolar disorder. Psychiatry Res. 2008; 161:318–324. doi: 10.1016/j.psychres.2007.09.002 PMID: 18977035
72.
Bora E, Yucel M, Pantelis CJ. Cognitive endophenotypes of bipolar disorder: a meta-analysis of neuropsychological deficits in euthymic patients and their first-degree relatives. Affect Disord. 2009; 113:1– 20.
PLOS ONE | DOI:10.1371/journal.pone.0168493 December 28, 2016
15 / 16
Neural Substrates of Mood Disorders
73.
Smith R, Chen K, Baxter L, Fort C, Lane RD. Antidepressant effects of sertraline associated with volume increases in dorsolateral prefrontal cortex. J Affect Disord. 2013; 146:414–419. doi: 10.1016/j.jad. 2012.07.029 PMID: 23017544
74.
Arnone D, McKie S, Elliott R, Juhasz G, Thomas EJ, Downey D, et al. State-dependent changes in hippocampal grey matter in depression. Mol Psychiatry. 2013; 18:1265–1272. doi: 10.1038/mp.2012.150 PMID: 23128153
75.
Schermuly I, Wolf D, Lieb K, Stoeter P, Fellgiebel A. State dependent posterior hippocampal volume increases in patients with major depressive disorder. J Affect Disord. 2011; 135:405–409. doi: 10.1016/ j.jad.2011.07.017 PMID: 21849213
76.
Bearden CE, Thompson PM, Dalwani M, Hayashi KM, Lee AD, Nicoletti M, et al. Greater cortical gray matter density in lithium-treated patients with bipolar disorder. Biol Psychiatry. 2007; 62:7–16. doi: 10. 1016/j.biopsych.2006.10.027 PMID: 17240360
77.
Phillips ML, Travis MJ, Fagiolini A, Kupfer DJ. Medication effects in neuroimaging studies of bipolar disorder. Am J Psychiatry. 2008; 165:313–320. doi: 10.1176/appi.ajp.2007.07071066 PMID: 18245175
78.
Cardoso de Almeida JR, Phillips ML. Distinguishing between unipolar depression and bipolar depression: current and future clinical and neuroimaging perspectives. Biol Psychiatry. 2013; 73:111–118. doi: 10.1016/j.biopsych.2012.06.010 PMID: 22784485
PLOS ONE | DOI:10.1371/journal.pone.0168493 December 28, 2016
16 / 16