Online Submissions: wjg.wjgnet.com
[email protected] doi:10.3748/wjg.14.6072
World J Gastroenterol 2008 October 21; 14(39): 6072-6077 World Journal of Gastroenterology ISSN 1007-9327 © 2008 The WJG Press. All rights reserved.
RAPID COMMUNICATION
Distinct expression patterns in hepatitis B virus- and hepatitis C virus-infected hepatocellular carcinoma
Chun-Feng Lee, Zhi-Qiang Ling, Ting Zhao, Kuan-Rong Lee Chun-Feng Lee, Kuan-Rong Lee, Institute of Molecular Medicine, National Tsing Hua University, 101, Section 2, Kuang-Fu Road, Hsinchu, Taiwan 30013, China Zhi-Qiang Ling, Zhejiang Cancer Research Institute, 38 Guangji Road Banshanqiao, Hangzhou 310022, Zhejiang Province, China Ting Zhao, Department of surgery, Zhejiang Provincial People Hospital, 158 Shangtang Road, Hangzhou 310014, Zhejiang Province, China Author contributions: Lee CF performed most of the experiments, participated in most of the data analysis and drafted the manuscript; Lee KR was the leader of the project, who conceived the study, designed the research, guided the experiments and the data analyses, and suggested revisions in the manuscript; Ling ZQ carried out cDNA microarray, realtime RT-PCR experiments and provided critical comments and suggested revisions in the manuscript; Zhao T collected and prepared hepatocellular carcinoma samples, and participated in some experiments; All authors read and approved the final manuscript. Correspondence to: Kuan-Rong Lee, Institute of Molecular Medicine, National Tsing Hua University, 101, Section 2, Kuang-Fu Road, Hsinchu, Taiwan 30013, China.
[email protected] Telephone: +886-3-574-2755 Fax: +886-3-571-5934 Received: September 1, 2008 Revised: September 8, 2008 Accepted: September 15, 2008 Published online: October 21, 2008
genes in HCV-infected group included 4 genes: VIM (cell structure), ACTB (cell structure), GAPD (glycolysis) and CD58 (cell adhesion). The expression patterns of the 11 genes, identified by cDNA microarray, were confirmed by quantitative RT-PCR in 32 specimens. CONCLUSION: The patterns of all identified genes were classified based on the viral factor involved in HBV- and HCV-associated HCC. Our results strongly suggest that the pattern of gene expression in HCC is closely associated with the etiologic factor. The present study indicates that HBV and HCV cause hepatocarcinogenesis by different mechanisms, and provide novel tools for the diagnosis and treatment of HBVand HCV-associated HCC.
Abstract
Lee CF, Ling ZQ, Zhao T, Lee KR. Distinct expression patterns in hepatitis B virus- and hepatitis C virus-infected hepatocellular carcinoma. World J Gastroenterol 2008; 14(39): 6072-6077 Available from: URL: http://www.wjgnet. com/1007-9327/14/6072.asp DOI: http://dx.doi.org/10.3748/ wjg.14.6072
AIM: To identify biomarkers indicating virus-specific hepatocarcinogenic process, differential mRNA expression in 32 patients with hepatitis B virus (HBV)-/hepatitis C virus (HCV)-associated hepatocellular carcinoma (HCC) were investigated by means of cDNA microarrays comprising of 886 genes. METHODS: Thirty two HCC patients were divided into two groups based on viral markers: hepatitis B virus positive and HCV positive. The expression profiles of 32 pairs of specimens (tumorous and surrounding nontumorous liver tissues), consisting of 886 genes were analyzed. RESULTS: Seven up-regulated genes in HBV-associated HCC comprised genes involved in protein synthesis (RPS5 ), cytoskeletal organization (KRT8 ), apoptosis related genes (CFLAR ), transport (ATP5F1 ), cell membrane receptor related genes (IGFBP2 ), signal transduction or transcription related genes (MAP3K5 ), and metastasis-related genes (MMP9 ). The up-regulated www.wjgnet.com
© 2008 The WJG Press. All rights reserved.
Key words: Hepatocellular carcinoma; Hepatitis B virus; Hepatitis C virus-infected; cDNA microarray; Expression profiling Peer reviewers: Peter Karayiannis, PhD, Associate Professor,
Department of Medicine, Hepatology Section, St Mary’s Hospital Campus, South Wharf Road, London W2 1NY, United Kingdom; Jose JG Marin, Professor, Head of the Departamento Physiology and Pharmacology, University of Salamanca, CIBERehd, Campus Miguel de Unamuno, ED-S09, Salamanca 37007, Spain
INTRODUCTION Hepatocellular carcinoma (HCC) is one of the most common cancers worldwide[1]. The major risk factors for HCC are chronic hepatitis resulting from infection with HBV and HCV, and exposure to various exogenous carcinogens, including aflatoxin B1 [2]. Several studies have shown that the incidence of HCC has increased substantially in East Asia, including China, Korea and Japan[3,4]. More than 350 million people worldwide are known to be chronic carriers of HBV[5]. Moreover, the incidence of HCC is increasing in many countries in
Lee CF et al . Gene expression patterns linked to virus type in HCC
parallel with the increase in chronic HCV infection[1,2]. Therefore, clarification of the genetic portrait of hepatocarcinogenesis caused by HBV or HCV infection may provide clues to help reduce the incidence of HCC, and establish effective treatments for HCC. However, the molecular nature of this association is poorly understood. The phenotypic diversity of cancer is accompanied with a corresponding diversity in the gene expression patterns [6-10]. Honda et al [11] showed the presence of different gene expression profiles in the liver lesions of chronic hepatitis caused by HBV and HCV, and suggested that the molecular mechanisms responsible for the pathogenesis of HCC differ between HBV and HCV infections. In the present study, we investigated the gene expression patterns of 32 HCC samples, using cDNA microarrays containing 886 clones in order to gain additional insight into hepatocarcinogenesis or cancer progression related to HBV and HCV infections. The aim of the present study was to characterize the gene expression associated with HCC, with a view to better understand the molecular pathophysiology, which may lead to better methods of detection, diagnosis, and classification of HCC.
MATERIALS AND METHODS Patient material The Institutional Review Board on Medical Ethics, Zhejiang Provincial People Hospital (China), approved the method of tissue collection. The present study was conducted in the department of surgery, Zhejiang Provincial People Hospital, on 32 patients who underwent hepatectomy for sporadic HCC without preoperative radio- or chemotherapy. All of tissue samples were immediately frozen in liquid nitrogen, and stored at -80℃ until use. A total of 32 HCC samples from 15 lymph node negative and 17 lymph node positive cases were used (Table 1).
6073
Table 1 Clincal data of patients with hepatocellular carcinoma Case 1 2 3 4 5 6 7 8 9 10 11 12 13 14 15 16 17 18 19 20 21 22 23 24 25 26 27 28 29 30 31 32
Sex
Age
Hepatitis virus
M M F M M F F M M M M F M F M F M F M F M M M F M M M F M M F M
54 60 61 62 58 56 44 49 58 67 69 63 48 63 49 51 65 58 60 56 42 55 66 70 58 53 61 65 59 50 63 66
HBV HCV HBV HBV HBV HCV HBV HCV HBV HCV HBV HCV HCV HBV HCV HBV HCV HBV HBV HCV HCV HBV HBV HCV HBV HCV HBV HBV HCV HBV HCV HCV
Differentiated grade TNM score WD WD WD WD WD MD WD WD WD PD WD WD MD WD MD PD MD PD MD PD PD PD MD WD PD PD PD MD MD PD PD PD
T1N0M0 T1N0M0 T2N0M0 T2N0M0 T1N0M0 T3N0M0 T2N0M0 T1N0M0 T2N0M0 T3N0M0 T2N0M0 T1N0M0 T2N0M0 T1N0M0 T1N0M0 T3N1M0 T3N1M0 T4N1M1 T2N1M0 T3N1M1 T3N1M0 T4N1M1 T3N1M0 T2N1M0 T4N1M1 T3N1M0 T4N1M0 T3N1M0 T3N1M1 T3N1M0 T4N1M1 T3N1M0
M: Male; F: Female; HBV: Hepatitis B virus infection; HCV: Hepatitis C virus infection; WD: Well differentiated HCC; MD: Moderately differentiated HCC; PD: Poorly differentiated HCC.
Laser microdissection Eight μm-thick sections of the frozen tissue were cut at -20℃ and stained with HE. Under microscopic observation, parts of cancer cells nests in the invasive and intraductal components were microdissected, using the LM100 laser capture microdissection system (Arcturus Engineering, Mountain View, CA, USA). A 15 μm-diameter beam was used to capture the tumor cells and the corresponding non-cancerous liver tissues. The cell nests were transferred to a LCM transfer film (CapSure TF-100S transfer film carrier, 5 mm-diameter optical-grade transparent plastic; Arcturus Engineering).
instructions. The quality of mRNA was assessed by A 260/280 ratios and the contamination of genomic DNA was checked using the PCR method. cDNA was synthesized with T7-oligo (dT) primer (Ambion) and Superscript II enzyme (Gibco BRL), as described in the instruction manual. cDNA was purified by cDNA clean-up column (DNA clearTM kit, Ambion). cRNA was generated by T7 MEGAscriptTM kit (MEGAscript in vitro Transcription Kit, Ambion, AUSTIN, Tex), per the manufacturer’s recommendations. Column purification of cRNA was performed with RNeasy kit (Qiagen), according to the manufacturer’s protocol. The concentration and quality of cRNA were analyzed by GeneQuant pro RNA/DNA Calculator (Amersharmacia biotech).
RNA preparation and T7-based RNA amplification Total RNA was isolated from the dissected specimens using Trizol reagent (Gibco BRL) and a modified acidic guanidinium phenol-chloroform method, following the manufacturer’s recommendations. Total RNA was treated with DNaseⅠfor removal of genomic DNA, and the mRNA was purified using a poly(A) purification kit (Oligotex, Qiagen), according to the manufacturer’s
Microarray hybridization and scanning Human Cancer Chip version 4.0 (IntelliGene, TaKaRa) was used for these studies. This array was spotted on a glass slide with 886 cDNA fragments of human genes, which are composed of 588 human identified genes related to cancer, and 298 cDNA fragments prescreened by differential display method between cancer tissue and normal tissue. Three μg of cRNA from the tumor and www.wjgnet.com
6074
ISSN 1007-9327
CN 14-1219/R
World J Gastroenterol
October 21, 2008 Volume 14
Number 39
Table 2 Primers used to amplify cDNA at various genes in real time RT-PCR Target gene
Objective
Forward primer sequence (5'-3')
Reverse primer sequence (3'-5')
RPS5 KRT8 CFLAR ATP5F1 IGFBP2 MAP3K5 MMP9 VIM ACTB GAPD CD58
qRT-PCR qRT-PCR qRT-PCR qRT-PCR qRT-PCR qRT-PCR qRT-PCR qRT-PCR qRT-PCR qRT-PCR qRT-PCR
GTATGCCGCCAAACGCTTC GGAGGCATCACCGCAGTTAC GACAGAGCTTCTTCGAGACAC ACTGGGCTTATCTTGTACGCT GACAATGGCGATGACCACTCA AAAAAGGCATTTGAATCTGAGCC GGGACGCAGACATCGTCATC AGTCCACTGAGTACCGGAGAC CATGTACGTTGCTATCCAGGC CAACTGGTCGTGGACAACCAT CTCATGGGATTGTCCTATGGAGC
CGCCTGTGAGCAGGTGTAT GGTTGGCAATATCCTCGTACTGT GCTCGGGCATACAGGCAAAT GCAAAGTCTGCAACAAAGGGA GCTCCTTCATACCCGACTTGA GCTTGAATGACTCTCATGTGGTC TCGTCATCGTCGAAATGGGC CATTTCACGCATCTGGCGTTC CTCCTTAATGTCACGCACGAT GCACGGACACTCACAATGTTC GCTTGGGATACAGGTTGTCAAA
the matched normal tissue were labeled with Cy3-dUTP and Cy5-dUTP respectively (Amersham Pharmacia Biotech, Buckinghamshire, England), using a labeling kit (RNA Fluorescence Labeling Core kit, TaKaRa), according to the manufacturer’s instructions. The labeled probe was purified by centrifugation in a spin column (Centrisep, Princeton Separations, Adelphia, NJ). Two separate probes were combined, and 2 μL of 5 × competitor containing CotⅠ(Gibco BRL), poly dA (Amersham Pharmaca Biotech), and tRNA (TaKaRa) were added. After addition of 50 μL of 100% ethanol and 2 μL of 3 mol/L sodium acetate (pH 5.2), the mixture was cooled at -80℃ for 30 min, followed by centrifugation at 15 000 g for 10 min, and pelleted down. For final probe preparation, the pellet was washed in 500 μL of 70% ethanol twice, and eluted in 10 μL hybridization buffer (6 × SSC, 0.2% SDS, 5 × Denhardt's solution, 0.1 mg/mL salmon sperm solution). The probe were denatured by heating for 2 min at 95℃, cooled at room temperature, and centrifuged at 15 000 g for 10 min (20-26℃). Supernatants were placed on the array and covered with a 22-mm × 22-mm glass coverslip. The coverslip was sealed with a glue, and the probes were incubated overnight at 65℃ for 16 h in a custom-made slide chamber with humidity maintained by underlying moist papers. After hybridization, the slides were washed in 2 × SSC with 0.1% SDS, 1 × SSC, and 0.05 × SSC, sequentially for 1 min each, and then spin dried. Hybridized arrays were scanned using a confocal laser-scanning microscope (Affymetrix 428 array scanner, Santa Clara, CA). Image analysis and quantification were performed with ImaGene 4.2 software (BioDiscovery), according to the manufacture’s instructions. Data processing Each spot was defined by manual positioning of a grid of circles over the array image. For each fluorescent image, the average pixel intensity within each circle was determined, and a local background, outside of 3 pixel buffer range from the circle was computed for each spot. Net signal was determined by subtraction of the local background from the average intensity of each spot. Signal intensities between the two fluorescent images were normalized by the intensities of the house-keeping genes provided on the arrays. The fluorescence intensities of Cy5 (non-tumor) and Cy3 (tumor) for each target www.wjgnet.com
Genebank accession no./Amplicon size NM_001009, 152 bp NM_002273, 637 bp AF009616, 116 bp NM_001688, 131 bp NM_000597, 121 bp NM_005923, 233 bp NM_004994, 139 bp AK093924, 98 bp NM_001101, 250 bp AC002389, 260 bp NM_001779, 154 bp
spot were adjusted so that the mean Cy3:Cy5 ratios of 32 housekeeping gene spots were equal to one. Because data derived from low signal intensities are less reliable, we first determined the cutoff values for signal intensities on each slide so that all of the filtered genes had greater S:N (signal to noise) ratios of Cy3 or Cy5 than three, and we excluded genes for further analysis when both Cy3 and Cy5 dyes gave signal intensities lower than the cutoff. To estimate the range of expression ratio within which the expression change could be considered as fluctuation in non-cancerous cells, we compared expression profiles of non-cancerous cells from 6 patients. Because 90% of expression ratios in non-cancerous cells fell within the range of 1.726 and 0.503, we categorized genes into three groups according to their expression ratios (Cy3: Cy5): up-regulated (ratio, 2.0); down-regulated (ratio 0.5); and unchanged expression (ratios, between 0.5 and 2.0); provided that signal counts of T (Cy3) and R (Cy5) were > 500. Genes with Cy3:Cy5 ratios > 2.0 or < 0.5 in more than 75% of the cases examined were defined as commonly up- or down-regulated genes, respectively. Real-time reverse transcription PCR LightCycler (Roche Diagnostics) technology was applied to confirm the data obtained by cDNA microarray. The primer sequences of 11 genes were obtained from the GDB Human Genome Database (http://www.gdb.org/ gdb/) (Table 2). We used the same RNA from the dissected cells for the microarray analysis. First-strand cDNA was obtained by reverse transcription using a commercially available kit (first strand synthesis kit, Amersham). For each PCR, 2 μL (20 ng) first strand cDNA template, 50 pmol of each primer, 2.4 μL (3 mmol) MgCl2, and 2 μ L 10 × SYBR GreenⅠ(Roche Laboratories)were mixed in 20 μL of PCR mixture. The running protocol was programmed as follows. In the first step, initial denaturation, reaction mixture was incubated for 10 min at 95℃. In the second step, DNA was amplified for 45 cycles at 95℃ for 10 s, specific annealing temperature (the primer sequences dependent) for 0-10 s, and elongation at 72℃ for some seconds [amplicon (bp)/25 s]. Finally, the temperature was raised gradually (0.2℃/s) from the annealing temperature to 95℃ for the melting curve analysis. Twelve μL of PCR product were visualized by electrophoresis on 2% agarose gel stained with ethidium bromide.
Lee CF et al . Gene expression patterns linked to virus type in HCC
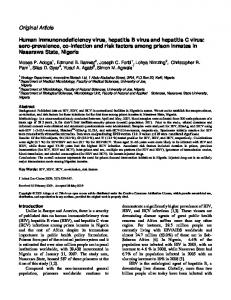
Figure 1 A representative of cDNA microarray expression pattern obtained from case 20. Up-, down-regulated and unchanged genes were indicated by red, green and blue spots, respectively.
The amount of gene expression was normalized to the amount of glyceraldehyde-3-phosphate dehydrogenase (GAPDH) using Human GAPDH kit (GmbH Heidelberg, Heidelberg, Germany). The qRT-PCR analysis was carried out in triplicate for each cDNA sample, and the median values were used for the three experiments. Upand down-regulation were defined as the median value > 2.0 and < 0.5, respectively. Statistical analysis Statistical analysis among mean values was performed on the association of lymph node metastasis with expression levels by applying non-parametric Kruskal-Wallis and Mann-Whitney U tests. Statistical significance was defined as a P-value of < 0.05. Differential expression between the groups of HBV-infected and HCV-infected HCC was considered significant, with P < 0.05.
RESULTS Quality analysis of total RNA after LCM and cRNA after T7-based amplification About 20 slides were prepared from each sample, and the target cells were captured with at least 1000 cells per slide. Consequently, we captured a total of approximately 25 000-30 000 tumor cells and normal cells for RNA extraction. The quality of total RNA extracted after LCM was assessed by A260/A280 and electrophoresis. To be considered for microarray analysis, the RNA samples were required to pass quality control criteria, with integrity of 28S and 18S, and A260/A280 greater than 2.0. Products of cDNA synthesis and cRNA were also checked by A260/A280 and electrophoresis. The results showed that A260/A280 of all the RNA samples met the quality control criteria for sample preparation. Clear image appearance of 28S and 18S of ribosomal RNA was seen under the electropherogram for each total RNA sample, which had to be intact and without degradation. RNA was subjected to two rounds of T7-based RNA amplification after removal of DNA contamination by RNase-free DnaseⅠtreatment as described in the methods section. All RNA samples were successfully amplified by an estimated 250-fold, using T7 RNA polymerase. cDNA synthesis and cRNA showed satisfactory quality control criteria, with 1.5 kb < cDNA < 5.0 kb; 1.0 kb < cRNA < 4.5 kb); and A260/A280 ratio of cDNA and cRNA greater than 2, respectively. Identification of genes related to HBV-positive or HCVpositive status After reverse transcription, each cDNA probe was labeled with Cy3- or Cy5-conjugated dyes and hybridized to microarray cDNAs with 886 genes. We compared the expression profiles of cancer cells and the corresponding normal cells in each case. A representative scatter plot of microarray analysis of carcinoma cells and non-cancerous tissue in case 20 (HCV-infected HCC) is shown in Figure 1. Up-regulated, down-regulated and unchanged genes are indicated by red, green and blue spots, respectively. We first arranged the relative expression of each gene (Cy3/Cy5 intensity ratio) into one of four categories:
6075
up-regulated (ratio > 2.0), down-regulated (ratio < 0.5), unchanged (ratio between 0.5 and 2.0), and not expressed (or slight expression but under the cutoff level for detection). To identify the genes related to HBV-positive and HCV-positive status, 32 patients were divided into two groups: HBV- associated HCC group in which HBV was positive in 17 patients, and HCV-associated HCC group in which HCV was positive in 15 patients (Table 1). When comparing gene expression profiles in the two groups, there were 7 genes that were commonly up-regulated, and expressed more than 2.09-fold in the HBV-infected group compared with in the HCV-infected group. On the other hand, 4 down-regulated genes in HBV-infected group correlated significantly with the HCV-infected group. Table 3 shows the list of differentially expressed genes and their respective category based on the GO (Gene Ontology) system and TreeView. The up-regulated genes in HBVinfected group were involved in protein synthesis (RPS5), cytoskeletal organization (KRT8), apoptosis related genes (CFLAR), transport (ATP5F1), cell membrane receptor related genes (IGFBP2), signal transduction or transcription related genes (MAP3K5), and metastasis-related genes (MMP9). The up-regulated genes in HCV-infected group included genes such as VIM (cell structure), ACTB (cell structure), GAPD (glycolysis) and CD58 (cell adhesion). Verification of the genes related to HBV- and HCV-associated HCC using quantitative RT-PCR To more quantitatively examine our data on hepatitis virus infection in HCC, we selected 7 up-regulated genes from the HBV-infected group, and 4 up-regulated genes from the HCV-infected group. The expression level of the selected genes was confirmed by quantitative RTPCR analysis in 32 patients. We used cDNA synthesized from 32 pair samples without amplification as template for real-time semiquantitative reverse transcription PCR. The results demonstrated that the samples obtained by means of T7-based amplification appropriately reflected the status of the original RNA in a proportional manner. The results of the DNA microarray were reproduced by reverse transcriptase PCR.
DISCUSSION Genome-wide gene expression analysis of human cancer www.wjgnet.com
6076
ISSN 1007-9327
CN 14-1219/R
World J Gastroenterol
October 21, 2008 Volume 14
Number 39
Table 3 The 11 genes for which expression levels differed between HBV- and HCV-associated HCC Gene name
Symbol1
Accession2
Fold change3
HBV:HCV4
RPS5 KRT8 CFLAR ATP5F1 IGFBP2 MAP3K5 MMP9
NM_001009 NM_002273 Y14039 X60221 NM_000597 NM_005923 NM_004994
6.35 5.68 2.86 4.11 3.37 3.76 7.43
2.38 3.19 2.09 3.52 2.49 2.33 3.74
VIM ACTB GAPD CD58
NM_003380 X00351 NM_002046 NM_001779
8.61 4.13 5.27 4.68
0.28 0.37 0.29 0.31
7 genes up-regulated in HBV-associated HCC Ribosomal protein S5 Keratin 8 CASP8 and FADD-like apoptosis regulator ATP synthase, H+transporting, mitochondrial F0 complex, subunit b, isoform 1 Insulin-like growth factor binding protein 2 (36 kDa) Mitogen-activated protein kinase kinase kinase 5 Matrix metalloproteinase 9 (gelatinase B, 92 kDa gelatinase, 92 kDa type Ⅳ collagenase) 4 genes up-regulated in HCV-associated HCC Vimentin Actin-β Glyceraldehyde-3-phosphate_dehydrogenase CD58 antigen, (lymphocyte function-associated antigen 3) 1
Symbol in LocusLink database; 2GeneBank accession number; 3Fold change, ratio of mean expression values in HBV- or HCV-associated cases (cancer cells vs non-cancerous cells); 4HBV:HCV ratio of mean expression values (HBV positive cases to HCV positive cases).
may provide important clues in understanding HCC oncogenesis and may lead to improvement in predicting its clinical behavior [12]. Using cDNA microarray, we examined the difference in gene expression profiles between normal liver tissues and HCC cells, as well as between HBV positive and HCV-associated HCC. The data from cDNA microarray are consistent with RTPCR data from HCC tissues and the corresponding nontumor tissues. These expression profiles may be useful in elucidating the molecular carcinogenesis of HCC, especially HBV- and HCV-associated HCC. In the present study, we attempted to establish a link between gene expression and the viral status of HCC. Comparative analysis of HBV- and HCV-associated HCC revealed that 11 genes, for which the expression levels differed between HBV- and HCV-associated HCC. Ribosomal-related genes such as RPS5 (RPL family genes) were up-regulated in HBV-associated HCC compared to HCV-associated HCC, suggesting the activation of protein translation in HBV-infected HCC. This observation is consistent with a previous report that major classes of genes encoding ribosomal proteins were up-regulated by the HBX protein[13]. Cytoskeletal organization, such as KRT8 was shown to be up-regulated in HBV-associated HCC, as well as genes such as ACTB in HCV-associated HCC. Our results support the hypothesis that the deregulation of genes encoding proteins associated with cytoskeleton play a role in liver carcinogenesis[14]. These findings also indicate that the pathway for liver carcinogenesis in the cytoskeleton may be different in HBV- and HCVassociated HCC. Cell adhesion genes such as CD58 were found to be up-regulated in HCV-associated HCC, but have not been reported to be related with human HBVassociated HCC. Xu et al[15] showed that several signal transduction related genes, including MAPK family genes were up-regulated in HBV-associated HCC. Up-regulation of MAPK has also been suggested as a common pathway for hepatocarcinogenesis caused by HBV and HCV infections[16]. In the present study, MAP3K5 was up-regulated in HBV-associated HCC compared with the non-tumorous liver tissue. However, MAP3K5 was down-regulated www.wjgnet.com
in HCV-associated HCC compared with the non-tumorous liver. Thus, additional studies are necessary to clarify the contribution of the MAPK pathway to each type of HCC. MMP9, which may promote metastasis, was upregulated in HBV-associated HCC compared with HCVassociated HCC. Other genes such as IGFBP2, ATP5F1, VIM and GAPD, which are expressed differently in HBVand HCV-associated HCC, were newly identified, although the findings of up-regulation of genes such as IGFBP2 and ATP5F1 in the HBV-associated HCC, and the upregulation of genes such as VIM and GAPD in the HCVassociated HCC, were in agreement with previous observations[17]. It has been suggested that liver carcinogenesis induced by HBV and HCV, in addition to common genetic and epigenetic alterations, may involve distinct pathways[18]. Our expression profiles suggest that hepatitis viruses affect the expression of dozens of genes in HCC in a type-specific manner, thus invoking slightly different mechanisms of carcinogenesis. We believe that the results obtained in the present study will help our understanding of the molecular mechanisms underlying the pathogenesis of HBV- and HCV-associated HCC. The identification of genes defining virus type-specific expression profiles may contribute to our ability to develop virus type-dependent treatment regimens.
COMMENTS COMMEMTS Background
Hepatocellular carcinoma (HCC) is one of the most common fatal cancers worldwide. The major risk factors for HCC are chronic hepatitis resulting from infection with hepatitis B virus (HBV) and hepatocellular carcinoma (HCC), and exposure to various exogenous carcinogens, including aflatoxin B1. It has been reported that the incidence of HCC is increasing in several countries in parallel with the increase in chronic HBV and HCV infections. Therefore, clarification of the genetic portraits of hepatocarcinogenesis caused by HBV and HCV infection may provide clues to reducing the incidence of HCC, and establishing effective treatments for each type of HCC. However, the molecular nature of this association is poorly understood.
Research frontier
The aim of the present study was to identify any useful biomarkers indicating virus-specific hepatocarcinogenic process. The differential mRNA expression in 32 patients with HBV-/HCV-associated HCC was investigated by means of
Lee CF et al . Gene expression patterns linked to virus type in HCC cDNA microarrays comprising of 886 genes.
Innovations and breakthroughs
It has been suggested that liver carcinogenesis induced by HBV and HCV, in addition to common genetic and epigenetic alterations, may involve distinct pathways. The results of the present study suggest that hepatitis viruses affect the expression of dozens of genes in HCC in a type-specific manner, thus invoking slightly different mechanisms of carcinogenesis. Genome-wide gene expression analysis of human cancer may provide important clues to understanding HCC oncogenesis and lead to improvements in predicting its clinical behavior.
Applications
We believe that the results obtained in this study will provide greater understanding of the molecular mechanisms underlying the pathogenesis of HBVand HCV-associated HCC. The identification of genes defining virus typespecific expression profiles may contribute to our ability to develop virus typedependent treatment regimens.
Terminology
DNA microarray is a meticulous technology used in molecular biology and in the field of biomedicine. This technique involves an arrayed series of thousands of microscopic spots of DNA oligonucleotides. It may involve a short section of a gene or other DNA elements that are used as probes to hybridize cDNA or cRNA samples (called target) under high-stringency conditions. Probe-target hybridization is usually detected and quantified by fluorescence-based detection of fluorophore-labeled targets to determine relative abundance of nucleic acid sequences in the target.
Peer review
This is a nice study on the changes in the expression patterns in cancer liver tissue associated with two different hepatitis viruses involved in hepatocarcinogenesis. The paper is well written and contains valuable data. The authors, using microarray technology, have compared gene expression between cancerous and non-cancerous liver tissue in both HBV and HCV infected patients. Seven genes were up-regulated in HBV and 4 genes, which were different, were up-regulated in HCV infected patients.
REFERENCES 1 2 3 4 5 6
7
El-Serag HB, Mason AC. Rising incidence of hepatocellular carcinoma in the United States. N Engl J Med 1999; 340: 745-750 Kasai Y, Takeda S, Takagi H. Pathogenesis of hepatocellular carcinoma: a review from the viewpoint of molecular analysis. Semin Surg Oncol 1996; 12: 155-159 Parkin DM, Pisani P, Ferlay J. Global cancer statistics. CA Cancer J Clin 1999; 49: 33-64, 1 Okuda K, Fujimoto I, Hanai A, Urano Y. Changing incidence of hepatocellular carcinoma in Japan. Cancer Res 1987; 47: 4967-4972 Lee WM. Hepatitis B virus infection. N Engl J Med 1997; 337: 1733-1745 Perou CM, Jeffrey SS, van de Rijn M, Rees CA, Eisen MB, Ross DT, Pergamenschikov A, Williams CF, Zhu SX, Lee JC, Lashkari D, Shalon D, Brown PO, Botstein D. Distinctive gene expression patterns in human mammary epithelial cells and breast cancers. Proc Natl Acad Sci USA 1999; 96: 9212-9217 Alizadeh AA, Eisen MB, Davis RE, Ma C, Lossos IS, Rosenwald A, Boldrick JC, Sabet H, Tran T, Yu X, Powell JI, Yang L, Marti GE, Moore T, Hudson J Jr, Lu L, Lewis DB, Tibshirani R, Sherlock G, Chan WC, Greiner TC,
8
9
10
11 12 13
14
15
16
17
18
6077
Weisenburger DD, Armitage JO, Warnke R, Levy R, Wilson W, Grever MR, Byrd JC, Botstein D, Brown PO, Staudt LM. Distinct types of diffuse large B-cell lymphoma identified by gene expression profiling. Nature 2000; 403: 503-511 Perou CM, Sorlie T, Eisen MB, van de Rijn M, Jeffrey SS, Rees CA, Pollack JR, Ross DT, Johnsen H, Akslen LA, Fluge O, Pergamenschikov A, Williams C, Zhu SX, Lonning PE, Borresen-Dale AL, Brown PO, Botstein D. Molecular portraits of human breast tumours. Nature 2000; 406: 747-752 Ross DT, Scherf U, Eisen MB, Perou CM, Rees C, Spellman P, Iyer V, Jeffrey SS, Van de Rijn M, Waltham M, Pergamenschikov A, Lee JC, Lashkari D, Shalon D, Myers TG, Weinstein JN, Botstein D, Brown PO. Systematic variation in gene expression patterns in human cancer cell lines. Nat Genet 2000; 24: 227-235 Welsh JB, Zarrinkar PP, Sapinoso LM, Kern SG, Behling CA, Monk BJ, Lockhart DJ, Burger RA, Hampton GM. Analysis of gene expression profiles in normal and neoplastic ovarian tissue samples identifies candidate molecular markers of epithelial ovarian cancer. Proc Natl Acad Sci USA 2001; 98: 1176-1181 Honda M, Kaneko S, Kawai H, Shirota Y, Kobayashi K. Differential gene expression between chronic hepatitis B and C hepatic lesion. Gastroenterology 2001; 120: 955-966 Iizuka N, Hamamoto Y, Tsunedomi R, Oka M. Translational microarray systems for outcome prediction of hepatocellular carcinoma. Cancer Sci 2008; 99: 659-665 Wu CG, Forgues M, Siddique S, Farnsworth J, Valerie K, Wang XW. SAGE transcript profiles of normal primary human hepatocytes expressing oncogenic hepatitis B virus X protein. FASEB J 2002; 16: 1665-1667 Le Bail B, Faouzi S, Boussarie L, Balabaud C, Bioulac-Sage P, Rosenbaum J. Extracellular matrix composition and integrin expression in early hepatocarcinogenesis in human cirrhotic liver. J Pathol 1997; 181: 330-337 Xu XR, Huang J, Xu ZG, Qian BZ, Zhu ZD, Yan Q, Cai T, Zhang X, Xiao HS, Qu J, Liu F, Huang QH, Cheng ZH, Li NG, Du JJ, Hu W, Shen KT, Lu G, Fu G, Zhong M, Xu SH, Gu WY, Huang W, Zhao XT, Hu GX, Gu JR, Chen Z, Han ZG. Insight into hepatocellular carcinogenesis at transcriptome level by comparing gene expression profiles of hepatocellular carcinoma with those of corresponding noncancerous liver. Proc Natl Acad Sci USA 2001; 98: 15089-15094 Okabe H, Satoh S, Kato T, Kitahara O, Yanagawa R, Yamaoka Y, Tsunoda T, Furukawa Y, Nakamura Y. Genomewide analysis of gene expression in human hepatocellular carcinomas using cDNA microarray: identification of genes involved in viral carcinogenesis and tumor progression. Cancer Res 2001; 61: 2129-2137 Yoon SY, Kim JM, Oh JH, Jeon YJ, Lee DS, Kim JH, Choi JY, Ahn BM, Kim S, Yoo HS, Kim YS, Kim NS. Gene expression profiling of human HBV- and/or HCV-associated hepatocellular carcinoma cells using expressed sequence tags. Int J Oncol 2006; 29: 315-327 Delpuech O, Trabut JB, Carnot F, Feuillard J, Brechot C, Kremsdorf D. Identification, using cDNA macroarray analysis, of distinct gene expression profiles associated with pathological and virological features of hepatocellular carcinoma. Oncogene 2002; 21: 2926-2937 S- Editor Tian L L- Editor Anand BS E- Editor Ma WH
www.wjgnet.com