Cognitive, Affective, & Behavioral Neuroscience 2007, 7 (3), 251-259
Distinct mechanisms in visual category learning Joe DeGutis and Mark D’Esposito
University of California, Berkeley, California The ways in which visual categories are learned, and in which well-established categories are represented and retrieved, are fundamental issues of cognitive neuroscience. Researchers have typically studied these issues separately, and the transition from the initial phase of category learning to expertise is poorly characterized. The acquisition of novel categories has been shown to depend on the striatum, hippocampus, and prefrontal cortex, whereas visual category expertise has been shown to involve changes in inferior temporal cortex. The goal of the present experiment is to understand the respective roles of these brain regions in the transition from initial learning to expertise when category judgments are being made. Subjects were explicitly trained, over 2 days, to classify realistic faces. Subjects then performed the categorization task during fMRI scanning, as well as a perceptual matching task, in order to characterize how brain regions respond to these faces when not explicitly categorizing them. We found that, during face categorization, face-selective inferotemporal cortex, lateral prefrontal cortex, and dorsal striatum are more responsive to faces near the category boundary, which are most difficult to categorize. In contrast, the hippocampus and left superior frontal sulcus responded most to faces farthest from the category boundary. These dissociable effects suggest that there are several distinct neural mechanisms involved in categorization, and provide a framework for understanding the contribution of each of these brain regions in categorization.
A fundamental function of cognition is to interpret a wide range of sensory inputs in terms of a limited number of meaningful, abstracted categories. These categories greatly reduce the amount of information we have to process and are the foundation for perception and memory. Studies have focused on the initial learning of visual categories (Ashby & Maddox, 2005; Seger & Cincotta, 2005a) and the retrieval and representation of well-established categories (Gauthier, Skudlarski, Gore, & Anderson, 2000; Gauthier, Tarr, Anderson, Skudlarski, & Gore, 1999). However, the neural basis of the transition from initial learning to category expertise is poorly understood. In the present study, we sought to better characterize this transition by studying how recently learned visual categories are represented and retrieved. Categories can be learned explicitly or in a procedural manner, and the neural mechanisms involved in category learning depend on the strategy utilized (Aizenstein et al., 2000; Reber, Gitelman, Parrish, & Mesulam, 2003; Seger & Cincotta, 2005a, 2005b). According to Ashby’s (2006) COVIS (competition between verbal and implicit systems) model, when the rule that separates categories can be verbalized, brain regions supporting working memory that include prefrontal cortex (PFC) and the head of the caudate nucleus are implicated. In contrast, when the category rule is not verbalizable, a procedural system that depends on the tail of the caudate nucleus is involved. Neuroimaging studies have supported this model, demonstrating greater PFC activity during explicit than during implicit category learning (Aizenstein et al., 2000) and
during retrieval of explicitly learned categories (Reber et al., 2003). In addition, the striatum has proven to be important for both implicit and explicit category learning (Seger & Cincotta, 2005a, 2005b). In particular, the body and tail of the caudate and putamen are associated with successful learning; the head of the caudate nucleus is important for executive functions in explicit learning tasks and for feedback processing in implicit learning tasks. In addition to PFC and striatum, the hippocampus has been shown to be important for category learning and applying category rules. Hippocampal damage can impair initial category learning (Hopkins, Myers, Shohamy, Grossman, & Gluck, 2004), although some category learning tasks can be performed without an intact hippocampus (Knowlton, Squire, & Gluck, 1994). Neuroimaging studies demonstrate that the hippocampus is more active when categories are learned using an explicit, declarative strategy than when an implicit, procedural strategy is utilized (Aizenstein et al., 2000). In addition to playing a role in learning, the hippocampus has been shown to be important for applying category knowledge (Bunge, 2004; Myers et al., 2002) and may be involved in consolidating explicitly learned category knowledge (Ashby & Valentin, 2005). Inferior temporal cortex (ITC) is also integral to visual categorization. Damage to ITC severely impairs the recognition of well-established categories such as faces, tools, and fruit (Warrington, 1982), and neuroimaging studies demonstrate distinct ITC regions selective to categories such as faces (fusiform face area [FFA]—
J. DeGutis,
[email protected]
251
Copyright 2007 Psychonomic Society, Inc.
252 DeGutis and D’Esposito Kanwisher, McDermott, & Chun, 1997; occipital face area [OFA]—Gauthier, Tarr, et al., 2000), scenes (Epstein & Kanwisher, 1998), and body parts (Downing, Jiang, Shuman, & Kanwisher, 2001). In addition to being active in representing and retrieving well-established categories, ITC responses have been shown to be modifiable by extensive category training (Gauthier et al., 1999; Sigala & Logothetis, 2002). Gauthier et al. (1999) demonstrated increased activity in the middle fusiform gyrus after 2 weeks of classification training with novel objects (“greebles”), suggesting that category expertise leads to increases in ITC activity. Sigala and Logothetis demonstrated that, after 9 months of training, ITC neurons in monkeys were more active to stimulus features that were diagnostic to making a category judgment than to those that were not diagnostic. Thus, ITC is important for representing wellestablished categories and is modifiable by extensive category training. Interactions between ITC and PFC may also be particularly important to visual categorization and perceptual decision making. PFC has strong reciprocal inputs with ITC (Petrides & Pandya, 2002). Freedman, Riesenhuber, Poggio, and Miller (2003) recorded from ITC and PFC neurons simultaneously during visual categorization. Their recordings demonstrated responses in ITC that were earlier and driven more by stimulus analysis, whereas PFC responses occurred later and were driven more by the behavioral consequence of the stimulus. Bottom-up inputs from ITC have been demonstrated to be integrated in the PFC—in particular, the superior frontal sulcus (SFS)—in order to facilitate successful perceptual decision (Heekeren, Marrett, Bandettini, & Ungerleider, 2004). In addition, PFC has been shown to provide topdown inputs to ITC (Moore & Armstrong, 2003; Tomita, Ohbayashi, Nakahara, Hasegawa, & Miyashita, 1999), and neuroimaging studies suggest that PFC modulates activity in stimulus-specific ITC regions (Gazzaley, Cooney, McEvoy, Knight, & D’Esposito, 2005; O’Craven, Downing, & Kanwisher, 1999). Thus, top-down and bottom-up interactions between ITC and PFC are likely important to making visual category judgments. The goal of this study is to assess the specific roles of the striatum, hippocampus, ITC, and PFC in the transition from initial learning to expert performance. Because ITC has highly characterized regions selective to processing faces, we used faces as the categorization stimuli and assessed categorization-related activity in these regions. Varying features of realistic faces, we designed a visual categorization task with a wide range of performance— from 100% on extreme stimuli far from the category boundary to near chance on stimuli near the category boundary. In an effort to determine whether different neural mechanisms are involved in classifying stimuli with weak versus strong category associations, we compared neural activity in well-trained subjects during categorization of stimuli close to the category boundary (i.e., with feature values least diagnostic to making a category decision) and stimuli far from the category boundary (i.e., with feature values most diagnostic to making a category decision). To determine whether these neural mechanisms
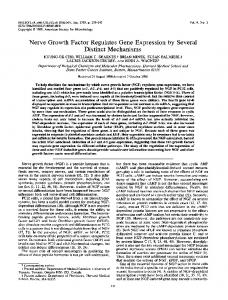
are automatically elicited by the training stimuli or their involvement is specific to the categorization task, we had subjects perform a perceptual matching task with training stimuli and then compared responses for stimuli close to and far from the category boundary. METHOD Subjects Ten right-handed subjects ranging in age from 19 to 31 years (M 5 22.9) were recruited from the University of California at Berkeley. All the subjects were screened for medical, neurological, and psychiatric illnesses and for use of prescription medications. All gave written informed consent prior to participation in the study according to the procedures approved by the university’s Committee for Protection of Human Subjects. Stimuli Lifelike faces were created from the FACES (Version 3.0; Cote, 1998) composite face-making software. Using an average adult white male face as a template, eye separation, nose height, forehead height, and mouth size were parametrically varied (in 1-mm increments) to make 30 faces (see Figure 1). Eye separation, with five values, and nose length, with six values, were relevant to making a category judgment. The category boundary was determined so that faces with wider eyes and longer noses were in the first category and faces with narrower eyes and shorter noses were in the second category. Mouth size (five values) and forehead height (six values) were assigned to each face independent of eye width and nose length and were not relevant to making a category judgment. Behavioral Tasks The subjects were trained on all 30 faces. Before category training on Day 1, the subjects were explicitly told the category rule: “Faces with wider eyes and longer noses are in Category 1, whereas faces with narrower eyes and shorter noses are in Category 2.” The subjects were given feedback of their reaction times (RTs) and accuracy and were reminded of the rule after each 180-trial session. On the 1st day, the subjects performed 540 trials with breaks every 180 trials. During a trial, the subject saw a face for 3 sec. A category response (“1” or “2”) was made during the first 2 sec, and feedback (“correct” or “incorrect,” displayed on the computer screen) was provided during the last second. There was a 500-msec intertrial interval (ITI), during which the subjects were instructed to fixate a cross at the center of the screen. On Day 2, the subjects performed 720 additional trials with the same protocol. On Day 3, the subjects performed tasks in the MRI scanner. While in the scanner, the subjects performed the same categorization task used in training, but with the following changes: (1) Faces were displayed for 2 sec instead of 3 sec, (2) the subjects were not given feedback, and (3) ITIs lasted 4 (50%), 6 (25%), or 8 (25%) sec to allow the characterization of the hemodynamic response. The subjects performed five runs of 60 categorization trials each. Each run lasted 7 min 50 sec. After the categorization task, the subjects performed two runs of a perceptual matching task (one-back task) and one run of a visuomotor response task. In the one-back task, the subjects were shown 16-sec blocks of novel faces, novel scenes (courtesy of Nancy Kanwisher, September 2002), the six practiced faces farthest from the category boundary (Faces 5, 6, 12, 19, 25, and 26—see Figure 1), the six practiced faces closest to the category boundary (Faces 8, 9, 15, 16, 22, and 23—see Figure 1), or a blank display (see Figure 2). During each block, 20 images were shown for 300 msec each, with a 500-msec fixation cross displayed between images. To keep the subjects’ attention focused on the images throughout the task, the subjects were instructed to press both thumbs on the response pad when the current image was the same as the image immediately preceding it. (On average, one response was required for each block
Distinct Mechanisms in Visual Category Learning 253
Category 1
Nose Length
Long
Short
1
7
13
19
25
2
8
14
20
26
3
9
15
21
27
4
10
16
22
28
5
11
17
23
29
6
12
18
24
30
Narrow
Wide
Eye Separation
Category 2
Figure 1. Face stimuli were constructed from a template face by parametrically varying nose length and eye separation. Subjects were instructed to integrate both features to make a category judgment. Mouth size and forehead height were also varied, but did not provide category information.
Face Categorization Task
...
+
2 sec, category button response
4-, 6-, or 8sec ITI
One-Back Task Novel Faces 500 msec
Most Difficult-toCategorize Faces
Easiest-toCategorize Faces
Scenes 500 msec
500 msec
Fixation
500 msec +
300 msec
+
300 msec
+
500 msec
500 msec
12
16
20
24
28
32
36
40
44
48
...
8
500 msec
...
4
+
300 msec
500 msec
...
... 0
+
300 msec
52
56
60
64
68
72
76
80
Block Time (sec) Figure 2. During fMRI scanning, subjects performed five runs of the face categorization task and two runs of the one-back task. The face categorization task was identical to the training task except that no feedback was provided. The one-back task was performed on blocks of novel faces, novel scenes, the six easiest-to-categorize faces (Faces 5, 6, 12, 19, 25, and 26—see Figure 1), and the six most difficult-to-categorize faces (Faces 8, 9, 15, 16, 22, and 23—see Figure 1).
254 DeGutis and D’Esposito of images.) Each of the two runs lasted 5 min 20 sec and contained five blocks for each condition. During the visuomotor response task, the subjects pressed both thumbs on the response pad in response to a brief flashing checkerboard displayed every 16, 18, or 20 sec. This run lasted 6 min 38 sec and was used to derive each subject’s estimated hemodynamic response function (HRF; Aguirre, Zarahn, & D’Esposito, 1998). Strategy Analysis of Categorization Performance During fMRI To assess the strategies that the subjects used during the categorization task in the scanner, we fit two models to the subjects’ accuracy data: the general linear classifier (GLC) model and a conjunction model (for a description, see Ashby, 1992). The GLC model assumes that the decision boundary between the categories is linear and requires the integration of eye width and nose length on each trial. This was the strategy that the subjects were instructed to use. We also fit a conjunction model to the subjects’ data to determine whether any of them had used an alternative strategy. The conjunction model we tested assumes that subjects integrate eye width and nose length, but that they learn stimuli in only one quadrant of the matrix rather than learning the decision boundary. For example, subjects may learn to respond “1” if a face has both wide eyes and a long nose and “2” to the rest of the stimuli, and still achieve accuracy above 80%. Each model was fit separately to the data for every subject. (For a more in-depth description of the methods used to derive the model fits, see Ashby, 1992; Ashby & Maddox, 2005.) MRI Acquisition and Processing Functional images were acquired from a Varian INOVA 4 Tesla scanner using a gradient echoplanar sequence (time to repeat 5 2,000 msec, TE 5 28 msec, matrix size 5 64 3 64, field of view 5 22.4 cm) sensitive to BOLD contrast. Each functional volume consisted of 18 3 5‑mm-thick axial slices with 0.5-mm gaps between slices. The voxel size was 3.5 3 3.5 mm. These parameters provided coverage of the whole brain except for portions of the inferior cerebellum and the most superior extent of the parietal lobe. The areas of susceptibility loss included regions in the orbitofrontal cortex and anterolateral portions of the middle temporal gyrus. For each scan, 30 sec of gradient and radiofrequency pulses preceded data acquisition to allow steady-state tissue magnetization. Initial data preparation included image reconstruction; motion correction using a six-parameter, rigid-body, least-squares alignment; and normalization of the time series of each voxel by its mean signal value to attenuate between-run scaling differences. Because data were averaged within functionally defined regions of interest (ROIs), the data were not spatially smoothed. fMRI Data Analysis Activation corresponding to each trial type was assessed using multiple regression. For the categorization analyses, four covariates were used to model the fMRI data: one covariate for the 5 faces farthest from the boundary in Category 1 (Faces 13, 19, 20, 25, and 26; see Figure 1), one covariate for the 5 faces farthest from the boundary in Category 2 (Faces 5, 6, 11, 12, and 18), one covariate for the 10 boundary faces (Faces 1, 2, 8, 9, 15, 16, 22, 23, 29, and 30), and one covariate for the remaining 10 faces. Faces 4 and 27 were not included in the far-from-boundary covariates because the classification performance on these faces was poor (mean accuracy 5 .835) in comparison to the other faces far from the boundary (mean accuracy 5 .97). Results of analyses in which these faces were included were not different from the present results. To assess the effects of RT on activity, a median split was performed on the 10 faces closest to the category boundary and the 10 faces farthest from the boundary. Specifically, for the 5 faces farthest from the boundary in Category 1, the faster half of the trials were used for one covariate and the slower half served as a separate covariate. This process of splitting long and short RTs was repeated for the 5 faces farthest from the boundary in Category 2 and the
10 faces closest to the boundary in both categories. For this analysis, we modeled 6 covariates: Category 1 slow, Category 1 fast, Category 2 slow, Category 2 fast, boundary slow, and boundary fast. For the one-back task analyses, four covariates were used to model the fMRI data: one covariate for novel faces, one covariate for novel scenes, one covariate for the practiced faces farthest from the boundary (Faces 5, 6, 12, 19, 25, and 26), and one covariate for the practiced faces closest to the boundary (Faces 8, 9, 15, 16, 22, and 23). In each model, additional nuisance covariates were included to model an intercept and trial-specific baseline shifts. The convolution matrix included a time-domain representation of the expected 1/f power structure and filters to remove frequencies at and above the Nyquist frequency (0.25 Hz) and below 0.02 Hz (the portions of highest power in the noise spectrum). Covariates modeling BOLD responses for each subject during each trial were derived by convolving the vector of expected neural activity with an individually derived HRF. Subject-specific HRFs were used, rather than a single canonical HRF, because prior work has demonstrated substantial intersubject variability in the shape of the HRF (Aguirre, Zarahn, & D’Esposito, 1997). For each subject, parameter estimates yielded by the GLM were extracted for each covariate and averaged within each ROI (see below). These parameter estimates served as the dependent measures for acrosssubjects random effects analyses. Region-of-Interest Analyses For each individual subject, we defined 10 ROIs: FFA, OFA, head of the caudate, body of the caudate, putamen, anterior hippocampus, posterior hippocampus, dorsal PFC, ventral PFC, and SFS. Separate ROIs were defined for each hemisphere, and activity within each ROI was averaged across all voxels. For each subject, the FFA and OFA were functionally defined using contrast of novel faces minus scenes in the one-back task. The FFA was defined using the peak voxel in the middle fusiform gyrus that responded more to the faces-minus-scenes contrast and selecting the nine most significant voxels contiguous to the peak voxel. If the threshold had to be dropped below a t value of 1.5 to find the peak voxel, then this region was excluded. Using this method, we successfully localized the FFA in 9 of the 10 subjects (9 subjects had a right FFA, and 6 subjects had a left FFA). The same procedure was performed in the inferior occipital gyrus to define the OFA. We successfully localized the OFA in 9 of the 10 subjects (9 had a right OFA, and 6 had a left OFA). Because the dorsal and ventral PFCs encompassed many voxels (for right dorsal PFC, M 5 258.1 voxels, SD 5 60.3; for left dorsal PFC, M 5 289.3 voxels, SD 5 71.1; for right ventral PFC, M 5 203.0 voxels, SD 5 41.4; for left ventral PFC, M 5 213.5 voxels, SD 5 41.9), we limited the dorsal and ventral PFC ROIs to voxels that showed significantly greater activity during the categorization task than during baseline. The dorsal PFC was first defined anatomically as regions of the middle frontal gyrus corresponding to Brodmann’s areas 9 and 46, as defined in the atlas of Talairach and Tournoux (1988). Task-related statistical significance was determined after Bonferroni correction for the number of voxels in each mask (average t 5 3.8). We found that all 10 subjects had taskrelated dorsal PFC voxels (8 subjects had task-related right dorsal PFC voxels [M 5 32.6, SD 5 13.7] and 8 subjects had task-related left dorsal PFC voxels [M 5 17.2, SD 5 18.2]). This procedure was repeated for the ventral PFC. The ventral PFC was defined as regions of the inferior frontal gyrus corresponding to Brodmann’s areas 44, 45, and 47. We found that all 10 subjects had task-related ventral PFC voxels (10 subjects had task-related right ventral PFC voxels [M 5 25.8, SD 5 13.1], and 8 subjects had task-related left ventral PFC voxels [M 5 12.8, SD 5 5.4]). The remaining ROIs were not as expansive as those of the dorsal and ventral PFCs and were defined anatomically. The SFS ROI was defined as 2 voxels on either side of the SFS inferior to the supplementary motor area and superior to the superior extent of the lateral ventricles. This anatomically approximated the region described
Distinct Mechanisms in Visual Category Learning 255
RESULTS Behavioral Tasks Through training, the subjects improved at categorizing the faces farthest from the category boundary (most diagnostic faces) but did not improve at categorizing the faces closest to the category boundary (least diagnostic faces) (see Figure 3). For the most diagnostic faces, the subjects were significantly more accurate and obtained shorter RTs on the final training block than on the first training block [for accuracy, t(9) 5 4.29, p , .01; for RT, t(9) 5 3.56, p , .01]. However, for the least diagnostic faces, the subjects showed no significant differences in accuracy or RT between the first and final training blocks [for accuracy, t(9) 5 1.48, p . .17; for RT, t(9) 5 1.08, p . .31]. Consistent with the results of training, the behavioral results in the f MRI scanner demonstrated that subjects were faster and more accurate on faces farther from the category boundary than on those closer to the boundary while performing the task in the fMRI scanner. Specifically, performance on the 10 faces farthest from the category boundary (for accuracy, M 5 .97, SD 5 .02; for RT, M 5 1,464 msec, SD 5 87 msec) was significantly faster and more accurate than that on the 10 faces on the category boundary (for accuracy, M 5 .63, SD 5 .17; for RT, M 5 1,742 msec, SD 5 51 msec) [for RT, t(9) 5 7.82, p , .0001; for accuracy, t(9) 5 6.43, p , .0005]. Results of the strategy analysis of categorization accuracy during fMRI demonstrate that the subjects were learning a linear decision boundary between the two categories (following the task instructions) and not simply learning responses to one part of the face matrix. For all subjects, the GLC model fit the accuracy data better (mean sum of the squared error [MSSE] 5 0.96, SD 5 1.44) than did the conjunction model (MSSE 5 6.64, SD 5 1.19) [t(9) 5 8.84, p , .0001].
Least diagnostic faces Most diagnostic faces
Group Reaction Time (msec)
1,800 Day 1
1,700
Day 2
1,600 1,500 1,400 1,300 1,200 1,100 1,000
1
2
3
4
5
6
7
Training Session (180 Trials/Session) Least diagnostic faces Most diagnostic faces
Day 1
1.00
Day 2
.95 .90
Group Accuracy
by Heekeren et al. (2004). The average size of the right SFS was 84.5 voxels (SD 5 25.2), whereas the average size of the left SFS was 99.4 voxels (SD 5 31.0). For the striatum ROIs (head and body of the caudate and putamen), we used a procedure similar to that used by Seger and Cincotta (2005b) and limited our ROIs to the dorsal striatum, which is defined as superior to z 5 21 in the Talairach and Tournoux (1988) atlas. The average size of the right head of the caudate was 34.0 voxels (SD 5 5.5), whereas the average size of its left head was 38.7 voxels (SD 5 8.1). The average size of the right body of the caudate was 27.1 voxels (SD 5 6.0), whereas the average size of the left body was 27.8 voxels (SD 5 7.0). The average size of the right putamen was 44.0 voxels (SD 5 9.6), whereas the average size of the left putamen was 49.9 voxels (SD 5 12.1). The hippocampus ROI was also defined anatomically and was divided into anterior and posterior subregions using the distinction proposed by Schacter and Wagner (1999): Anterior hippocampus was anterior approximately to y 5 224 in Talairach and Tournoux (1988), whereas posterior hippocampus was posterior approximately to y 5 224. The average size of the right anterior hippocampus was 41.3 voxels (SD 5 10.5), whereas the average size of the left anterior hippocampus was 44.1 voxels (SD 5 10.0). The average size of the right posterior hippocampus was 35.3 voxels (SD 5 6.7), whereas the average size of the left posterior hippocampus was 36.5 voxels (SD 5 8.3).
.85 .80 .75 .70 .65 .60 .55 .50
1
2
3
4
5
6
7
Training Session (180 Trials/Session) Figure 3. Group reaction time (top) and accuracy (bottom) for pre-fMRI categorization training. The error bars indicate the standard error of the mean for the group during each session. Three training sessions were performed on Day 1, and four were performed on Day 2. The fMRI scan was performed on Day 3.
ROI Analyses During the categorization task, a comparison of faces far from the boundary and faces close to the boundary demonstrated a significant region 3 condition interaction [F(1,19) 5 49.92, p , .001], suggesting that these regions show different activation patterns to faces close to and far from the category boundary. In contrast, none of the ROIs showed a significant difference between Category 1 and Category 2 faces far from the category boundary in the categorization task [F(1,19) 5 0.81, p . .5]. In the oneback task, a comparison of faces far from the boundary and faces close to the boundary also demonstrated a significant region 3 condition interaction [F(1,19) 5 4.11, p , .05], suggesting different regional activity patterns. Inferotemporal face-selective regions. The results of the categorization task for right and left FFAs and OFAs are shown in Figure 4. The left FFA and right OFA exhibit
256 DeGutis and D’Esposito
Categorization Task Greater Activity to Least Diagnostic Faces
One-Back Task
Greater Activity to Most Diagnostic Faces
–0.3 –0.25 –0.2 –0.15 –0.1 –0.05
0
0.05
0.1
0.15
Greater Activity to Least Diagnostic Faces
0.2 –0.2 –0.15 –0.1 –0.05
Greater Activity to Most Diagnostic Faces 0
0.05
0.1
0.15
0.2
0.25
0.3
L OFA
**
R OFA
*
L FFA R FFA L Post. Hipp. R Post. Hipp.
*
*
L Ant. Hipp.
*
R Ant. Hipp. L Caudate Head R Caudate Head L Caudate Body R Caudate Body L Putamen
* *
R Putamen L Dorsal PFC
**
R Dorsal PFC L Ventral PFC
* **
R Ventral PFC
**
L SFS R SFS
CATEGORY 1
CATEGORY 1
Most Diagnostic
Di L ag ea no st st ic Most Diagnostic CATEGORY 2
Most Diagnostic
Di L a g ea no st st ic Most Diagnostic CATEGORY 2
Figure 4. fMRI region-of-interest group results. Plotted are the average differences between beta values for the most diagnostic and least diagnostic trials for all subjects. The error bars indicate the standard error of the mean of the difference between the two conditions. *p , .05. **Significant difference between the two means ( p , .01).
significantly greater activity to the faces closest to the category boundary than to those farthest from the boundary [for left FFA, t(5) 5 4.08, p , .01; for right OFA, t(8) 5 3.17, p , .05], and the right FFA shows a similar trend [t(8) 5 1.84, p 5 .10]. When trials were separated by RT, these three regions exhibited significantly more activity to faces with longer RTs than to faces with shorter RTs [for left FFA, t(5) 5 3.54, p , .05; for right FFA, t(8) 5 2.88, p , .05; for right OFA, t(8) 5 2.66, p , .05]. In the oneback task, blocks of the most diagnostic faces did not significantly differ from blocks of the least diagnostic faces for any of these face-selective regions (see Figure 4). This finding suggests that the categorization task effects are due to task-specific demands and not to bottom-up stimulus differences. Prefrontal cortex. The results of the categorization task for the PFC are shown in Figure 4. Similar to faceselective regions, bilateral dorsal and ventral PFC exhib-
ited significantly more activity to faces on the category boundary than to the faces far from the category boundary [for left dorsal PFC, t(7) 5 3.36, p , .01; for right dorsal PFC, t(7) 5 6.71, p , .001; for left ventral PFC, t(7) 5 2.47, p , .05; for right ventral PFC, t(9) 5 4.28, p , .005]. When trials were separated by RT, these regions exhibited significantly more activity to faces with longer RTs than to faces with shorter RTs [for left dorsal PFC, t(7) 5 4.37, p , .005; for right dorsal PFC, t(7) 5 7.90, p , .001; for left ventral PFC, t(7) 5 2.63, p , .05; for right ventral PFC, t(9) 5 8.59, p , .001]. Also, there were no significant differences between the blocks of the most and least diagnostic faces in the one-back task, suggesting that these effects are specific to the categorization task. In contrast to bilateral dorsal and ventral PFC, the left SFS exhibited significantly greater activity to the faces farthest from the category boundary than to those closest to the boundary [t(9) 5 4.47, p , .005]. This effect was
Distinct Mechanisms in Visual Category Learning 257 not driven by RT differences between trials; the left SFS exhibited similar activity during trials with short and with long RTs [t(9) 5 0.97, p . .35]. Also, there were no significant differences between the blocks of most diagnostic and least diagnostic faces in the one-back task, suggesting that these effects are specific to the categorization task and not due to bottom-up stimulus differences. Hippocampus. The right and left anterior hippocampus exhibited significantly greater activity to the faces farthest from the category boundary than to those on the category boundary [for left anterior hippocampus, t(9) 5 3.38, p , .01; for right anterior hippocampus, t(9) 5 2.47, p , .05]. These effects were not driven by RT differences between trials: The right and left anterior hippocampus did not show significant differences in activity between trials with short and with long RTs [for left anterior hippocampus, t(9) 5 0.04, p . .97; for right anterior hippocampus, t(9) 5 0.13, p . .90]. During the one-back task, the right anterior hippocampus did not exhibit a significant difference in activity between easy and difficult faces, but the left anterior hippocampus exhibited significantly greater activity to the most diagnostic faces than to the least diagnostic faces in the one-back task [t(9) 5 2.67, p , .05]. Dorsal striatum. Of all the dorsal striatum ROIs, only the left putamen showed a significant difference during the categorization task. The left putamen showed more activity to faces closest to the category boundary than to faces farthest from the category boundary [t(9) 5 2.29, p , .05]. The left putamen responded similarly on trials with short and with long RTs [t(9) 5 1.32, p . .22], suggesting that this effect is not driven by RT. Also, during the one-back task, the left putamen did not exhibit a significant difference in activity between most diagnostic and least diagnostic faces, showing that the effect in the left putamen is specific to the categorization task. DISCUSSION Our results demonstrate that, during face categorization, face-selective ITC, lateral PFC, and dorsal striatum are more responsive to faces near the category boundary, which are the most difficult to categorize. This effect on lateral PFC and ITC can be accounted for by increased duration of processing of the faces near the category boundary. However, RT differences did not account for the effects found in the left putamen. In contrast, the anterior hippocampus and left SFS responded most to faces farthest from the category boundary. These dissociable effects suggest that several distinct neural mechanisms are involved in making category judgments beyond initial learning, and provide a framework for understanding the contribution of each of these brain regions in categorization. The pattern of activity during the categorization task in dorsal and ventral PFC and face-selective ITC suggests that these regions are more involved in the making of difficult category decisions than in the making of easy ones. The RT analysis suggests that the effects on these regions are likely driven by an increase in duration of neural processing. Since there was no difference in lateral
PFC and face-selective activity between blocks of most diagnostic and least diagnostic faces in the one-back task, the increased duration of neural processing during the categorization task was due to the recruitment of a cognitive process specific to the categorization task. However, this process may not be specific to categorization per se, but rather may reflect the requirement for increased attentional resources when a category decision is difficult and not automatic. This notion is entirely consistent with other studies implicating a frontotemporal network in visual attention (Kanwisher & Wojciulik, 2000). Indeed, several recent studies have also shown that the dorsal and ventral PFC and face-selective regions exhibit increased activity during increased attentional demands (Druzgal & D’Esposito, 2001; Gazzaley et al., 2005; Ranganath, DeGutis, & D’Esposito, 2004). Moreover, Bar (2003) suggests that, when initial stimulus information is insufficient for recognition, top-down signals from the PFC are fed back to ITC to facilitate recognition. Thus, it is likely that the activity patterns in our study in PFC and ITC reflect this top-down facilitation mechanism. In contrast to dorsal and ventral PFC, the left SFS showed greater activity during categorization of the most diagnostic face stimuli than during that of the least diagnostic face stimuli. This effect was not driven by RT differences, which suggests that this region is more responsive during accurate category decisions than during decisions that are simply faster. This result is in line with a recent fMRI study showing that the left SFS is involved in general perceptual decision making (Heekeren et al., 2004). Heekeren et al. had subjects decide whether an image was a face or a house while viewing stimuli with different amounts of visual noise. Left SFS showed greater activity during trials with less visual noise, and activity in this region predicted correct judgments. In additional experiments, left SFS predicted correct responses during categorization of a variety of stimuli (e.g., categorizing a stimulus as red or green, judging whether dots are moving up or down) and with the use of different response modalities (e.g., buttonpresses, eye movements). This suggests that left SFS is involved in generally integrating perceptual information to execute a correct response. The present study extends these results by demonstrating that left SFS is involved in making discriminations not just between well-established categories, but also between novel perceptual categories. This suggests that the left SFS flexibly adapts to making perceptual decisions of newly defined categories. The anterior hippocampus also responded more to the most diagnostic faces during the categorization task and demonstrated a pattern of activity consistent with retrieving stimuli with stronger rather than weaker category associations. The results of the one-back task show that the response of the left anterior hippocampus to stimuli with strong category associations is not specific to the categorization task. Together, these observations suggest that the anterior hippocampus retrieves stimuli with strong category associations relatively automatically. The role of the hippocampus in automatically retrieving stimuli with strong category associations is consistent with a study
258 DeGutis and D’Esposito by Kreiman, Koch, and Fried (2000). They demonstrated category-selective responses in human hippocampal neurons when subjects passively viewed well-established categories such as faces, food, animals, and spatial layouts. This suggests that the hippocampus is involved in automatically retrieving stimuli from well-established categories. Our results further suggest that, as a category of stimuli becomes more well established, the hippocampus is more involved in retrieving the stimuli in that category. Future studies measuring hippocampal activity throughout extensive category training would be useful to further characterize the role of this region in retrieving categorical stimuli. This suggested involvement of the anterior hippocampus in category retrieval may be specific to declaratively learned categories. Reber et al. (2003) demonstrated that a similar left anterior hippocampus region was more active when subjects made category judgments on the basis of explicitly rather than implicitly learned material. Also, the involvement of the hippocampus in category retrieval may be due its greater role in utilizing category knowledge than in acquiring such knowledge. Seger and Cincotta (2005a) showed that the right anterior hippocampus was more active when subjects were executing an explicitly learned rule than when they were learning the category rule. This suggests that the anterior hippocampus is important for retrieving and utilizing explicitly learned categories, but that it may be less important for initially learning these categories or retrieving implicitly learned categories. Whereas the hippocampus shows an increased response to the most diagnostic stimuli (i.e., those farthest from the category boundary), the left putamen was more responsive to stimuli close to the category boundary. However, unlike the dorsal and ventral PFC and ITC, this effect is not driven by differences in duration of neural processing. Thus, the left putamen responds selectively to the category boundary stimuli, rather than nonspecifically to all stimuli that elicit longer RTs. Also, the results of the one-back task suggest that the involvement of the left putamen is specific to the categorization task. Several studies have shown that the dorsal striatum is integral to implicit and explicit visual category learning (Ashby, Noble, Filoteo, Waldron, & Ell, 2003; Knowlton, Mangels, & Squire, 1996). In addition, Seger and Cincotta (2002) demonstrated that the dorsal striatum is involved in making category judgments during well-learned classification tasks. The present results coincide with these findings and reinforce the importance of the dorsal striatum in learning and executing category judgments. As for the specific effect in the left putamen, Seger and Cincotta (2005b) demonstrated that, during initial category learning, putamen activity is associated with positive feedback. In contrast, our results show that the left putamen responds more to stimuli that are least successfully categorized. This suggests that the role of the putamen may change with learning: During initial category learning, the putamen is involved in processing positive feedback, and with further training it becomes more involved in categorizing stimuli that are most difficult to classify. Future studies assessing the time course of putamen activity with category training would help to clarify how the role of this region changes with learning.
Current models of category learning suggest that multiple memory systems are involved (Ashby & Valentin, 2005; Poldrack et al., 2001). Ashby and Valentin’s COVIS model suggests that the distinction between memory systems depends on whether the category structure can be verbalized or not. When it can be verbalized, PFC and the dorsal striatum are critical, and when it cannot be verbalized, the tail of the caudate is engaged. In addition, COVIS predicts that the long-term consolidation and representation of explicitly learned category knowledge is mediated by medial temporal structures, particularly the hippocampus (Ashby & Valentin, 2005). The present results provide support for this model and suggest the importance of the hippocampus in the representation and retrieval of explicitly learned categories. In addition, our results suggest that the dorsal striatum—in particular, the left putamen—may be important for the consolidation and retrieval of explicitly learned categories. In conclusion, our findings suggest that at least two distinct neural mechanisms are involved in making category judgments. During categorization of faces, for example, when a face exemplar is far from the category boundary, processing in face-selective inferior temporal regions and the hippocampus likely enables successful retrieval of the proper category. This mechanism is fairly automatic in the anterior hippocampus: Even when, as in our one-back task, category judgments are not required, the left anterior hippocampus responds to faces far from the boundary. These strong category representations likely provide the left SFS with adequate information to make an accurate decision. When the face is close to the category boundary, making categorization difficult, processing in faceselective inferior temporal regions is likely not sufficient for the hippocampus to retrieve the proper category. As a result, lateral PFC likely sends top-down signals to faceselective regions for additional feature analysis to aid in categorization. AUTHOR NOTE This work was supported by a grant from the National Institutes of Health. The authors thank Shawn Ell for useful comments and help with modeling the behavioral data. Correspondence concerning this article should be addressed to J. DeGutis, Department of Psychology, 3210 Tolman Hall, University of California, Berkeley, CA 94720 (e-mail:
[email protected]). REFERENCES Aguirre, G. K., Zarahn, E., & D’Esposito, M. (1997). Empirical analyses of BOLD fMRI statistics: II. Spatially smoothed data collected under null-hypothesis and experimental conditions. NeuroImage, 5, 199-212. Aguirre, G. K., Zarahn, E., & D’Esposito, M. (1998). The variability of human, BOLD hemodynamic responses. NeuroImage, 8, 360-369. Aizenstein, H. J., MacDonald, A. W., Stenger, V. A., Nebes, R. D., Larson, J. K., Ursu, S., & Carter, C. S. (2000). Complementary category learning systems identified using event-related functional MRI. Journal of Cognitive Neuroscience, 12, 977-987. Ashby, F. G. (1992). Multidimensional models of categorization. In F. G. Ashby (Ed.), Multidimensional models of perception and cognition (pp. 449-483). Hillsdale, NJ: Erlbaum. Ashby, F. G., & Maddox, W. T. (2005). Human category learning. Annual Review of Psychology, 56, 149-178. Ashby, F. G., Noble, S., Filoteo, J. V., Waldron, E. M., & Ell, S. W.
Distinct Mechanisms in Visual Category Learning 259 (2003). Category learning deficits in Parkinson’s disease. Neuro psychology, 17, 115-124. Ashby, F. G., & Valentin, V. V. (2005). Multiple systems of perceptual category learning: Theory and cognitive tests. In H. Cohen & C. Lefebvre (Eds.), Handbook of categorization in cognitive science (pp. 1-15). Amsterdam: Elsevier. Bar, M. (2003). A cortical mechanism for triggering top-down facilitation in visual object recognition. Journal of Cognitive Neuroscience, 15, 600-609. Bunge, S. A. (2004). How we use rules to select actions: A review of evidence from cognitive neuroscience. Cognitive, Affective, & Behavioral Neuroscience, 4, 564-579. Cote, P. (1998). FACES: The Ultimate Composite Picture (Version 3.0) [Computer software]. Saint Hubert, Quebec: Interquest. Downing, P. E., Jiang, Y., Shuman, M., & Kanwisher, N. (2001). A cortical area selective for visual processing of the human body. Science, 293, 2470-2473. Druzgal, T. J., & D’Esposito, M. (2001). Activity in fusiform face area modulated as a function of working memory load. Cognitive Brain Research, 10, 355-364. Epstein, R., & Kanwisher, N. (1998). A cortical representation of the local visual environment. Nature, 392, 598-601. Freedman, D. J., Riesenhuber, M., Poggio, T., & Miller, E. K. (2003). A comparison of primate prefrontal and inferior temporal cortices during visual categorization. Journal of Neuroscience, 23, 5235-5246. Gauthier, I., Skudlarski, P., Gore, J. C., & Anderson, A. W. (2000). Expertise for cars and birds recruits brain areas involved in face recognition. Nature Neuroscience, 3, 191-197. Gauthier, I., Tarr, M. J., Anderson, A. W., Skudlarski, P., & Gore, J. C. (1999). Activation of the middle fusiform “face area” increases with expertise in recognizing novel objects. Nature Neuroscience, 2, 568-573. Gauthier, I., Tarr, M. J., Moylan, J., Skudlarski, P., Gore, J. C., & Anderson, A. W. (2000). The fusiform “face area” is part of a network that processes faces at the individual level. Journal of Cognitive Neuroscience, 12, 495-504. Gazzaley, A., Cooney, J. W., McEvoy, K., Knight, R. T., & D’Esposito, M. (2005). Top-down enhancement and suppression of the magnitude and speed of neural activity. Journal of Cognitive Neuroscience, 17, 507-517. Heekeren, H. R., Marrett, S., Bandettini, P. A., & Ungerleider, L. G. (2004). A general mechanism for perceptual decision-making in the human brain. Nature, 431, 859-862. Hopkins, R. O., Myers, C. E., Shohamy, D., Grossman, S., & Gluck, M. (2004). Impaired probabilistic category learning in hypoxic subjects with hippocampal damage. Neuropsychologia, 42, 524-535. Kanwisher, N., McDermott, J., & Chun, M. M. (1997). The fusiform face area: A module in human extrastriate cortex specialized for face perception. Journal of Neuroscience, 17, 4302-4311. Kanwisher, N., & Wojciulik, E. (2000). Visual attention: Insights from brain imaging. Nature Reviews Neuroscience, 1, 91-100. Knowlton, B. J., Mangels, J. A., & Squire, L. R. (1996). A neostriatal habit learning system in humans. Science, 273, 1399-1402.
Knowlton, B. J., Squire, L. R., & Gluck, M. A. (1994). Probabilistic classification learning in amnesia. Learning & Memory, 1, 106-120. Kreiman, G., Koch, C., & Fried, I. (2000). Category-specific visual responses of single neurons in the human medial temporal lobe. Nature Neuroscience, 3, 946-953. Moore, T., & Armstrong, K. M. (2003). Selective gating of visual signals by microstimulation of frontal cortex. Nature, 421, 370-373. Myers, C. E., Kluger, A., Golomb, J., Ferris, S., deLeon, M. J., Schnirman, G., & Gluck, M. A. (2002). Hippocampal atrophy disrupts transfer generalization in nondemented elderly. Journal of Geriatric Psychiatry & Neurology, 15, 82-90. O’Craven, K. M., Downing, P. E., & Kanwisher, N. (1999). fMRI evidence for objects as the units of attentional selection. Nature, 401, 584-587. Petrides, M., & Pandya, D. N. (2002). Comparative cytoarchitectonic analysis of the human and the macaque ventrolateral prefrontal cortex and corticocortical connection patterns in the monkey. European Journal of Neuroscience, 16, 291-310. Poldrack, R. A., Clark, J., Paré-Blagoev, E. J., Shohamy, D., Creso Moyano, J., Myers, C., & Gluck, M. A. (2001). Interactive memory systems in the human brain. Nature, 414, 546-550. Ranganath, C., DeGutis, J., & D’Esposito, M. (2004). Categoryspecific modulation of inferior temporal activity during working memory encoding and maintenance. Cognitive Brain Research, 20, 37-45. Reber, P. J., Gitelman, D. R., Parrish, T. B., & Mesulam, M. M. (2003). Dissociating explicit and implicit category knowledge with fMRI. Journal of Cognitive Neuroscience, 15, 574-583. Schacter, D. L., & Wagner, A. D. (1999). Medial temporal lobe activations in fMRI and PET studies of episodic encoding and retrieval. Hippocampus, 9, 7-24. Seger, C. A., & Cincotta, C. M. (2002). Striatal activity in concept learning. Cognitive, Affective, & Behavioral Neuroscience, 2, 149-161. Seger, C. A., & Cincotta, C. M. (2005a). Dynamics of frontal, striatal, and hippocampal systems during rule learning. Cerebral Cortex, 16, 1546-1555. Seger, C. A., & Cincotta, C. M. (2005b). The roles of the caudate nucleus in human classification learning. Journal of Neuroscience, 25, 2941-2951. Sigala, N., & Logothetis, N. K. (2002). Visual categorization shapes feature selectivity in the primate temporal cortex. Nature, 415, 318320. Talairach, J., & Tournoux, P. (1988). Co-planar stereotactic atlas of the human brain. Stuttgart: Thieme. Tomita, H., Ohbayashi, M., Nakahara, K., Hasegawa, I., & Miyashita, Y. (1999). Top-down signal from prefrontal cortex in executive control of memory retrieval. Nature, 401, 699-701. Warrington, E. K. (1982). Neuropsychological studies of object recognition. Philosophical Transactions of the Royal Society of London: Series B, 298, 15-33. (Manuscript received June 11, 2005; revision accepted for publication February 24, 2007.)