Distributed Adaptive Routing for Big-Data Applications Running on Data Center Networks Eitan Zahavi
Isaac Keslassy
Avinoam Kolodny
Mellanox Technologies & Technion
[email protected]
Technion
[email protected]
Technion
[email protected]
ABSTRACT With the growing popularity of big-data applications, Data Center Networks increasingly carry larger and longer traffic flows. As a result of this increased flow granularity, static routing cannot efficiently load-balance traffic, resulting in an increased network contention and a reduced throughput. Unfortunately, while adaptive routing can solve this load-balancing problem, network designers refrain from using it, because it also creates out-of-order packet delivery that can significantly degrade the reliable transport performance of the longer flows. In this paper, we show that by throttling each flow bandwidth to half of the network link capacity, a distributed-adaptive-routing algorithm is able to converge to a non-blocking routing assignment within a few iterations, causing minimal out-of-order packet delivery. We present a Markov chain model for distributed-adaptive-routing in the context of Clos networks that provides an approximation for the expected convergence time. This model predicts that for full-link-bandwidth traffic, the convergence time is exponential with the network size, so out-oforder packet delivery is unavoidable for long messages. However, with half-rate traffic, the algorithm converges within a few iterations and exhibits weak dependency on the network size. Therefore, we show that distributed-adaptive-routing may be used to provide a scalable and non-blocking routing even for long flows on a rearrangeably-non-blocking Clos network under halfrate conditions. The proposed model is evaluated and approximately fits the abstract system simulation model. Hardware implementation guidelines are provided and evaluated using a detailed flit-level InfiniBand simulation model. These results directly apply to adaptive-routing systems designed and deployed in various fields.
Categories and Subject Descriptors C2.1 [Computer Communication Networks]: Network Architecture and Design – Data Center Networks’ Adaptive Routing.
General Terms Algorithms, Management, Performance, Design.
Keywords Data Center Networks, Big-Data, Adaptive Routing.
1. INTRODUCTION 1.1 Background Nearly all currently-deployed state-of-the-art Data Center Permission to make digital or hard copies of all or part of this work for personal or classroom use is granted without fee provided that copies are not made or distributed for profit or commercial advantage and that copies bear this notice and the full citation on the first page. To copy otherwise, or republish, to post on servers or to redistribute to lists, requires prior specific permission and/or a fee. ANCS‟12, October 29–30, 2012, Austin, Texas, USA. Copyright 2012 ACM 978-1-4503-1685-9/12/10... $15.00.
Networks (DCNs) rely on layer-3 Equal Cost Multipath (ECMP) routing to evenly distribute traffic and utilize the aggregated bandwidth provided by the multi-tier network [2]. ECMP routing is deterministic and static, because it is based on constant hash functions of the flow‟s identifier. The obtained bandwidth from these techniques is close to the network cross-bisectional-bandwidth as long as flow granularity is small, i.e. the routing algorithm spreads many flows that are short and/or long but low-bandwidth. In recent years a new challenge has emerged for DCNs: support “big-data” applications like MapReduce [18][30]. In measurements conducted on the Shuffle and DataSpreading stages of MapReduce applications, it was shown that up to 50% of the run time may be consumed by these stages [7]. In fact, these stages transmit the intermediate computation results with sizes up to 10‟s of gigabytes between each pair of servers participating in the computation. Therefore, the long and high-bandwidth flows characterizing these phases break the nice traffic spreading provided by the ECMP hash functions. For static routing there are always adversary patterns exhibiting high link over-subscription [28]. The probability of over-subscription follows the balls-and-bins max-load distribution. The contending flows result in a low effective bandwidth [6]. Adaptive routing can provide a solution to this contention problem [25][26]. In fact, adaptive routing can reach efficient traffic spreading in the DCN, even when flow granularity is high. Furthermore, when using adaptive routing, switches need to know little about the global state of the network or about the states of other switches. Unfortunately, adaptive routing can also cause high out-oforder packet delivery in long flows, which greatly degrades window-based transport protocols like TCP, and can result in a significant degradation of throughput and latency [23][31]. Due to this limitation, adaptive routing is often considered irrelevant for DCNs running big-data applications.1 In this paper, our goal is to determine conditions under which a distributed adaptive routing DCN algorithm can cause minimal out-of-order packet delivery in big-data applications, while achieving high throughput. 1
Although new reliable transports may be designed to tolerate some out-of-order delivery, they are limited by a basic tradeoff between the allowed out-of-order window size and the resources required to maintain it.
1.2 Related Work The network contention caused by a relatively small number of high-bandwidth flows is also a long outstanding problem of static routing in High Performance Computing (HPC) clusters. The scientific applications run on these clusters resemble big-data applications, because most parallel scientific applications are coded according to the BSP model [11], where computation and communication are separated into non-overlapping phases [16]. Under such a model, network contention directly impacts the overall program runtime since the slowest flow dictates the length of the entire communication phase [17][32]. For these reasons, efforts have been made to provide adaptiverouting, together with heuristics and mechanisms to improve both throughput and latency [20][22]. Most commercial interconnection networks like Cray BlackWidow[27], IBM BlueGene [1] and the InfiniBandbased Mellanox InfiniScale switch devices [5] provide adaptive routing. The most scalable systems are designed such that each switch knows little or nothing about the traffic or queues of the other elements in the network. Such systems are thus denoted oblivious-adaptive-routing. Mechanisms to enhance the adaptive-routing hardware in switches by relying on a complete or partial view of the entire network state were also proposed [15][26]. Nevertheless, to maintain scalability, even when complex feedback mechanisms are suggested, the self-routing principle, where each switch makes its own independent decisions, is maintained in most published works. One of the key drawbacks of adaptive routing is the resulting out-of-order packet delivery produced by the modification of the forwarding path of different packets of the same message [12]. To overcome the out-of-order delivery, which greatly degrades TCP (or any other packet window-based transport protocol), some studies propose the use of re-order input-buffers and limit the number of inflight packets to control their cost [25][23]. However, limiting the number of in-flight packets degrades bandwidth, increases latency, and requires additional hardware buffers. Another challenge for adaptive routing is that previous network states cannot be used for deciding about the new routing when the entire traffic pattern changes synchronously. Unfortunately, this is the exact behavior of BSP model programs as well as for the shuffle stages of a MapReduce. Adaptive-routing stability was studied in the context of the Internet [3][10]. In these studies, a centralized adaptiverouting algorithm is employed to optimize the network performance for some figure of merit. The computed routing slowly changes when compared to the traffic message times. The stability of such systems is then defined as the ability to avoid fluctuations in routing assignments when a computed routing is applied. Thus, adaptive-routing stability is different from our definition of adaptive-routing convergence, i.e. the ability of the system
Data flow
Data flow
SR
SR
SR
Central Routing Control
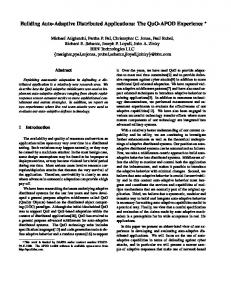
(a) (b) Figure 1: Centralized Routing versus Self Routing: (a) In a centrally controlled Clos, input switches request an output-port assignment for each arriving flow from the central controller. (b) In a distributed adaptive routing system, a Self Routing unit within each input switch provides that decision in an autonomic manner. to reach a non-blocking routing assignment for any given traffic permutation. We limit our discussion to Clos and folded-Clos networks (also known as fat trees), which are the most commonly used topologies for DCNs. Routing in Clos networks was mostly studied in the context of systems where a centralized control unit allocates virtual circuits to injected flows [19] (see Figure 1(a)). Consequently, the network‟s topological properties that support strict sense non-blocking (SNB), rearangeable non-blocking (RNB) and wide-sense non-blocking (WSNB) [4] were defined. When packet switching was proposed as an alternative to virtual circuits, Clos research focused on the properties obtained for multirate traffic injected into a network of multiple-capacity links [9][24]. In Clos networks, the term n-rate represents the number of different ratios of the traffic bandwidth to the system link capacity [24]. The centralized controller approach used for Clos routing does not scale with the cluster size, and therefore can hardly apply to our DCNs: To estimate the time available for the central controller for handling a single flow, consider a DCN of 10K nodes each running 10 VMs. An optimistically long flow length of 64KB on 40Gbps link provides 12.8usec flow lifetime. Further, if we assume communication is only 10% of application runtime; the flows arrival rate is 1/128usec on average. Under the above conditions the central routing unit has to handle a request rate of ~1G[req/sec] which allows roughly 2 operations per request on 2GHz CPU. Even a parallel routing algorithm will have to use more than a single OP for handling a request.
For this reason, a distributed adaptive routing approach was also proposed in Clos networks, and denoted as “selfrouting” [8]. In this approach, each switch can make its own routing decisions such that no central control unit is required (see Figure 1(b)). The self-routing study [8] was mainly focused on reducing the non-scalable overhead of the central routing controller. A probability analysis conducted by [33] on some specific self-routing Clos systems also provides an upper-bound on the number of contending flows (with high probability), and thus provides an upper-bound for the expected network queue length and service time. Our work is different as it shows that under some conditions, adaptive-routing can actually converge into a non-blocking routing assignment where no networking queuing is formed.
1.3 Contributions To the best of our knowledge, no work in the literature examines the conditions under which adaptive routing converges to a non-blocking forwarding assignment; and in case of convergence, we also know of no result on its convergence speed. By analyzing convergence time, we are able to show that under some traffic conditions the adaptive-routing can converge to a non-blocking routing assignment within a very short time. After this convergence time, there is no out-of-order delivery and no network contention. Indeed, there will be some performance degradation due to retransmission of the first few packets of the message. However, even for 256KB messages, re-transmission would introduce very small bandwidth degradation for the entire flow. To reach the above conclusion we have developed approximated Markov process models for Clos selfadaptive-routing system. The importance of these approximated models is the insight they provide about the speed of convergence. These models predict the extreme difference between convergence time of oblivious-selfrouting Clos with flows of full link capacity, and flows of half the link capacity. These models are then compared to simulation. We define a set of features that are practical to implement and provide converging oblivious-adaptiverouting system. The proposed hardware is then evaluated by simulation. We claim the following contributions: We present an approximate Markov chain model for a three-level Clos network to evaluate the convergence rate of the adaptive-routing process. Based on this model, we provide a lower bound on the convergence time for the case where the bandwidth of each flow equals the link capacity. The convergence time under such conditions for rearrangeably-non-blocking Clos networks is more than exponential with the number of input switches, so it typically does not converge within any practical message size.
Conversely, for the case where each flow bandwidth equals half the link capacity, the model shows fast convergence with weak dependency on the network size. Under these conditions, adaptive routing causes very little out-of-order packet delivery. We propose a set of system features that provide an oblivious-adaptive-routing. A detailed simulation model of InfiniBand hardware, enhanced with these mechanisms, confirms the above results. The rest of the paper is organized as follows: Section 2 provides a description of an oblivious-self-routing system Section 3 analyzes that system using a Markov chain model for predicting the convergence time. Section 4 discusses implementation guidelines for adaptive routing system and Section 5 provides an evaluation of both the model and the proposed implementation. A discussion and conclusions are presented in Section 6.
2. A DISTRIBUTED ADAPTIVE-ROUTING SYSTEM MODEL In this section, we introduce and define our architecture model and adaptive routing algorithm, before analyzing their performance in the next section. As illustrated in Figure 2, consider a 1-rate and uniform symmetrical Clos network. Assume that it has r input (and output) switches, of n x m ports each, and denote it as CLOS(n, r, m). Further assume that all links have an equal capacity, and that all flows have an equal bandwidth demand, such that this bandwidth equals of the link capacity. For instance, means that each flow bandwidth requires half of the link capacity. Assume that the network carries a full-permutation traffic pattern, i.e. each source sends a continuous flow of data to a single destination, and each destination receives data from a single source. When more than flows are routed through a link, we declare these flows as bad flows, and that link as a bad link. We declare the routing as a good routing if there are no bad links in the system. We now want to define the adaptive-routing algorithm. There are many different adaptive-routing systems defined in studies and implemented by hardware, as described in the related work section of the introduction. Most of these systems are hard to model mathematically. Some use complex criteria for selecting output ports, some use state history, and some even rely on the distribution of the global network state. Since we seek to learn about the conditions under which convergence is fast enough to support big-data applications, we want to define an adaptive-routing system that is simple enough to be modeled. Assume that the adaptive-routing system behaves as follows: At a new full-permutation traffic pattern is applied at the input switches. Each input switch assigns an output port to each of its flows (on Clos and folded Clos topologies this output port defines the complete route to the
1
n 1
Data flow
1
1
n
1
2
1
m
2 n 1
Input Switches
r
2
1
3. ANALYSIS
n
Output Switches
r n
1
Middle Switches
n
Figure 2: A Symmetrical Clos network CLOS(n, r, m): The top row consists of r crossbar switches of n x m ports, denoted as input switches. The middle row includes m crossbar switches of r x r ports. The bottom row consists of r crossbar switches of m x n ports, named output switches. destination). The output port assignment performed by the input switches is semi-random as a reasonable approach for spreading their traffic with no global knowledge about the flows in other switches. The assignment is termed semirandom since, as input switches do know their own flows, they never assign more than flows to any of their outputs. This means that bad links are only possible between the middle and output switches where flows from multiple input switches may congest. Once the initial routing is defined, the system iterates synchronously through the following phases. Each iteration takes exactly one time unit. In the middle of the th iteration at , each output switch selects a random bad flow that belongs to its input link with the largest number of flows. It then sends to the input switch at the origin of this bad flow a request to change its routing. The notification process and the change of routing happen before the end of the iteration period , when the operation repeats itself. The system keeps adapting routes until no more bad links exist. When an input switch receives a bad-flow notification, it moves that flow to a new randomly-selected output port. If that new port is already full, the input switch swaps the moved flow with another flow on that output port to avoid congestion. As a result, the swapped flow may cause a new oversubscription on some middle-switch-to-output-switch link. In the above model the middle switches do not perform any adaptive routing. All input switches are active at the beginning of each iteration period, and all output switches at the middle of each iteration period. Packets continuously flow through the network during the routing adaptation in order to provide the switches with the information about the flows routed through their links.
This section presents Markov chain models for the convergence time of the system presented in Section 2. Even for that simple system, an accurate model is hard to provide since the system state should represent all the flows on every link. Since the size of the Markov model grows exponentially with the number of flows and the number of links, we must provide an approximation instead. The first model below takes the unrealistic but simplifying assumption that each output switch may be treated as an independent system. Due to the interdependency of the output-switch convergence times, as imposed by the input switches, this model is only useful to describe the convergence process of a single output switch. Then, to better predict the convergence time, we present two other models, for full- and half-bandwidth flows. These models track the dependency between the output switches, and focus on the last stages of convergence when that interdependency has its greatest impact. Finally, in the evaluation section, we will use a simulation program that mimics the analyzed system behavior to evaluate these approximations. e – empty bins 7 6 4
2
5 3
1
n
1
m
(a)
Out SW 2 MID:
Improve
4
CAUSE: 2
1
3
2
1
1
3
4
3
4
MID:
3
4
1
Induced
EFFECT: Out SW 1
MID:
1
1
2
2
2
3
4
3
4
4 1
MID:
2
1
2
2
3
3
4
(b) Figure 3: (a) A balls-and-bins representation of the m output-switch input links as bins and the n flows as balls. The state variable e represents the total number of empty bins. (b) When a contending ball is requested to be moved in order to improve one output-switch state it may contend with another flow on the new input-switch output. Resolution of that contention may cause some induced move on another output-switch. For example: Balls are numbered by their source input switch. Output switch 2 requests to move ball 4 since it is a bad ball. Input switch 4 moves that ball to middle switch 4. This move improves switch 2 situation. But since ball 4 of output switch 1 is previously routed from input switch 4 to middle switch 4, these two balls are contending and are swapped. This causes an induced move of ball 4 in output switch 1.
As shown in Figure 3(a), we propose a model to represent all the links that feed into the same output switch as a ballsand-bins problem: each input link is considered as a bin, and each flow as a ball. We start with a random spreading of the balls into the bins, and want to obtain the expected time at which there are at most balls in each bin. Inspecting the changes to flows routed through the links feeding into a specific output switch, there are two processes that happen concurrently: an improvement process and an induced-move process. The improvement process results from the request of that output switch to move one of its worst-link bad flows, when that bad flow appears on a new link. In the balls-and-bins representation this would cause the movement of one of the worst bad-bin balls into some new bin (not necessarily an empty one). The induced-move process results from one of that outputswitch flows being involved in a flow-swap on some inputswitch. This change is denoted induced since the originator for the swap may be some other output switch. Figure 3(b) provides an example for how improvement in one output switch causes an induced move on the other. The distribution of induced moves on the different output switches resembles the random throw of balls into bins, where is the number of output switches that have not reached their steady state.
3.1 A Single Output-Switch Markov Chain Model for Full-Link Bandwidth per Flow This sub-section presents an approximate Markov chain model for a single output switch for the case of full-link bandwidth per flow (i.e., ). Based on the system symmetry, this model considers each output switch independently. To model the interactions between output switches, the model assumes that each time an output switch kicks some bad ball, an induced move will happen with probability of n/m. As depicted in Figure 4 we define a state variable e that represents the number of empty bins, and another state variable g that counts the number of good bins. So the Markov state for the single output switch can be represented using the pair (e, g). To simplify the analysis, this model makes the following approximations, as further explained below: 1) Induced moves are evenly distributed over all output switches, such that all the output-switch systems are identical and can be treated as uncorrelated. 2) When the number of bad bins is small compared to the number of bad balls, such that there are in average over 2.5 bad balls per bad bin, the induced-move impact is modeled as if all bad bins have at least 3 balls. The concurrent processes that affect the state of the balls are:
b=m-e-g
e
g
n
1
m
Figure 4: An approximated model assuming an even distribution of bad balls in bad bins: In the shown case, the Improvement process must take one of the balls in the left-most bin, as it is the worst bin. The Induced-Move process may move any ball. In the shown case, if a bad ball is selected by the Induced-Move process from a bad bin with 2 balls (i.e. bin 2, 3 or 4) and then falls on an empty bin, 2 good bins are created and g increases by 2. Else if it is selected from the first bin and then falls on an empty bin, the first bin does not become good and g only increases by 1. The improvement process: Each output switch selects one of the balls in one of the bins with the highest number of balls, and randomly places it into a bin. As long as there are any bins with at least 3 balls, it is guaranteed that the number of bad bins cannot decrease by this process (since the selected bin will only lose one ball). The probability for the selected ball to fall on an empty, good or bad bin depends on the number of such bins. The induced-move process: This process takes a random ball and randomly places it in some bin. The probability for such moves to occur depends on the number of empty links on the input switches. Since there are only flows spread on links, and the selection of the flow to be moved is random, the distribution of the moved flows to input switches should follow the distribution of throwing balls into bins. In order to avoid the complexity of using this distribution, the model takes the approximation of the average probability of an induced move, which is . To predict if the induced move changes the number of good bins by +1, -1 or -2, we should have tracked the exact number of bins with 0, 1 and 2 balls. As shown in the example of Figure 4, if the moved ball is from bins with just 2 balls and it falls in an empty bin, g is increased by 2. But if the bad ball is from a bin with more than 2 balls, the number of good bins is only increased by 1. However, to compute using a Markov chain the number of bins with 2 balls means we need to track the number of bins with 3 balls, and so forth. If we define these state variables, the state space explodes. As the distribution of the number of balls per bin is a sharp function, such that the probability drops significantly with the number of balls, we claim that a reasonable approximation is to assume that all the bad bins have the same number of balls. The output switch policy of re-routing a ball from the bin with the highest number of balls strengthens this assumption.
Table 1 Possible state changes with p=1 and their probability Process Induced Move
b-balls/ b-bins Any case
> 2.5
≤ 2.5
Improvement
>2
≤2
Who moves good ball good ball good ball good ball bad ball bad ball bad ball bad ball bad ball bad ball bad ball bad ball bad ball bad ball bad ball bad ball bad ball bad ball
Move Where empty bin other good bin same good bin bad bin empty bin good bin bad bin empty bin good bin other bad bin same bad bin empty bin good bin bad bin empty bin good bin same bad bin other bad bin
Let us consider each state transition induced by the request of some other output switch to improve its state. The ball selected may be a good or bad ball, and we assume by symmetry that it may be moved into any bin with the same probability. The probability for a good ball to be selected is . The probability for a bad ball is the complementary . The possible moves and their respective probabilities are described in Table 1. The combined impact of the two processes is obtained by considering each possible pair of the Improve and Inducedmove state transitions, and adding their probability product to the Markov state transition matrix.
3.2 Last-Step Model for Flows of Full Link Bandwidth A full model of the entire Markov matrix of all states of all output switches is infeasible due to its size. In order to obtain an upper bound approximation on the convergence time, we suggest inspecting the output switches just before they reach convergence. We call this the Last-Step model. As we suspect that the long convergence times are a result of the induced moves forced by one output switch on another, we focus the model on the last steps of convergence. Only when all the output switches reach together their good state, they stop forcing each other back into bad states. The model only uses a single bad state that is closest to the good state. In that sense, it is an optimistic model, as a sequence of bad induced moves is not modeled and the output switch stays close to its good state. Yet, we will later show that it correctly models the exponential convergence time of our system.
New State e, g e+1, g-2 e, g e+1, g-1 e-1, g+1 e, g-1 e, g e-1, g+2 e, g e, g+1 e, g e-1, g+1 e, g-1 e, g e-1, g+2 e, g e, g e, g+1
Probability g/n*e/m*n/m=ge/m^2 g/n*(g-1)/m*n/m = g(g-1)/m^2 g/n*1/m*n/m=g/m^2 g/n*(m-g-e)/m*n/m = g(m-g-e)/m^2 (n-g)/n*e/m*n/m=(n-g)e/m^2 (n-g)/n*g/m*n/m=(n-g)g/m^2 (n-g)/n*(m-g-e)/m*n/m=(n-g)(m-g-e)/m^2 (n-g)/n*e/m*n/m = (n-g)e/m^2 (n-g)/n*g/m*n/m= (n-g)g/m^2 (n-g)/n*(m-e-g-1)/m*n/m=(n-g)(m-e-g-1)/m^2 (n-g)/n*1/m*n/m= (n-g) /m^2 e/m g/m (m-e-g)/m e/m g/m 1/m (m-e-g-1)/m
Figure 5(a) shows the Markov states of a single output switch. There are only two states for an output switch: 0 (good) and 1 (bad). Only a single bad bin is possible one step away from the good state as shown on the balls-andbins systems drawn below the state graph. The probabilities for transition represent the improvement and induced move processes, but their values depend on the other output switches states. The Markov system contains approximated output switch sub-systems each with a single state variable which is either 1 (bad) or 0 (good) as shown in Figure 5(b). The system state is coded as a binary variable of bits. Bit represents the state of the output switch. The resulting state space has system states. The entire system has a single absorbing state which is when all the bits of the binary representation are 0. We can also assume all output switches start with some bad bins so the initial state value is . The total number of induced moves denoted by is the number of „1‟s in the state binary value. Before the observing state is reached, the probability for each output switch to leave a good state equals the probability for one of the induced moves to throw a ball in that output switch. We assume the induced moves are equally spread, and thus
The probability to improve a bad state is denoted and is built from the impact of the two processes and . The improvement process always selects a bad ball and thus improvement depends on the number of empty bins.
Bad
D
B
b=m-e-o-t
A
Good
t
0
1
n
C
1
Bad
D
Good
A
t=n/2
0
1
e=m-n/2
C Bad
Output switch 2
B
m
Figure 6: For p=2 we introduce new state variables: e=empty, o=one, t=two.
(a)
Output switch 1
e
o
D
B
Good
A
0
1
1
C
m
(a)
t‘=t-2 Bad
Output switch r
D
B
Good
o’=1
e‘=e
A
0
1
C
(b)
Figure 5: Approximated Last Step model of a single output-switch: (a) A single bad state implies a lower bound on convergence time as it does not let the bad state degrade further than the last step. (b) The set of r state pairs describes the entire system. For the induced move to improve we need to multiply the chance for induced move by the probability a bad ball will be selected and the probability the move will be into an empty bin:
1
m
(b)
Figure 7: (a) The absorbing state with maximal B and (b) its neighbor “bad” state. The moved ball is shadowed. output switch: e, the number of empty bins; o, the number of bins with one ball; and t, the number of bins with two balls. It can be shown that for a state to be good the following should be met:
Or: To build the Markov state transitions matrix the present state is represented as a binary variable: and the next state is represented as Define as the number of digits where , the number of digits j where , the number of digits where and the number of digits where . The probability to move from to is given by:
3.3 Last-Step Model for Flows of Half Link Bandwidth Unlike the Last-Step model for that has just one absorbing state for the output switches, the case of two flows per link has several good states. As illustrated in Figure 6, to distinguish these states we introduce the following variables describing the ball distributions in each
As we are interested in an upper bound for the number of iterations to convergence (for the case only) we pick the worst absorbing state that is the state with highest probability shown in Figure 7(a). For that state:
So the maximal
is obtained for the maximal ⁄ ( )
:
Consider the improvement probability for the bad state closest to the worst B good state as shown in Figure 7(b). The probability is then a combination of the probability
On Flits Queue or De-Queue (numFlits, TP, RP, to DEST) Update the number of flits queued for the Transmit Port (TP) If enough time from port change for this flow and TP is congested If switch is a middle switch Send EAR though the Receive Port (RP) flits were received on Else If TP is an up-going-port adapt the output port for DEST Possibly swap another DEST if the new output-port is busy On Receiving an EAR (RP, DEST) If RP is an up-going-port adapt the output port for DEST Possibly swap another DEST if the new output-port is busy
Figure 8: Packet Forwarding Module Algorithms on the queueing of new flits on a Transmit Queue and on receiving an Explicit Adaptive Routing Request of the improvement process and for the induced move to actually improve the state. We can see that:
The probability for induced moves with has to take into account the probability for a ball to move without requiring a swap. To that end we could use the balls-andbins distribution to predict the probability for a bin to have more than two balls. The construction of the Markov state transition matrix follows the same procedure as in Section 3.2.
4. IMPLEMENTATION GUIDELINES This section discusses the feature set required for the implementation of an oblivious-adaptive-routing system. To meet the required behavior described in Section 2, the switches need to extend the deterministic routing and provide random assignment of output ports for flows. Reassignment of a flow output port is only allowed on input switches and is triggered either when receiving an Explicit Adaptation Request (EAR) from an output switch, or when congestion is observed on the previously assigned output port. A timer is used to throttle the number of reassignments in the latter case to avoid multiple reassignments before the congestion is relieved. To enable an efficient hardware implementation, the proposed mechanisms differs from the model described in Section 2 in several aspects. The first difference is that a real system does not likely count “flows” assuming they are all of the same bandwidth. Instead, it makes more sense to evaluate a transmit-port congestion, in mechanisms similar to those proposed by the IEEE 802.1Qau known as QCN [36]. The second aspect is about concurrency of bad flow reroutes: congestion-based bad link detection means that the knowledge about bad links is not available at the receiving
Randomize a random or worst permutation as dst[src] MiddleSwitch[src, dst] = mod(src,n) for each (src, dst) pair Iterations = 0 While any bad link (depends on P) Iterations++ Randomly select one (src, dst) from the worst link for each out-switch For each bad (src, dst) selected, in random order Randomly select the new middle switch Move the (src, dst) to the new middle switch Optionally swap with other (src, dst) going through the same link Report Iterations
Figure 9: Distributed Adaptive Routing Simulation Main Loop switch (output switch in our model) but in the middle switch. In the model used in previous sections the output switch requires this information in order to choose a single worst bad flow to be re-routed. Selecting the worst bad link implies the existence of a protocol for each middle switch to notify the output switches to which it connects about bad links and their severity. To avoid the latency and complexity of such a protocol, the proposed implementation does not enforce a single bad flow transition per output switch per iteration. Instead, the responsibility for requesting re-routing of bad flows is given to the middle switches that use the same QCN-like monitoring to detect congestion. When congestion is detected, the middle switches send EAR requests to the relevant input switches. These notifications do require a special signaling protocol to be delivered. The algorithms for EAR generation and forwarding, as well as for determining when to adapt to output congestion, are depicted in Figure 8.
5. EVALUATION Evaluation of the worst convergence time using simulations relies on the ability to check many permutations. As the number of possible permutations is extremely large, it is important to focus on the permutations that are presumed to have the worst convergence time, or at least a large one. These so-called worst permutations are derived by contrasting them to the set of permutations that are fastest to converge. The fastest converging permutations have all flows originating on the same input switch destined to the same output switch. For such permutations it is enough that each input switch spreads its own outputs to avoid bad links and provide good routing. Such assignment is possible if (this is also the rearangeable non-blocking condition for 1-rate Clos with flows per link). Intuitively, a permutation where each output switch is fed by flows from different input switches will be the hardest to converge as it will require the most synchronization between the input switches that actually do not talk to each other.
1.00E+08
Last-Step Model
Iterations to Convergence
Sim Worst Perm
Ierations to Convergence
Independent Model 100000000 10000000 1000000 100000 10000 1000 100 10 1
6
7
8
1.00E+04
Simulation
1.00E+03
Last-Step Model
1.00E+02
Independent Model
1.00E+01
Sim Worst Perm
50
40 30
20 10
0 6
4
6
8
10
12
14
r changes while n=m=6
The first comparison made is for the RNB topologies of the p=1 case. The number of iterations to reach convergence is provided in Figure 10(a). As expected, the Independent output switch model of Section 3.1 is greatly optimistic, while the Last-Step model of Section 3.2 is closer to the simulated results. The Last-Step model is pessimistic for very small n as it assumes all output switches start in a bad state, which is not the case for very small n.
Last-Step Model
Independent Model
5
2
Figure 11: The dependency of the number of iterations to convergence on r for a constant m=n=6.
(a)
Ierations to Convergence
1.00E+05
0
5
m=n=r
7
8
m=2n=2r
(b) Figure 10: Expected Convergence Time predicted by the single-output-switch, the p=1 last-step model compared to simulated results of worst permutations as a function of (a) the m=n=r of RNB and (b) m=2n=2r SNB topologies.
5.1 Analyzed System Simulation Model A dedicated simulation program was written to model the system described in Section 2. The data structure used is a simple matrix [ ] where represents the source and destination for each flow and [ ] denotes the middle switch assigned to that flow. The simulation algorithm is depicted in Figure 9. The program optionally starts from a fully randomized permutation or one that meets the condition of a worst permutation. Each point of simulation result is obtained by simulating a batch of 1000 permutations and then continues to simulate new batches until the average number of iterations required to converge changes by less than 1%. The models of Sections 3.1, 3.2 and 3.3 were coded in matlab2, to form an observable Markov chain matrix following the theory presented in [21].
2
1.00E+06
1.00E+00
4
4
1.00E+07
The presented Matlab-based evaluation is limited by the exponential state space nature of Markov representations and the capacity of our version of Matlab
For the SNB case in Figure 10(b), it can be seen that the simulation predicts convergence times many orders of magnitude smaller than the RNB case but still mostly above 10. The Independent output-switch model is very optimistic, and the Last-Step model is pessimistic, probably due to its assumption that all output switches start at a bad state. For SNB, due to the over provisioning of the network, there are many chances that some output switches will start in a good state. Also note that the change of slopes on the simulation curve may be attributed to the change between even and odd port numbers, and how routing in Clos best fits even number of ports. To strengthen the point that the systems are dependent we show the dependency of the convergence time in the number of parallel output switches in Figure 11. The convergence is plotted for different values of and a fixed . It can be observed that the dependency on is exponential. The Last-Step model shows a lower slope, which we suspect is a result of the approximation of using a single bad state. Note that the Independent model does not depend on at all, which exhibits yet another limitation of this model. The Last-Step Markov model of Section 3.3 for the case of half-link capacity flows was simulated on RNB topology and the number of iterations to convergence is provided in Figure 12. The number of iterations required to reach convergence is shown to be very small even for large values of . As can also be seen the Markov model is optimistic for larger networks. We attribute this behavior to the approximation used by this model which defines a single bad state for each output-switch sub-system.
Iterations to Convergence
5 4.5 4
3.5 3 2.5
Last-Step Model
2
Sim Worst Perm
1.5
Sim All Perms
1 0.5
0 6
7
8
9
10
11
12
13
n=m=r
Figure 12: Comparison of time to convergence for Clos(n=m=r) with half rate flows (p=2) cases using Last Step Model and a dedicated simulation model.
5.2 Implementable System Simulation Model A large compute cluster would have been the obvious choice for the evaluation of an implemented adaptive routing system. However, hardware that implements our proposed Explicit Adaptation Request messaging described above was not available to us. Instead, we have used a well-known flit level simulator for InfiniBand that accurately models flow dynamics, network queuing and arbitration. These simulators are described in the following sections. The OMNet++ [29] based InfiniBand flit-level simulation model [35] is commonly used for predicting bandwidth and latency for InfiniBand networks [34][13][14]. In order to evaluate the proposed implementation guidelines presented in Section 4, a new packet-forwarding module was added to the switches. This module implements all the algorithms to detect link capacity overflow, provide flow re-route, swap output ports and introduce a signaling protocol to carry the Explicit Adaptation Requests (EAR) between switches. The overhead and timing of the EAR protocol is accurately modeled by encapsulating EARs as 8-byte messages similarly to the flow-control packets of the InfiniBand, and sending them through the regular packet send queues. The simulations performed are of two topologies containing 1152 hosts: The rearrangeably non-blocking (RNB) topology is a folded CLOS(24, 48, 24) equivalent to XGFT(2; 24,48; 1,24) fat-tree topology. The strictly nonblocking topology (SNB) has double the number of middle switches, i.e. is a folded CLOS(24, 48, 48) equivalent to XGFT(2; 24,48; 1,48) fat-tree. The SNB topology is simulated to provide a fair comparison to the half-flows case as it provides double the links. The model assumes a link capacity of 40Gbps and hosts may send data at that speed or be throttled to 20Gbps +/- 0.8Gbps. The traffic pattern applied to the system is a sequence of random permutations. In each permutation each host sends data to a single random destination and receives data from a single random source. The hosts progress through their sequence of destinations in an asynchronous fashion sending 256KB to each destination.
The simulation tracks the number of routing changes performed by each switch in periods of 10µsec as well as the final throughput at each of the network egress ports. The ratio of packets delivered out-of-order to those provided in-order is also measured. Another measured variable is the out-of-order packet window size, defined as the gap in the number of packets, as observed by the receiving host. This variable is a clear indication for the feasibility of implementing a re-order buffer. The bandwidth, latency and out-of-order percent and window size results are represented in Table 2. The values are taken as average, max or min value over all receivers of the average or max value measured on each receiving host. For example, the min of average throughput means that each egress port throughput is averaged over time, and the reported number is the minimal values over all the egress ports. To establish a fair comparison we focus on the results of the two cases when only half of the network resources are used: SNB 40Gbps (first data column) and RNB 19.2Gbps (third data column). It is shown that although the bandwidth provided by the SNB case is higher, any transport that would require retransmission due to out-of-order delivery would actually fail to work on the SNB case since only one of three packets is provided in order (ratio of ~2). The latency of the network is also impacted by not reaching a steady state, thus showing a much longer latency. The routing convergence provided by the case is most visible when inspecting the number of routing changes per 10μsec. Figure 13 shows on each line the number of adaptations conducted by a specific switch in each 10µsec period for (a) SNB 40Gbps, (b) RNB 20.8Gbps during a single permutation. It can be observed that routing is constantly changing for the SNB 40Gbps and the RNB 20.8Gbps cases. A long sequence of 256KB message permutations on RNB 19.2Gbps is shown in Figure 13(c). It can be observed that adaptive-routing reaches a non-blocking assignment for all permutations in less than 80µsec. Table 1 Simulation results for a 1152-hosts cluster Parameter
Avg-of-Avg Throughput Min-of-Avg Throughput Avg-of-Avg Network Latency Max-of-Max Network Latency Avg-of-Avg Out-of-order / In-order Ratio Max-of-Avg Out-oforder / In-order Ratio Avg-of-Avg Out-of-order Window Max-of-Avg Out-oforder Window
SNB Full BW: 40Gbps 37.7Gbps 36.5Gbps 17.0µsec
RNB Full BW: 40Gbps 23.0Gbps 20.7Gbps 32µsec
RNB Half BW: 19.2Gbps 18.9Gbps 18.9Gbps 5.8µsec
877µsec
656µsec
11.7µsec
1.87
5.2
0.0023
3.25
7.4
0.0072
6.9pkts
5.1pkts
2.3pkts
8.9pkts
5.7pkts
5.0pkts
Switch Routing Adaptations/ 10usec
Switch Routing Adaptations/ 10usec
(a)
t [sec]
(b)
t [sec]
Figure 13: Simulated 1152 nodes cluster, number of re-routing events on each input-switch averaged over 10µsec time periods for 256KB messages for (a) SNB 40Gbps (b) RNB 20.8Gbps and (c) RNB 19.2Gbps. The plots in (a) and (b) focus on a single 150µsec permutation period and show that convergence is not met. For the RNB 19.2Gbps case (c), convergence is reached within a few tens of microseconds from the start of each of the applied random permutations.
6. DISCUSSION AND CONCLUSIONS In this paper we find sufficient conditions allowing distributed oblivious-adaptive-routing to converge to a nonblocking routing assignment within a very short time, thus making it a viable solution for adaptive routing for medium-to-long messages on fat-trees. Convergence is shown to require flows that do not exceed half of the link capacity, which raises the question of whether it is worth to pay that high price. Note that actually in our proposed Adaptive Routing only the edge links of the network are operated at half the core network link bandwidth. Many of the network links do route more than one flow and thus utilize the full link capacity. Alternative approaches to deal with the contention caused by highvolume correlated flows may seem cheaper but they are not scalable. They propose the introduction of a centralized traffic engineering engine that can throttle traffic as necessary or perform re-routes. However, as the number of flows correlates to the number of cluster nodes, a central unit is likely to become a bottleneck. Other attempts [26] to provide adaptive routing based on protocols that convey the system state to each switch are also not scalable due to the state size on every switch, the number of messages to provide state updates and the synchronous change of traffic which makes previous states irrelevant. The developed approximate model provides the insight that the origin of the long convergence time is the interdependency of re-route events on the different output switches, as imposed by the topology. It was shown that the time it takes to converge to a non-blocking routing is exponential with the number of input or output switches. For that reason, the probability of creating bad links on a single output switch has a major impact on the convergence time. For rearangeable-non-blocking CLOS, limiting the
traffic flows to half or less of the link bandwidth reduces this probability for creating bad links to less than 0.5, and therefore provides fast convergence. Finally, we propose a simple system architecture for the signaling needed for adaptation, and simulate it to show how it converges within 20-80μsec on a 1152-host network. The insights provided by this research should help in providing self-routing solution to long messages in datacenter applications of various fields.
7. ACKNOWLEDGMENTS We would like to thank Marina Lipshteyn of Mellanox and Israel Cidon, Yossi Kanizo and Erez Kantor from the Technion for their support and insight. This work was partly supported by the Intel ICRI-CI Center and by European Research Council Starting Grant No. 210389.
8. REFERENCES [1] Adiga, N.R. et al. 2005. Blue Gene/L torus interconnection network. IBM Journal of Research and Development. 49, 2.3 (Mar. 2005), 265–276. [2] Al-Fares, M. et al. 2010. Hedera: dynamic flow scheduling for data center networks. Proceedings of the 7th USENIX conference on Networked systems design and implementation (Berkeley, CA, USA, 2010), 19–19. [3] Anderson, E.J. and Anderson, T.E. 2003. On the stability of adaptive routing in the presence of congestion control. INFOCOM 2003. Twenty-Second Annual Joint Conference of the IEEE Computer and Communications. IEEE Societies (Apr. 2003), 948– 958 vol.2. [4] Benes, V.E. 1965. Mathematical theory of connecting networks and telephone traffic. Academic press New York.
[5] BLOCH, G. et al. High-Performance Adaptive Routing. Publication number: US 2011/0096668 A1 U.S. Classification: 370/237. [6] Chen, Y. et al. 2009. Understanding TCP incast throughput collapse in datacenter networks. Proceedings of the 1st ACM workshop on Research on enterprise networking (New York, NY, USA, 2009), 73–82. [7] Chowdhury, M. et al. 2011. Managing data transfers in computer clusters with orchestra. Proceedings of the ACM SIGCOMM 2011 conference (New York, NY, USA, 2011), 98–109. [8] Douglass, B.G. and Oruc, A.Y. 1993. On self-routing in Clos connection networks. Communications, IEEE Transactions on. 41, 1 (1993), 121–124. [9] Du, D.Z. et al. 1998. On multirate rearrangeable Clos networks. SIAM J. Comput. 28, 2 (1998), 463–470. [10] Gamarnik, D. 1999. Stability of adaptive and nonadaptive packet routing policies in adversarial queueing networks. Proceedings of the thirty-first annual ACM symposium on Theory of computing (New York, NY, USA, 1999), 206–214. [11] Gerbessiotis, A.V. and Valiant, L.G. 1994. Direct bulk-synchronous parallel algorithms. J. Parallel Distrib. Comput. 22, 2 (Aug. 1994), 251–267. [12] Gomez, C. et al. 2007. Deterministic versus Adaptive Routing in Fat-Trees. 2007 IEEE International Parallel and Distributed Processing Symposium (Long Beach, CA, USA, Mar. 2007), 1–8. [13] Gran, E.G. et al. 2010. First experiences with congestion control in InfiniBand hardware. 2010 IEEE International Symposium on Parallel & Distributed Processing (IPDPS) (Apr. 2010), 1–12. [14] Gran, E.G. et al. 2011. On the Relation between Congestion Control, Switch Arbitration and Fairness. (May. 2011), 342–351. [15] Gusat, M. et al. 2010. R3C2: Reactive Route and Rate Control for CEE. High-Performance Interconnects, Symposium on (Los Alamitos, CA, USA, 2010), 50– 57. [16] Hoefler, T. et al. 2007. A Case for Standard Nonblocking Collective Operations. Recent Advances in Parallel Virtual Machine and Message Passing Interface. F. Cappello et al., eds. Springer Berlin / Heidelberg. 125–134. [17] Hoefler, T. et al. 2008. Multistage switches are not crossbars: Effects of static routing in highperformance networks. 2008 IEEE International Conference on Cluster Computing (Oct. 2008), 116– 125. [18] Isard, M. et al. 2007. Dryad: distributed data-parallel programs from sequential building blocks. Proceedings of the 2nd ACM SIGOPS/EuroSys European Conference on Computer Systems 2007 (New York, NY, USA, 2007), 59–72. [19] Jajszczyk, A. 2003. Nonblocking, repackable, and rearrangeable Clos networks: fifty years of the theory
evolution. Communications Magazine, IEEE. 41, 10 (2003), 28–33. [20] Jiang, N. et al. 2009. Indirect adaptive routing on large scale interconnection networks. ACM SIGARCH Computer Architecture News. 37, (Jun. 2009), 220– 231. [21] Karlin, S. and Taylor, H.M. 1998. An Introduction to Stochastic Modeling, Third Edition. Academic Press. [22] Kim, J. et al. 2006. Adaptive routing in high-radix clos network. (2006), 92. [23] Koibuchi, M. et al. 2005. Enforcing in-order packet delivery in system area networks with adaptive routing. Journal of Parallel and Distributed Computing. 65, 10 (Oct. 2005), 1223–1236. [24] Liew, S.C. et al. 1998. Blocking and nonblocking multirate Clos switching networks. Networking, IEEE/ACM Transactions on. 6, 3 (1998), 307–318. [25] Martínez, J.C. et al. 2003. Supporting Fully Adaptive Routing in InfiniBand Networks. Proceedings of the 17th International Symposium on Parallel and Distributed Processing (Washington, DC, USA, 2003), 44.1–. [26] Minkenberg, C. et al. 2009. Adaptive Routing in Data Center Bridges. Proceedings of the 2009 17th IEEE Symposium on High Performance Interconnects (Washington, DC, USA, 2009), 33–41. [27] Scott, S. et al. 2006. The BlackWidow High-Radix Clos Network. Proceedings of the 33rd annual international symposium on Computer Architecture (Washington, DC, USA, 2006), 16–28. [28] Towles, B. 2001. Finding Worst-case Permutations for Oblivious Routing Algorithms. [29] Varga, A. OMNET++. http://www.omnetpp.org. [30] White, T. 2010. Hadoop: The Definitive Guide. O‟Reilly Media, Inc. [31] Wu, W. et al. 2009. Sorting Reordered Packets with Interrupt Coalescing. Computer Networks. 53, 15 (Oct. 2009), 2646–2662. [32] Xin Yuan 2011. On Nonblocking Folded-Clos Networks in Computer Communication Environments. Parallel & Distributed Processing Symposium (IPDPS), 2011 IEEE International (May. 2011), 188– 196. [33] Youssef, A. 1993. Randomized self-routing algorithms for Clos networks. Computers & Electrical Engineering. 19, 6 (Nov. 1993), 419–429. [34] Zahavi, E. Fat-Trees Routing and Node Ordering Providing Contention Free Traffic for MPI Global Collectives. Journal of Parallel and Distributed Computing. Communication Arch for Scalable Systems. [35] Zahavi, E. InfiniBand(TM) Macro Simulation Model. http://www.omnetpp.org/omnetpp/doc_details/2070infiniband. [36] IEEE Std 802.1Qau-2010 (Amendment to IEEE Std 802.1Q-2005) DOI: 10.1109/IEEESTD.2010.5454063, 2010 , Page(s): c1- 119.