Noname manuscript No. (will be inserted by the editor)
Distributed Denial of Service (DDoS) Attack Detection by Reducing the Security Alerts in Grid Computing Networks Syed Raheel Hassan · Jasmina Pazardzievska · Julien Bourgeois
Received: date / Accepted: date
Abstract Due to the extensive growth of grid computing networks, security is becoming a challenge. Usual solutions are not enough to prevent sophisticated attacks fabricated by multiple users especially when the number of nodes connected to the network is changing over the time. Attackers can use multiple nodes to launch DDoS attacks which generate large amount of security alerts. On the one hand, this large number of security alerts degrades the overall performance of the network and creates instability in the operation of the security management solutions. On the other hand, they can help in camouflaging other real attacks. To address these issues, a correlation mechanism is proposed which reduces the security alerts and continue detecting attacks in grid computing networks. To obtain the more accurate results, major portion of the experiments are performed by launching DDoS and Brute Force (BF) attacks in real grid environment, i.e. the Grid’5000 (G5K) network. Keywords Management of Security in Grid Computing Networks · GSOC · Grid IDS · Grid Security Operation Center.
Syed Raheel Hassan and Julien Bourgeois Computer Science Laboratory (LIFC), University of Franche-Comte (UFC), 1 Cours Leprince-Ringuet, 25201 Montbeliard, France Tel.: +33 3 81 99 47 75 Fax: +33 3 81 99 47 91 E-mail:
[email protected] E-mail:
[email protected] Jasmina Pazardzievska Faculty of Electrical Engineering and Information Technologies, University Ss. Cyril and Methodius, Skopje, Republic of Macedonia E-mail:
[email protected]
2
Syed Raheel Hassan et al.
1 Introduction In recent years the expansion of computer networks has given birth to many security threats. These security threats, from minor to major fall in different categories. In the past anti-virus softwares were used to protect the nodes locally, then firewalls came into being, which protect the nodes and network from out-side attacks. But due to the continuous expansion in computer networks, intrusion detection and prevention systems (IDPSs) have been introduced. At present, IDPSs are also struggling to secure dynamic growing multiadministrative domain networks due to their performance limitations and the generation of too many false positives [16][21]. When an attacker launches an intensive attack on the network the IDS starts generating many security alerts. It starts sending these alerts to the central database. These huge number of security alerts create bottlenecks in the network and use a lot of disk space. Due to these intensive attacks, the IDS can become overloaded and turn unstable. The instability of an IDS results in generating security alerts which are false positives or in generating too many alerts. Hence the network administrator has to make time consuming efforts to analyze these alerts which give the attacker a fair chance to perform malicious activities. The instability of an IDS stems from multiple reasons. The most common ones observed are due to disk space failure, database failure, system process queue overloading, excessive memory and processing power consumption. Grid computing networks were invented to share computational resources from locations dispersed from all over the globe. It is a network which can be called as multi-administrative or multi-organization network. This emergence of different organizations have made the grid computing network vulnerable to more network attacks. Due to the nature of the grid, an attacker can use the grid computational power to target the resources of any administrative domain attached to the grid network. In these circumstances one possible threat are DDoS attacks which can halt the overall operation of grid computing network. There is therefore a high need to put a mechanism in place which can detect these attacks as early as possible while continuing operating stably. There should be a mechanism which can evaluate the security of the sites, there should be security alert sharing between different sites. In this paper we are focusing on how to minimize the number of security alerts when the sites are under intense distributed or a combination of different attacks while lowering the reporting delay. This paper also discusses the comparison of different security management systems under DDoS and BF attacks in our lab and in the G5K network. The remaining parts of the paper are organized as related work in section 2, the architecture of GSOC with its components has been discussed in section 3. The GSOC basic and advanced correlation mechanism is to be found in section 4, experiments in section 5. The explanations of results in section 6 and the conclusion in section 7 .
DDoS Attack Detection in Grid Computing in Networks
3
2 Related Work Protect grids from DDoS Attacks by Yang Xiang and Wanlei Zhou [25] proposed a distributed defense system for detecting DDoS attacks. This system required access to the routers of each site. Tests have been performed on the SSFNet (Scalable Simulation Framework) which allowed them to capture and analyze all the network traffic between different sites. The access to routers and the capturing of network traffic of external sites are not possible in real active grid networks. The proposed system needs special permissions from other members of the grid. Therefore it is not clear whether their solution could detect the high number of DDoS attacks in active grid network. Grid-based Intrusion Detection System (GIDS) was proposed by Choon and Samsudin [10]. The GIDS is composed of four main components namely GIDS agents deployed on sensors, a GIDS server handling the agents, a GIDS manager that holds the security policy and the GUI for monitoring alerts. The GIDS can only monitor the sensors where the GIDS agents are running. The deployment of the GIDS agents to monitor sensors in a grid network requires an intensive development task as there exist heterogeneous devices with different types of operating systems. The GIDS cannot handle attacks which target the GIDS server and the GIDS manager. This shows that, when an attacker launches DDoS attacks on a GIDS server and manager, the whole GIDS operation could stop. Even if GIDS agents detect DDoS attack alerts, these alerts will not be processed and correlated by the GIDS server and manager. Security for Grid Service by Von Welch et al. [24] proposed an upgrade to Globus Toolkit version 2 (GT2) so that it became Globus Toolkit version 3 (GT3). It was the first implementation of the Open Grid Service Architecture (OGSA). The OGSA was first suggested by Ian Foster in his paper The Philosophy of the Grid [12]. The OGSA is a type of architecture for service-oriented grid computing networks. The OGSA was developed in Global Grid Forum (GGF). The OGSA provides heterogeneous systems with interoperability in order to communicate with different types of resources. The technical documentation of OGSA version 1.5 [1] recommends to use intrusion detection systems for handling DDoS attacks on grid services. The OGSA does not provide any mechanism to counter DDoS attacks from trusted users. Predation and the cost of replication: New approaches to malware prevention by Richard Ford et al. [11]. uses a ++shield program which is a modified version of the shield program. The Shield was developed by Wang et al. [23], it limits Malicious Mobile Code (MMC) in the network. In their experiments of the simulation of shield heuristic they used the improved version of the shield that was installed by default in all machines. If any machine has been attacked, the victim machine blocks the attack attempts by returning a magic number into the TCP headers or within the packet payload. This technique was useful to overcome Denial of Service (DoS) attacks but could not handle DDoS attacks. In DDoS the attackers use multiple sources with
4
Syed Raheel Hassan et al.
mock IP addresses. Therefore even if the attacked machine keeps blocking the requests, it cannot handle DDoS attacks. Open Source Security Information and Event Management (OSSIM) is composed of a collection of tools which are, Snort (Network Intrusion Detection System), Ntop (Network and usage Monitor), OpenVAS (Vulnerability Scanning), P0f (Passive operative system detection), Pads (Passive Asset Detection System), Arpwatch (Ethernet/IP address parings monitor), OSSEC (Host Intrusion Detection System), Osiris (Host integrity Monitoring), Nagios (Availability Monitoring) and OCS (Inventory). OSSEC monitors security breaches on each host while Snort monitors the entire network. OSSIM has four levels of correlation. Level 1 correlation passes all the events to the GUI of OSSIM. Level 2 correlation passes the events after counting the specified number of occurrences within a specified time period. Both the occurrence and specified time periods are customizable and are set by the administrator. Level 3 and 4 correlation are similarly the advanced versions of preceding levels of correlation. The details are available in the OSSIM documentation [6]. The OSSIM attack detecting, correlating and reporting system is very accurate and advanced but it fails in processing the alerts in real time under intense attacks. Each reported event passes through multiple tools, this process takes time for the alert to be displayed for the administrator at the GUI. This time delay allows the attackers a fair chance to camouflage critical attacks by mingling with DDoS attacks. Security Operation Center (SOC) was proposed by Bourgeois et al. [7] It shows excellent results in single-site networks. The SOC was based on centralized architecture, therefore did not survive in multi-site networks. The SOC stops detecting security alerts in DDoS attacks. Distributed Security Operation Center (DSOC) was proposed by Ganame et al. [13] It overcomes the limitation of the SOC and shows better stability in multi-site networks by detecting DDoS attacks. When the DSOC was deployed in multiadministrative and grid networks, it did not give reliable results. The DSOC does not handle the grid specific properties [8] namely, – The grid network, a combination of different administrative domains, each of them composed of multi-site networks. – In grid network a high number of nodes collaborate with one another. Therefore the size of the network is increasing and decreasing dynamically. – In grid network a view of the security events of external networks is unavailable. – The DSOC under DDoS attacks in a grid network needs much more disk space as it does not have time-based correlation modules. Keeping the above-mentioned issues in view, a new version of the DSOC will be discussed in detail in this article called Grid Security Operation Center (GSOC). The GSOC has been proposed by Bourgeois and Hassan [8] and it overcomes the limitation of the DSOC. To some extent, the GSOC tries to cover two types of DoS attack solutions (i) the preventive solution and (ii) the
DDoS Attack Detection in Grid Computing in Networks
5
reactive solution mentioned in the Grid Computing Security [9] book. The GSOC has two levels of correlation namely, basic and advanced which help the GSOC to detect more sophisticated and distributed attacks. Due to this two-step correlation, the GSOC reduces the size of logs at both the collector and analyzing ends. A very detailed analysis of different alert correlation techniques has been discussed in [21] whereas the GSOC only correlates the same types of attack alerts. The aim of our work is to develop a security operation center dedicated to multi-administrative domain networks. The GSOC with its components can keep stable under massive DDoS attacks. In this paper, the attack-detecting capabilities of the GSOC are compared with the OSSIM and the DSOC.
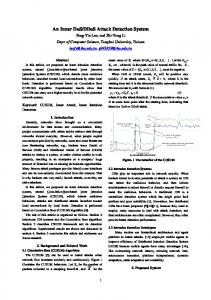
3 Grid Security Operation Center (GSOC) Architecture In this section the components of the GSOC are explained in detail.The GSOC is based on the concept of separate boxes [19] that perform a specific task and on the common intrusion detection framework architecture (CIDF) [20]. A sample of the working GSOC can be seen in the video 1 . The first version was centralized [7] and then distributed [13] for distributed computer networks. The GSOC has six main components which are an event-generating box (EBox), a collecting box (CBox), Remote Data Collector Box (R-CBox), a Local Analyzer which consists of a database box (DBox) and an alert-analyzing box (ABox), a Global Analyzer which contains a global intrusion database called (gidb) and a Secure Virtual Organization Box (SVOBox). More details of the GSOC components are described in [8]. The internal view of each component is presented in figure 1.
3.1 Event-Generating Box (EBox) The EBox is a component in grid network that generates events (figure 1). These events could be of two types. One from the sensors which generates data due to any operation performed on them, this includes operating systems, firewalls, routers, switches, wireless hubs or RADIUS servers. The second type includes different types of pollers or third-party applications that generate events. The latter generates events when a specific state or a threshold value occurs in different network management systems (NMSs). These NMSs are very useful for detecting distributed denial of service attacks by continuous checking system availability via ping or SNMP [7]. If the service stops responding, they generate events defined by the administrators. These events contain raw information and they could have different formats depending on the application. One example of syslog is Dec 6 16:06:05 192.168.8.65 [LOG INFO] 1 We know that an article has to be self-contained, but we wanted to show the reviewers our environment working. Reviewers can therefore access to http://www.youtube.com/watch?v=VUUaRpzusdo
6
Syed Raheel Hassan et al. Global Analyzer is the backup of Local Analyzer DBox
DBox ABox
ABox
Security Alerts from CBoxes
Security Alerts from RCBoxes
Vulnerability Data Base
Global Data Base
Advanced Correlation
Sensor Status
Advanced Correlation
All sensor Status All sensor Configuration
Sensor Configuration
Overall security Policy
Security Policy
Local Analyzer (LA)
Global Analyzer (GA)
Basic Correlation Basic Correlation
Alerts from Cbox after Basic Correlation
Alerts from Cbox after Basic Correlation
Windows
D I
Syslog
BSD
Linux
D I
Proprietary
S
SNMP
Uinux
S
SNMP
Firewall
P A
P A
Apache XtreemOS
SMTP
Events from EBox
T Cisco Pix
HTTP/XML
C
Oracle
H
Proprietary
Snort
E
SSH
........
R
....... Application Agents
SMTP
T C H
SSH
E
.......
R
HTTP/XML ........ Syslog
Protocol Agents Application Agents
Protocol Agents
CBox RCBox Events from EBox
Proprietary Softwares
Events
Events
Operating System Integrity Checking Network Equipment
Events
Wireless Network Devices NMS Security tools/Antivirus Servers
Firewalls, IDS, etc..
Applications ........... EBox Local Site
Fig. 1 GSOC Modular Design
sshd[299]: Failed password for ROOT from 192.168.7.10 port 13322 ssh2 . These type of events are then forwarded to the CBox.
3.2 Collecting Box (CBox) The CBox is a log-collecting module that collects logs from different EBoxes. One CBox is enough for one local site of an administrative domain. More than one CBox can be deployed in one site if the number of generated events
DDoS Attack Detection in Grid Computing in Networks
7
are too high. Every EBox has a different format for reporting the event. The CBox itself contains three different sub modules: protocol agents, dispatcher and application agents. Therefore the CBox collects raw information from different protocols as shown in figure 1. It transports these events from EBoxes to the CBox. The dispatcher that plays an intermediary role is placed between event-receiving protocols and application agents. Application agents are the modules in the CBox which contain the possible attack lists. The dispatcher searches for these reported events from the EBox and tries to match them with available application agent modules like Linux, Windows and XtreemOS. When the reported event matches with any defined attack template, it is then arranged in an internal format before it is sent to the Local Analyzer (LA). The LA contains an alert reporting (ABox) and a database box (DBox) which resides physically in a different machine in the same network site or remote network site of an administrative domain. The GSOC has correlation at two levels, one at the CBox level which is called the basic correlation (BC) and the other is the advanced correlation (AC) present in the LA. Details are to be found in section 4. In the BC the reported events are saved for a small period of time (approximately one minute) locally on the machine where the CBox is running. Afterwards, events are dropped and only the correlated alerts are stored in the local database and are forwarded to the LA. The correlation engine reports whether any of the events reaches a definite threshold and names it a weak brute force attack, a weak ping of death attack or a weak denial of service attack. All the correlated alerts are transferred to the LA for a global view and for further advanced correlation. 3.3 Remote Data Collector (R-CBox) An R-CBox is a special CBox which collects events from sensors hosting security tools shown in 1. It forwards these events to the global analyzer (GA). The GA regularly compares the events received from the CBox and R-CBox. This helps to anticipate a reaction when a critical intrusion occurs or to investigate and troubleshoot a site that could be compromised, even if a hacker erases the logs on the compromised sensors (including the security tools). 3.4 Local Analyzer (LA) The Local Analyzer is composed of two modules (i)an alert-analyzing box (ABox) and (ii)a database box (DBox) (figure 1). The ABox job is to receive the events and alerts from the CBox. All the CBoxes from the multiple local sites of an administrative domain send their alerts after basic correlation to the ABox. The ABox then receives these alerts and further correlates for finding strong brute force, strong ping of death and distributed denial of service attacks. The ABox warns the grid administrator with low, medium, and
8
Syed Raheel Hassan et al.
high-level alerts. These three types of alerts are created by the administrator using the GUI of the GSOC. These alerts are then saved in the DBox. The DBox holds information like Security Policy which contains all the rules created by an administrator for example password-cracking attempts, administrative rights gaining-attempts, log erasion etc. Sensor Configuration which holds all the information related to a node, for example what type of operating system is used on a node, its kernel version number and which services are running. Sensor Status shows whether the node is working or not. Local Intrusion Database (LIDB)/Vulnerability Database which holds vulnerability from common vulnerabilities and exposures [2]. Reported Security Alerts are the alerts which are identified as attacks and these alerts are saved permanently in the database.
3.5 Secure Virtual Organization Box (SVOBox) The Secure Virtual Organization Box (SVOBox) job is to collect all the correlated security alerts (SA) generated in different administrative domains (AD) in a grid computing network (figure 2). The SVOBox assigns security level (SL) value to these ADs using simple metric for real-time security level evaluation by Ganame and Bourgeois [17]. Their proposed method represents criticality in three values indicated by colors (red, orange and green). Green indicates that no threat is occurring in the network. Orange indicates that threats are occurring but they are not critical at this point and red indicates intrusions are in progress which can lead to critical security problems. Their method is dedicated to multi-site network, therefore it needs some modifications before being implemented in the grid computing networks. These modifications are at experimental stage.
3.6 Global Analyzer (GA) The Global Analyzer is the backup of the LA and LIDB shown in figure 1. It plays its role when the LA and LIDB are under an intensive distributed denial of service attack and the LA stops processing security alerts from CBoxes. The GA also maintains a backup of running configuration of the LA and LIDB. This backup is very useful to minimize the downtime due to failures. In addition to above all, the GA receives logs from R-CBoxes and compare them with LA to calculate delta. One R-CBox is deployed at every local site which takes care in case if any CBox fails. R-CBox monitors the security using a variable delta which is defined as, N umber of alerts(A) received at CBox at time(t) =
∞ X A=1
CBoxA (t)
(1)
DDoS Attack Detection in Grid Computing in Networks
9 log
log F.log
g F.lo
CBox
g
lo
lo
lo
lo
g
g
g
Backup
F.log
LA
log
p
c Ba
ku
se
g
aly
lo
an
lidb
g
g
g
log
F. lo
lo
lo
CBox
F. lo
GA
GA CBox
g
log
log
RCBox
lo
log
log
F.log
RCBox
F.log
F.log: Formated logs Cbox: Logs Collection Box LA: Local Analyzer lidb: local intrusion database
log
log
log
g
g
lo
g
g
lo
lo
log
lo
g
g
F.lo
CBox
log
se
F.log
Backup
aly
Backup
an
log
F.log g
g
g
lo
lo
LA
lidb
F. lo
lo
log
log log
log
g
GA
lo
g
RCBox
F.log
F.log
log
log
GA
lo
log
(SVOBox)
g
CBox
Administrative Domain 2
log
RCBox
CBox
g
Secure Virtual Organization Box log
F. lo
CBox
lidb
Administrative Domain 1
CBox
log
LA (Local Analyzer)
analyse
log
lo
F.log log
CBox
g
g lo
Administrative Domain 3
CBox
log
CBox
g
lidb
lo
LA (Local Analyzer)
analyse
log
log
F.log log
CBox
Administrative Domain 4
Fig. 2 Multi-sites network Overview
N umber of alerts(A) received at RCBox at time(t) =
∞ X
RCBoxA (t) (2)
A=1
Deviation =>
∞ ∞ X X p (∆)2 = CBoxA (t) − RCBoxA (t) A=1
(3)
A=1
P ossibilities of attacks are ∝ to the value of ∆
(4)
The greater the value of delta the greater are the chances that the malicious activities are in progress. The deviation (∆) shows that either the local site is under attack or any CBox has stopped processing the alerts. This is possible when the attackers delete the logs coming from different sensors or the attackers target any CBox. The same applies when the attackers target and R-CBox. This mechanism provides GSOC design fault tolerance capability to handle sophisticated attacks.
4 Basic and Advanced Correlation The main purpose of our correlation is to analyze complex information sequences to produce simple, synthesized, real-time alerts. Correlation is a problem in high speed networks where data is flowing very fast discussed by Kruegel [18]. Therefore GSOC introduces two-level correlations: (i) Basic Correlation (BC) and (ii) Advanced Correlation (AC). This two-level hierarchy reduces
10
Syed Raheel Hassan et al.
the network traffic between GSOC components, causes an easier detection of complex intrusions and saves a lot of disk space in grid computing networks. The CBox plays the role of performing basic correlation, whereas the LA is responsible for advanced correlation. Basic correlation performs few operations in order to generate attack alerts which are: – Sequence pattern matching which identifies on-going intrusion processes, as well as complex intrusion scenarios. – Time pattern matching which includes a new important dimension time. The CBox uses a predefined time interval (one minute) in which basic correlation is applied. It uses start time and end time to indicate the first and the last event of the same type. – It identifies duplicates and sets a specific flag in order to keep the information. Duplicate event contain exactly the same information from one event to another except for the time information. – Threshold comparison includes comparison of the collected alerts with a pre-measured threshold. The decision whether an on-going attack is happening is made by this BC engine using the above-mentioned criteria. An accumulated number is generated, which reduces the number of alerts and represents the number of times the source attacked the target. This field can be understood as a number of duplicated alerts. The main purpose of BC is to reduce the network load between the GSOC modules; therefore attack detection is easier to perform because there are two-level hierarchy analyzers. BC does not have the ability to detect distributed denial of service or strong brute force attacks. The CBox is capable of detecting only weak attacks. For example, if two attackers are simultaneously attacking one target sensor in an AD, performing a DDoS or strong brute force attack, the CBox will report one alarm for a DoS attack and one alarm for a weak brute force attack, originating from two different attackers (figure 6). The task of deciding whether it is a DDoS attack or any other kind of strong attack is dedicated to the LA, more specifically to the ABox. The left part of figure 3 is the detailed explanation of basic correlation. The basic correlation module can be considered as a event marker. Each event is labeled depending on its contents, whether it is containing an attack alert or not. 1- Each event sent from the EBoxes is received by the protocol agents at the CBox, then this event is labeled with flag (eg: flag x). 2- This flag points out to the dispatcher that this event should be analyzed first by the application agents. 3- If the received event matches with the security rule, it will be standardized by internal formatting.
DDoS Attack Detection in Grid Computing in Networks
11
4- The dispatcher inspects whether these formatted events are the ones that the administrator is interested in correlating (event originating from ssh session or event from iptable rules at the EBoxes). 5- If it is the case, then these kinds of events are stored in a local database for a very short period of time (at most one minute). The programs deletes old events with a simple SQL query. 6- If it is not, then the CBox forwards the events to the LA (specifically the ABox) in order to display the reported alert as a piece of information to the administrator. Even though these events are not correlated, they have passed through the application agent’s analysis, this means that the administrator might be interested in knowing the minor activities. These kinds of event can also be correlated in future to accomplish network traffic reduction. 7- When the correlation finishes the events are now considered as the alerts. The stored alerts in the local database are marked with the new flag (eg: flag y). This flag is different than the one added to the event (refer to step 2). 8- This flag tells the dispatcher that this alert has already correlated and should be sent to the LA for further analysis. Afterwards, only the correlated alerts are stored in the local database and transferred to the dispatcher which further forwards them to the LA. At this stage, the alerts that contain an attack are forwarded to the LA including those that are attack-free. The communication between the CBox and the LA is over socket protocol. A simplified view of the fields of the correlated alert structure which exchanges the alert between the CBox and the LA is described in figure 4. The tables which are involved in the creation of the alerts are, Message Table : includes all the details of the events received at the CBox. Message Type Table : contains human readable description of Message Type ID. Host Table : identifies each host of the grid computing network that the security system monitors and checks its state (running or down). Host Types : contains human readable description of each host type. The right side of figure 3 explains the advanced correlation of the LA, more specifically the ABox. 9- The CBox sends events and alerts to the ABox, the listener module in the ABox accepts the correlated alerts from the CBox. When a correlated alert arrives at the ABox, a rule manager first checks if the network administrator is interested in monitoring the information about the sensor (monitored device) included in the alert. 10- If it is the case, the alert is stored in the LIDB and reported to the administrator. However, at this stage the administrator still does not have a clear
12
Syed Raheel Hassan et al.
view of the strong attacks on any of its sensors. 11- For this reason, it checks if the alerts that contain an alarm of the attacks (BF, DoS & DDoS) need to be correlated further. 12- If it is the case, then they are stored in a local database for a short period of time (at most one minute, just like the local database at the CBox (refer to step 5)) until the advanced correlation finishes. 13- If it is not, then the events without alarms are dropped, because the administrator has already been informed. 14- The operations for performing the advanced correlation task are (i) target and (ii) time correlation. This module counts the number of notifications for the same target from different sources (attackers) within the time interval (equal to one minute). 15- If there is more than one attacker assaulting the same target (sensor) in the same unit of time (the threshold value is one minute). It generates the strong attack alert. 16- One alert of a strong attack alert is generated and stored in the LIDB, which is also displayed at the GUI of the GSOC (figure 7). 17- If not, then the alert is dropped as the administrator has already been informed about this event.
5 Experiments The objective of our experiments is to show how to efficiently minimize the number of security alerts when the site is under intense distributed or a combination of different attacks. In this section the comparison of the GSOC with the DSOC and the OSSIM under brute force and DDoS attacks is discussed. Due to the destructive nature of DDoS attacks the most intensive DDoS attacks were performed in our lab as we do not want to halt Grid5000 network with our attacks. To calculate the efficiency, the number of alerts generated by the GSOC, DSOC and OSSIM in one hour is taken as a parameter. During the experiments on GSOC and DSOC some of the logs sent from the victim machine to the CBox machine were dropped due to network congestion because the UDP protocol had been used for sending and receiving the logs via rsyslog.
DDoS Attack Detection in Grid Computing in Networks
13
CBOX
LA 1
9
CBOX Dispatcher
Events from the EBoxes
Listener
ABOX Rule manager
Protocol agent adds flag x to the events
Send events/alerts to ABOX
10
2
Store correlated alert in LIDB
NO Event has flag x
Events
Alerts
Send correlated alert to dispatcher
13
11
3 8
YES NO
Alert contains attack alarm
Application agents -> analyze (event) format (event)
Drop the event, the administrator is already informed
YES
4 6 event = SSH event = IPTables
NO
12 store in ABOX local database
YES
5
store in CBOX local database
14
Advanced correlation module POD/DOS/Brute force
15 7
Basic correlation module POD/DOS/Brute force Creation of correlated event with flag y
YES
Distributed attack
Store attack alert in LIDB
NO
Basic Correlation
Drop the alert, the administrator is already informed
Fig. 3 Basic and Advanced Correlation flow chart
Fig. 4 Simplified view of the composition of the formatted alert
17
Advance Correlation
16
14
Syed Raheel Hassan et al.
Fig. 5 GSOC in Grid’5000 Network
5.1 GSOC Attack Detection Capability In this section the GSOC capability to detect different attacks has been tested. Figure 5 is the reference of all the attacks explained in the tables. Table 1, table 2 and table 3 are divided into four columns. The first column contains the attack description. The second column displays the attack detection. The third column shows the status on the CBox which is running in one local site. The fourth column points out the behavior of the LA which is controlling multiple CBoxes. The experiments have been performed in our lab and in the Grid5000 network [3]. In our lab we used 12 virtual machines and two physical ones. The system configuration is as follows: Victim, attacker and CBox: CPU 2.4 GHz having 512 MB of RAM. LA: CPU 2.66 GHz having 3 GB of RAM. 32-bit version of OSSIM was deployed on 1.5 GHZ processor having 512 MB of RAM. In Grid5000 (G5K) Network, Victim: CPU 2.33 GHz 2 cores having 8 GB of RAM. Attacker: CPU 2.33 GHz 2 cores having 8 GB of RAM. CBox and LA: CPU 2.0 GHz 1 core each having RAM 2 GB of RAM.
DDoS Attack Detection in Grid Computing in Networks
15
Table 1 Flooding Attacks Detection Capabilities in the GSOC Flood pollution attacks Description
Action on CBox
Action on LA
Attacker floods the GSOC sensor with Apsend [22], followed by a BF attack (with THC Hydra [14])
Detection YES
The CBox detects a weak BF attack on the victim sensor and sends formatted alerts to the LA
No alarm generated for a strong BF attack, as there is only one attacker
Attacker floods the GSOC sensor with Apsend, followed by a BF attack (with Guess Who [4])
YES
The CBox detects a weak BF attack on the victim sensor and sends formatted alerts to the LA
No alarm generated for a strong BF attack, as there is only one attacker
Attacker floods the GSOC sensor with Apsend followed by a BF attack (with Medusa [15])
YES
The CBox detects a weak BF attack on the victim sensor and sends formatted alerts to the LA
No alarm generated for a strong BF attack, as there is only one attacker
Attacker 1 floods the GSOC sensor with 2000 pings generated by Apsend, followed by a brute force attack from THC Hydra. Attacker 2 generates a BF attack by Medusa followed by Guess Who
YES
The CBox detects a weak BF attack on the victim sensor and sends formatted alerts to the LA
The LA reports a strong BF attack, pointing out the victim sensor and the source machines of attackers 1 & 2 responsible for the attack
Attacker 1 floods GSOC sensor with 4000 SYN packets generated by Apsend, followed by a BF attack from THC Hydra. Attacker 2 generates a BF attack with Medusa followed by Guess Who
YES
The CBox detects a weak BF attack on the victim sensor and sends formatted alerts to the LA
The LA reports a strong BF attack, pointing out the victim sensor and the source machines of attackers 1 & 2 responsible for the attack
Table 2 Brute Force (BF) Attack Detection Capabilities in GSOC BF attack Description
Action on CBox
Action on LA
Attacker launches a brute force attack on a sensor with Medusa
Detection YES
The CBox detects a weak BF attack on the victim sensor and sends formatted alerts to the LA
No alarm generated for a strong BF attack, as there is only one attacker
Attacker launches a BF attack on a sensor with Guess Who
YES
The CBox detects a weak BF attack on the victim sensor and sends formatted alerts to the LA
No alarm generated for a strong BF attack, as there is only one attacker
Attacker 1 launches a BF attack on a sensor with THC Hydra and Attacker 2 generates a BF attack with Guess Who on the same sensor
YES
The CBox detects a weak BF attack on the victim sensor and sends formatted alerts to the LA
Alarm for a strong BF attack is generated, pointing out the victim sensor and the source machines responsible for the attack
Table 3 Distributed Denial of Service (DDoS) Attack Detection Capabilities in GSOC DoS and DDoS Attacks Description
Action on CBox
Action on LA
Attacker generates a ping of death attack (PoD) with a packet size of 65535 bytes with time interval is 0.2 second
Detection YES
DoS is detected, pointing out the attacker’s machines. After the detection a formatted alert is sent to the LA
No alarm generated for the DDoS, since there is only one attacker
Attacker 1 and Attacker 2 generate a PoD attack with a packet size of 65535 bytes with time interval is 0.2 second
YES
DoS is detected, pointing out the attackers machines. After the detection, a formatted alert is sent to the LA
Alarm for a DDoS attack is generated, pointing out the attackers machines responsible for the attack
Attacker launches a Slowloris attack on an Apache web server
YES
DoS is detected, pointing out the attacker’s machines. After the detection, a formatted alert is sent to the LA
No alarm generated for the DDoS, since there is only one attacker
Slowloris attack on an Apache web server, followed by a PoD attack with a packet size of 65535 bytes, followed by a BF attack (by THC Hydra)
YES
Two different types of DoS attacks (Slowloris and PoD) and a Weak BF attack are detected, pointing out the attacker’s machine. After each attack detection, a formatted alert is sent to the LA
No alarm generated for the DDoS, since there is only one attacker
Slowloris attack on an Apache web server in parallel with a PoD attack with a packet size of 65535 bytes and a BF attack (by THC Hydra) from one attacker
YES
Two different types of DoS attacks (Slowloris and PoD) and weak BF attacks are detected, pointing out the attacker’s machine. After each attack detection, a formatted alert is sent to the LA
No alarm generated for the DDoS, since there is only one attacker
In the G5K, Rennes was used for attackers, the CBox and victim machines. Nancy for the LA and Bordeaux for the DSOC. Please refer to figure 5 for details.
16
Syed Raheel Hassan et al.
5.2 GSOC, DSOC and OSSIM behavior under brute force attack For launching the brute force attack, THC hydra [14] was used with a password file of 8048 passwords. The required password was placed at the 8048th place in the password file of Attacker 1 and no correct password was provided to Attacker 2. In this test two attackers (Attacker 1 and Attacker 2) are performing the attack on a target machine called victim (figure 5). This diagram shows the Grid’5000 network infrastructure. It consists of nine sites dispersed in different regions of France. The victim is a machine located at the Rennes site. There are different clusters having many nodes at the Rennes site, the victim machine is a node we reserved for our experiments. Attacker 1 launches an attack from the Bordeaux site and Attacker 2 launches an attack from the Rennes site. The logs generated by the victim machines are forwarded to the CBox placed in another node at the Rennes site. These logs are minimized by basic correlation at the CBox and then sent to the LA for advanced correlation which further minimizes the logs and generates few alarms. The alarms which are displayed on the GUI by using the apache web server are stored in the LIDB. The behavior of the GSOC can be seen in figures 8 and 9. Each CBox correlates the local site alerts of the AD and reports to the GUI as a weak attack (figure 6). The reported alerts at each CBox are forwarded to the ABox for advanced correlation. The alerts received by the Abox from different CBoxes are finally reported as the strong attack alarm. (figure 7). The alerts reported at the CBox and alarms at the ABox contain all the necessary information which includes the IP address of the sources, the start and end time of the attack which is equal to the elapsed time of one minute, the user’s name (Attacker 1 or Attacker 2) by whom the attack has been launched. They also provide the target IP addresses and the number of attempts (count) made by each attacker. This information is very helpful for the network administrator to stop these attacks from expending. The behavior of the DSOC in figures 8 and 9 shows that the DSOC has generated one alert for every password attempt. This shows that in one hour the network administrator has received more than 16K alerts in our lab and more than 22K in the Grid5000 network from one victim (figure 5). The behavior of the OSSIM in figure 8 shows that level 1 correlation passes all the authentication failure alerts to the GUI (refer to the code of level 1 correlation). Level 2 correlation starts working when level 1 correlation finishes after receiving one authentication failure. Level 2 correlation covers two possibilities first the authentication success which could occur after one authentication failure in level 2 correlation. This means that there is a total of two authentication failures, one from level 1 correlation and other from level 2 correlation. Second it receives authentication failures for the period of 10 seconds defined in the “time out” field. If one authentication successful event is received within 20 seconds then level 2 correlation is finished. Level 2 correlation merges multiple occurrences of authentication failures and generates only one alert (refer to the code of level 2 correlation). If no authentication
DDoS Attack Detection in Grid Computing in Networks
17
successful event is received then it will pass the information to level 3 correlation. Level 3 correlation starts working when level 2 correlation finishes after receiving 20 or more occurrences in 10 seconds. The level 3 correlation also covers two possibilities: first, the authentication success which could occur after one authentication failure in level 3. This means that there is a total of more than 20 authentication failures, one from level 1 correlation, 20 from level 2 correlation. Second it receives authentication failures for the period of 40 seconds defined in the “time out” field. If one authentication successful event is received within 40 seconds then level 3 correlation is finished. Level 3 Correlation merges multiple occurrences of authentication failures and generates only one alert (refer to the code of level 3 correlation). If no authentication successful event is received then it will pass the information to level 4 correlation. Level 4 correlation starts working when level 3 correlation finishes after receiving 100 or more occurrences in 40 seconds. Level 4 correlation also covers two possibilities: first, the authentication success which could occur after one authentication failure in level 4 correlation. This means that there is a total of more than 100 authentication failures, one from level 1 correlation, 20 from level 2 correlation and 100 from level 3 correlation. Second it receives authentication failures for the period of 300 seconds defined in the “time out” field. If one authentication successful event is received within 300 seconds then level 4 correlation is finished. Level 4 correlation merges the 1000 occurrences of authentication failures and generates only one alert (refer to the code of level 4 correlation). Code of Level 1 Correlation 1 2 3 4 5
< d i r e c t i v e i d=” 5 0 0 0 1 0 ” name=”SSH B r u t e F o r c e A t t a c k A g a i n s t ANY IP” p r i o r i t y =” 5 ”> < r u l e t y p e=” d e t e c t o r ” name=”SSH A u t h e n t i c a t i o n f a i l u r e ” r e l i a b i l i t y =” 0 ” o c c u r r e n c e=” 1 ” f r o m=”ANY” t o=”ANY” p o r t f r o m=”ANY” p o r t t o=”ANY” p l u g i n i d=” 4 0 0 3 ” p l u g i n s i d=” 1 , 2 , 3 , 4 , 5 , 6 , 9 , 1 0 , 1 2 , 1 3 , 1 4 , 1 5 , 1 6 , 2 0 ”> < r u l e s>
Code of Level 2 Correlation 1 2 3 4 5 6 7 8
< r u l e t y p e=” d e t e c t o r ” name=”SSH S u c c e s s f u l Auth ( A f t e r 1 f a i l e d ) ” r e l i a b i l i t y =” 1 ” o c c u r r e n c e=” 1 ” f r o m=” 1 :SRC IP ” t o=” 1 :DST IP ” p o r t f r o m=”ANY” t i m e o u t=” 10 ” p o r t t o=”ANY” p l u g i n i d=” 4 0 0 3 ” p l u g i n s i d=” 7 , 8 ” /> < r u l e t y p e=” d e t e c t o r ” name=”SSH Auth f a i l u r e ( 1 0 t i m e s ) ” r e l i a b i l i t y =” 2 ” o c c u r r e n c e=” 20 ” f r o m=” 1 :SRC IP ” t o=” 1 :DST IP ” p o r t f r o m=”ANY” t i m e o u t=” 10 ” p o r t t o=”ANY” p l u g i n i d=” 4 0 0 3 ” p l u g i n s i d=” 1 , 2 , 3 , 4 , 5 , 6 , 9 , 1 0 , 1 2 , 1 3 , 1 4 , 1 5 , 1 6 , 2 0 ” s t i c k y=” t r u e ”> < r u l e s>
Code of Level 3 Correlation 1 2 3 4 5 6 7 8
< r u l e t y p e=” d e t e c t o r ” name=”SSH S u c c e s s f u l Auth ( A f t e r 1 f a i l e d ) ” r e l i a b i l i t y =” 3 ” o c c u r r e n c e=” 1 ” f r o m=” 1 :SRC IP ” t o=” 1 :DST IP ” p o r t f r o m=”ANY” t i m e o u t=” 40 ” p o r t t o=”ANY” p l u g i n i d=” 4 0 0 3 ” p l u g i n s i d=” 7 , 8 ” /> < r u l e t y p e=” d e t e c t o r ” name=”SSH Auth f a i l u r e ( 1 0 0 t i m e s ) ” r e l i a b i l i t y =” 4 ” o c c u r r e n c e=” 1 0 0 ” f r o m=” 1 :SRC IP ” t o=” 1 :DST IP ” p o r t f r o m=”ANY” t i m e o u t=” 40 ” p o r t t o=”ANY” p l u g i n i d=” 4 0 0 3 ” p l u g i n s i d=” 1 , 2 , 3 , 4 , 5 , 6 , 9 , 1 0 , 1 2 , 1 3 , 1 4 , 1 5 , 1 6 , 2 0 ” s t i c k y=” t r u e ” />
18
Syed Raheel Hassan et al.
Fig. 6 GSOC GUI: weak alert reported to CBox
Fig. 7 GSOC GUI: strong alert reported to LA
Code of Level 4 Correlation 1 2 3 4 5 6 7 8 9
< r u l e t y p e=” d e t e c t o r ” name=”SSH S u c c e s s f u l A u t h e n t i c a t i o n ( A f t e r 1 f a i l e d ) ” r e l i a b i l i t y =” 5 ” o c c u r r e n c e=” 1 ” f r o m=” 1 :SRC IP ” t o=” 1 :DST IP ” p o r t f r o m=”ANY” t i m e o u t=” 3 0 0 ” p o r t t o=”ANY” p l u g i n i d=” 4 0 0 3 ” p l u g i n s i d=” 7 , 8 ” /> < r u l e t y p e=” d e t e c t o r ” name=”SSH A u t h e n t i c a t i o n f a i l u r e ( 1 0 0 0 t i m e s ) ” r e l i a b i l i t y =” 6 ” o c c u r r e n c e=” 1 0 0 0 ” f r o m=” 1 :SRC IP ” t o=” 1 :DST IP ” p o r t f r o m=”ANY” t i m e o u t=” 3 0 0 ” p o r t t o=”ANY” p l u g i n i d=” 4 0 0 3 ” p l u g i n s i d=” 1 , 2 , 3 , 4 , 5 , 6 , 9 , 1 0 , 1 2 , 1 3 , 1 4 , 1 5 , 1 6 , 2 0 ” s t i c k y=” t r u e ” />
5.3 GSOC, DSOC and OSSIM behavior under Ping of Death This is a ping-of-death(PoD) attack scenario for the GSOC, DSOC and OSSIM (figure 5). The attack scenario is the same as discussed in subsection 5.2. We have used very simple PoD attacks using hping. The hping is a free packet
DDoS Attack Detection in Grid Computing in Networks
19
Number of generated alarms
104
103
102
101 A
B
C
D
A- GSOC Basic Correlation in our lab C- DSOC in our Lab E- OSSIM Level 2 Correlation G- OSSIM Level 4 Correlation
E
F
G
B- GSOC Advanced Correlation in our lab D- OSSIM Level 1 Correlation F- OSSIM Level 3 Correlation
Fig. 8 GSOC comparison with the OSSIM and the DSOC under brute force attack in our lab
Number of generated alarms
104
103
102
101 A A- GSOC Basic Correlation in Grid5000 C- DSOC in Grid5000
B
C B- GSOC Advanced Correlation in Grid5000
Fig. 9 Deployment of GSOC and DSOC in Grid5000 Network under brute force attack
generator and analyzer for TCP/IP [5]. The commands below send a two ping request per second, having the size of a 65495-byte packet 65495 to the victim machine. Attacker 1: hping3 -i u500000 -d 65495 IP Address of the Victim
20
Syed Raheel Hassan et al.
Attacker 2: hping3 -i u500000 -d 65495 IP Address of the Victim The motive of our tests is to show the performance of the GSOC, DSOC and OSSIM when attackers are generating huge traffic that would lead to DoS/DDoS attacks. These attacks are used to camouflage the real attacks. Hping can be used to launch very sophisticated attacks which can halt the operation of a network. We have not performed very critical attacks because we do not want to stop the operation of any network. In order to detect a DDoS/DoS attack in the GSOC, ping packets bigger than 85 bytes will be discarded. Iptable rules have been used to log an alert if any packet bigger than 85 bytes has been received by the sensor. In the code of the GSOC when the CBox script executes the iptables, rules have been added automatically. The iptable rules that have been used are as follows: Iptables -A INPUT -d0/0 -s0/0 -p icmp -m length -length 85: -j LOG -log-prefix ”PING OF DEATH“ Iptables -A Iptables -A INPUT -d0/0 -s0/0 -p icmp -m length length 85: -j DROP These iptable rules generate kernel warnings which means that each ICMP packet greater than 85 bytes will be reported. The results can be seen in figures 10 and 11. The behavior of the DSOC shows that it generates one alert per hping request. That means two alerts per second from one attacker. This shows that in one hour the network administrator has received more than 14K alerts from one victim (figures 10 and 11). We have not deployed the OSSIM in G5K because the OSSIM support is not available in their network. The OSSIM generates one alert for every hping request from one attacker. According to the hping command, from two attackers OSSIM has to generate 4 alerts in one second and a total of 14400 alerts in one hour. But due to the slow processing of alerts OSSIM lacks in spontaneous reporting which can be seen in figure 10.
6 Explanations of Results The objective of the experiments was to minimize the number of security alerts when the sites are under intense distributed or a combination of attacks while lowering down the reporting delay. Table 4 shows the performance of the GSOC, DSOC and OSSIM and how quickly they detect and report security alerts. The THC Hydra took 1 hour 15 min to complete the list of 8048 passwords. The GSOC detects all the failure attempts and completes reporting within 1 hour 21 min. The DSOC detects all the failure attempts and completes reporting within 1 hour 33 min. The OSSIM detects all the failure attempts and completes reporting within 5 hour 28 min. The tests were started simultaneously, the results show that GSOC processing capability is
DDoS Attack Detection in Grid Computing in Networks
21
Number of generated alarms
104
103
102
101 A
B
C
A- GSOC Basic Correlation in our lab C- DSOC in our Lab
D
B- GSOC Advanced Correlation in our lab D- OSSIM Level 1 Correlation
Fig. 10 Comparison of the GSOC with the OSSIM and the DSOC under Ping-of-Death attack in our lab
Number of generated alarms
104
103
102
101 A
A- GSOC Basic Correlation in our lab C- DSOC in our Lab
B
C B- GSOC Advanced Correlation in our lab
Fig. 11 Deployment of GSOC and DSOC in Grid5000 Network under Ping-of-Death attack
much better than that of the DSOC and that of the OSSIM. Therefore the delay in reporting is directly proportional to the risk of network compromise. Although there is a delay of 60 seconds while the alert moves from CBox to LA (explained in section 4), but this delay is low compare to the DSOC and the OSSIM. Figure 12 shows the alert correlation. Each CBox generates certain number of alerts depending on the type of the attack. Each CBox then send these
Number of generated alarms
22
Syed Raheel Hassan et al.
150
100
50
0
5
10
One CBox
15
20
25 30 35 40 Time in minutes Two CBoxes Three CBox
45
50
55
60
Advance Correlation
Fig. 12 Correlation of Security Alerts Coming from Different CBoxes
alerts to the ABox for advance correlation. The ABox receives all the alerts and merges them according to the similarity of the the type of the attack launched by the same source. The yellow line and green dotted lines show the behavior when one CBox is deployed. The blue line shows the behavior when two CBoxes are deployed. The red line shows the behavior when three CBoxes are deployed. The green dotted line which denotes the behavior of the advance correlation will remain same when two or three CBoxes are deployed because ABox does time correlation and it generates only one alert in one minute. If the same source is involved in attacking all the three CBoxes it will be detected at advance correlation and reports for the distributed attack to the administrator. This helps in identifying the actual root cause of the attack where as with basic correlation this was not possible. Details are discussed in table 1,2 and 3. Table 5 shows the database utilization of GSOC, DSOC and OSSIM during the BF and DoS attack. The BF was launched by two attackers using the dictionary of passwords which contains 8048 passwords. Two CBoxes sends their logs to the LA which detects strong BF attack. In the DoS attack two pings of 65495-byte per second were sent at the victim machines. Two CBoxes sent their logs to the LA for the detection of DoS attack. These are the approximate size of the alerts which are stored in a database. Whereas in a running system there are many other parameters which are stored with the alerts like sensor uptime, operating system information, asset values, priorities, etc. which are not considered here. Figure 13 shows bandwidth utilization of GSOC, DSOC and OSSIM during different frequencies of DoS attacks. The actual attack lasts for more than one hour with flood mode option enabled using hping but here only the first 30 seconds are taken for showing the difference. In this test one packet and 10 packets were sent per second to the victim machines having the packet size of 65100 bytes. The Snort uses the rule defined as alert ip any any ->any any (fragbits:!D; msg: ”ICMP packet”). The ”any any” option allows snort
DDoS Attack Detection in Grid Computing in Networks
23
Table 4 Performance comparison of GSOC, DSOC and OSSIM Name of Tool
Start Time (ts )
End Time (te )
Total Time (tt )
THC HYDRA
12H:17min
13H:32min
1H:15min
GSOC
12H:17min
13H:38min
1H:21min
DSOC
12H:17min
13H:50min
1H:33min
OSSIM
12H:17min
17H:45min
5H:28min
Table 5 Approximate Database Utilization of GSOC, DSOC and OSSIM Name of Tool
Brute Force Attack
Denial of Service Attack
GSOC BC
28KB
26KB
GSOC AC
14KB
11KB
DSOC
3819KB
3370KB
OSSIM
2098KB
1471KB
to sniff any packet from any source to any destination. The ”->” operator sets the direction to sniff the packets. The option ”fragbits:!D” generate alert for every IP packet that does not have the fragment bit set. The option ”msg” stores the ”ICMP packet” tag and logs in the snort database and forwards to the CBox. In the experiments the Maximum Transmission Unit (MTU) was 1500 bytes. Therefore when the ICMP packet of 65100 bytes was set to send on the network, it was fragmented into 1480 bytes of packets while 20 bytes were reserved for the IP header. For transmitting 65100 bytes on the network fragmentation was used, 43 packet of 1480 bytes gives the total of 63640 bytes and a last packet (44th) of 1460 bytes + 20 bytes of IP header. This rule generated 44 alerts for every fragment of the packet because Snort was working in a sniffer mode and forwards every tag of ICMP packet to the CBox. The first four graphs (brown, blue, yellow and pink) which represents GSOC correlation, OSSIM correlation level 4, OSSIM correlation level 3 and DSOC were generated when one attacker sent one packet in one second to the victim machine. The fifth (green) graphs shows the behavior under flood mode this means 10 packets were sent from one attacker to the victim machine in one second. The sixth (red) graph shows the behavior under flood mode this means 10 packets were sent from two attackers to the victim machine in one second.
24
Syed Raheel Hassan et al.
Bandwidth utilization in kilo-bits
106 105 104 103 102 101 100
5
10
15 Time in seconds
GSOC Correlation OSSIM Correlation Level 3 DSOC 10 packet per second by 1 attacker
20
25
30
OSSIM Correlation Level 4 DSOC 1 packet per second by 1 attacker DSOC 10 packet per second by 2 attacker
Fig. 13 Bandwidth Utilization under DoS Attack
7 Conclusion The experiments have been conducted to show that how GSOC efficiently minimizes the security alerts and lower the delay for reporting the attacks under distributed and combination of different attacks. In the experiments the stability and performance of different security management systems were compared, where attackers generate large security alerts using DDoS and BF attacks. GSOC which has been explained in this paper stores the alerts in the local database at the CBox. Only the correlated alerts are stored locally and are further transferred to the LA for advanced correlation which reduces the size of database and network bandwidth. The results are shown in figure 13 and table 5 which are discussed in section 6. The experiments show that GSOC has generated few alerts compared to DSOC and OSSIM. The GUI shows that the GSOC generates a concise and accurate security alert after correlating a comprehensive event record from one or multiple attackers. It has been shown that GSOC has better performance over DSOC and OSSIM. Due to the basic and advanced correlation in GSOC the administrator will have spontaneous security alert information, which is not possible under intense DDoS attacks. This correlation of security alerts and stability makes GSOC resilient to intensive distributed denial of service and brute force attacks. GSOC is the first attempt to handle intense DDoS attacks in grid computing networks. GSOC needs more study and development in order to include more features and attacks. We are working on it to ensure improvement.
DDoS Attack Detection in Grid Computing in Networks
25
Acknowledgements Thanks to the Laboratory of Computer Science University of FrancheComte France, the Higher Education Commission and Quaid-e-Awam University of Engineering, Sciences and Technology Pakistan for supporting our work financially and to the Grid’5000 network for providing us with the platform to perform tests
References 1. The open grid services architecture, version 1.5. Available from: http://www.ogf.org/documents/GFD.80.pdf, 2002-2006. 2. Common vulnerabilities and exposures is a dictionary of publicly known information security vulnerabilities and exposures. Access from: http://cve.mitre.org/, 2010. 3. Grid’5000 is a scientific instrument for the study of large scale parallel and distributed systems. Access from: https://www.grid5000.fr/mediawiki/index.php/Grid5000:Home, 2010. 4. Guess who is a password brute force utility for attacking secure shell version 2 accounts. Available from: http://www.vulnerabilityassessment.co.uk/guesswho.htm, 2010. 5. Hping is a command-line oriented tcp/ip packet assembler/analyzer. Available from : http://www.hping.org/, 2011. 6. Open source security information and event management (ossim). Access from:http://alienvault.com/resources/documentation/technicaldocumentation, 2011. 7. Julien Bourgeois, Renaud Bidou, and Fran¸cois Spies. Towards a global security architecture for intrusion detection and reaction management. In K. Chae and M. Yung, editors, Proc. of the 4th Int. Ws. on Information Security Applications, WISA 2003, volume 2908 of LNCS, pages 129–142, Jeju, Corea, August 2003. 8. Julien Bourgeois and Syed Raheel Hassan. Managing security of grid architecture with a grid security operation center. In SECRYPT’09, Int. Conf. on Security and Cryptography, Milan, Italy, pages 403–408. INSTICC Press, July 2009. 9. Anirban Chakrabarti. Grid Computing Security. Springer, 2007. 10. Ong Tian Choon and A. Samsudin. Grid-based intrusion detection system. Communications, 2003. APCC 2003. The 9th Asia-Pacific Conference on, 3(0-7803-8114-9):1028– 1032, 21-24 Sept 2003. 11. Richard Ford, Mark Bush, and Alexander Bulatov. Predation and the cost of replication: New approaches to malware prevention? Computers & Security, 25(4):257–264, 2006. 12. Ian Foster, Carl Kesselman, Jeffrey M.Nick, and Steven Tuecke. The physiology of the grid: An open grid services architecture for distributed systems integration. Available from: http://www.globus.org/alliance/publications/papers/ogsa.pdf, 2002. 13. Abdoul Karim Ganame, Julien Bourgeois, Renaud Bidou, and Fran¸cois Spies. A global security architecture for intrusion detection on computer networks. Computers & Security, 27(1-2):30–47, 2008.
26
Syed Raheel Hassan et al.
14. Van Hauser. The hacker’s choice, a very fast network logon cracker which support many different services. Available from: http://freeworld.thc.org/, 2010. 15. JoMo-Kun. Medusa is intended to be a speedy, massively parallel, modular, login brute-forcer, 2010. 16. Wael Kanoun, Nora Cuppens-Boulahia, Fr´ed´eric Cuppens, Samuel Dubus, and Antony Martin. Success likelihood of ongoing attacks for intrusion detection and response systems. In Proceedings of the 2009 International Conference on Computational Science and Engineering - Volume 03, pages 83–91, Washington, DC, USA, 2009. IEEE Computer Society. 17. Ganame Abdoul Karim and Julien Bourgeois. Defining a simple metric for real-time security level evaluation of multi-sites networks. Parallel and Distributed Processing, 2008. IPDPS 2008. IEEE International Symposium, 14-18:1 – 8, April 2008. 18. Christopher Kruegel. Intrusion Detection and Correlation: Challenges and Solutions. Springer-Verlag TELOS, Santa Clara, CA, USA, 2004. 19. Stephen Northcutt and Judy Novak. Network Intrusion Detection. ISBN: 0-73571-265-4. New Riders, third edition edition, 2002. September. 20. Phil Porras, Dan Schnackenberg, Stuart Staniford-Chen, Maureen Stillman, and Felix Wu. The common intrusion detection framework architecture (cidf). Available from http://gost.isi.edu/cidf/drafts/architecture.txt, 1998. 21. Reza Sadoddin and Ali Ghorbani. Alert correlation survey: framework and techniques. In Proceedings of the 2006 International Conference on Privacy, Security and Trust: Bridge the Gap Between PST Technologies and Business Services, PST ’06, pages 1–10, NY, USA, 2006. ACM. 22. Sventek. Apsend is a tcp/ip packet sender to test firewalls and other network applications. Available from: http://packetstormsecurity.org/, 2010. 23. Helen J. Wang, Chuanxiong Guo, Daniel R. Simon, and Alf Zugenmaier. Shield: vulnerability-driven network filters for preventing known vulnerability exploits. SIGCOMM Comput. Commun. Rev., 34:193–204, August 2004. 24. Von Welch, Jarek Gawor, Carl Kesselman, Sam Meder, and Laura Pearlman. Security for grid services. In In Twelfth International Symposium on High Performance Distributed Computing (HPDC-12, pages 48–57. IEEE Press, 2003. 25. Yang Xiang and Wanlei Zhou. Protect grids from ddos attacks. In GCC, pages 309–316, 2004.