Distributed Representation as a Principle for the Analysis of Cockpit Information Displays Jiajie Zhang Department of Psychology The Ohio State University 1827 Neil Avenue Columbus, OH 43210-1222
[email protected] 1994), that different representations of a common abstract structure can have different representational efficiencies and produce different behavioral outcomes, is the central issue in the design of efficient cockpit information displays. This article examines the representational effect in cockpit information displays from the perspective of distributed representations (Zhang & Norman 1994). The basic idea is that many tasks in a cockpit cannot be accomplished without the interactive processing of information distributed across the external information displays in the cockpit and the internal minds of the pilots (e.g., Hutchins, 1995; Norman, 1991, 1993). This article is divided into four sections. The first section introduces the principle of distributed representations. The second section shows the distributed representation of scale information of dimensions, which are the basic structures of cockpit information displays. The third section uses navigation displays as an example to show the application of the principle of distributed representations in the analysis of cockpit information displays.
Abstract This article examines the representational properties of cockpit information displays from the perspective of distributed representations (Zhang & Norman, 1994). The basic idea is that the information needed for many tasks in a cockpit is distributed across the external information displays in the cockpit and the internal minds of the pilots. It is proposed that the relative distribution of internal and external information is the major factor of a displayÕs representational efficiency. Several functionally equivalent but representationally different navigation displays are selected to illustrate how the principle of distributed representations is applied to the analysis of the representational efficiencies of cockpit information displays.
A large number of cockpit instruments, such as altimeters and navigation displays, are information displays that serve representational functions. It is commonly known that among a certain set of alternative displays that represent the same information, some can be better than others. For example, some types of altimeters (e.g., tape altimeter) are more efficient than others (e.g., analog altimeter) for certain tasks even if they all represent the same informationÑaltitude. This representational effect (see Zhang & Norman,
This research was supported in part by Grant No. N00014-96-1-0472 from the Office of Naval Research. I am very grateful to Ed Hutchins and Don Norman for valuable discussions and suggestions. I would also like to thank the reviewers for valuable comments. Correspondence and requests for reprints should be sent to Jiajie Zhang, Department of Psychology, The Ohio State University, 1827 Neil Avenue, Columbus, OH 43210-1222, USA. Email:
[email protected].
1
Cockpit Information Displays
The fourth section summarizes the major results and discusses the implications of distributed representations for the studies of situation awareness and direct interaction interfaces. Distributed Representations Many real world tasks are distributed cognitive tasksÑtasks that require people to process the information perceived from external representations and the information retrieved from internal representations in an interwoven, integrative, and dynamic manner. The basic principle of distributed representations is that the representation of a distributed cognitive task is neither solely internal nor solely external, but distributed as a system of distributed representations with internal and external representations as two indispensable parts (Zhang & Norman, 1994). External representations are the representations in the environment, as physical symbols or objects (e.g., symbols of an instrument symbology, graphic icons or objects in an information display, hands of an analog altimeter, etc.) and external rules, constraints, or relations embedded in physical configurations (e.g., spatial relations of written digits, visual and spatial layouts of a graph, physical constraints in an abacus, etc.). The information in external representations can be picked up by perceptual processes. In contrast, internal representations are the representations in the mind, as propositions, productions, schemas, mental images, neural networks, or other forms. The information in internal representations has to be retrieved from memory by cognitive processes. For example, in the task of multiplying 735 by 278 using paper and pencil, the internal representations are the values of individual symbols (e.g., the value of the arbitrary symbol "7" is seven), the addition
2
and multiplication tables, arithmetic procedures, etc., which have to be retrieved from memory; and the external representations are the shapes and positions of the symbols, the spatial relations of partial products, etc., which can be perceptually inspected from the environment. To perform this task, the information in internal representations and that in external representations need to be integrated and exchanged in an interwoven manner. Cockpit information displays, as well as other systems such as relational information displays (Zhang, 1996) and numeration systems (Zhang & Norman, 1995), are distributed representation systems. From the perspective of distributed representations, external representations are intrinsic components and essential ingredients of distributed cognitive tasks. They need not be re-represented as internal representations in order to be involved in distributed cognitive tasks: they can directly activate perceptual processes and directly provide perceptual information that, in conjunction with internal representations, determine people's behavior. The Representation of Dimensions Dimensions are the basic structures of cockpit information displays. A dimension, as defined by Garner (1978), is a component property of a stimulus that has alternative, mutually exclusive levels. For example, hue, brightness, shape, length, and orientation are all examples of dimensions. The information of a dimension that is perceived, processed, and manipulated is always the scale information of the dimension. Thus, how the scale information of the dimensions in a cockpit information display is represented across internal and external representations can directly affect the representational efficiency of the display. Psychological scales and their distributed repre-
Cockpit Information Displays
sentations have been analyzed for relational information displays (Zhang, 1996) and for numeration systems (Zhang & Norman, 1995). To introduce the relevant background knowledge for the present study, they are re-analyzed in the context of cockpit information displays in the following two subsections. Psychological Scales Every dimension is on a certain type of scale, which is the abstract measurement property of the dimension. Stevens (1946) identified four major types of psychological scales: ratio, interval, ordinal, and nominal. Each type has one or more of the following formal properties: category, magnitude, equal interval, and absolute zero (see Table 1). Category refers to the property that the instances on a scale can be distinguished from each other. Magnitude refers to the property that one instance on a scale can be judged greater than, less than, or equal to another instance on the same scale. Equal interval refers to the property that the magnitude of an instance represented by a unit on the scale is the same regardless of where on the scale the unit falls. An absolute zero is a value which indicates the nonexistence of the property being represented. Nominal scales only have one formal property: category. Airport names are an example of nominal scales: they only discriminate between different entities but have no information about magnitudes, intervals, and ratios. Ordinal scales have two formal properties: category and magnitude. Seat classes on commercial airplanes are an example of ordinal scales: first class is better than economy class (magnitude) and the quality of first class is different from that of economy class (category). However, the classes themselves tell us nothing about the interval differences and ratios between the classes.
3
Interval scales have three formal properties: category, magnitude, and equal interval. Heading (orientation) of airplane is an example of interval scales: a 30° heading is different from a 50° heading (category), 50° is further away from north than 30° (magnitude), and the difference between 30° and 50° is the same as that between 240° and 260° (equal interval). However, heading does not have an absolute zero because in addition to north, any orientation can be arbitrarily selected as the zero point. Thus, we cannot say that a 100° heading is twice as large as a 50° heading. (However, we can say that a 100° angle is twice as large as a 50° angle because angle is on a ratio scale). Ratio scales have all of the four formal properties: category, magnitude, equal interval, and absolute zero. Distance is an example of ratio scales: 10 nautical miles (NM) is different from 30 NM (category), 30 NM are longer than 10 NM (magnitude), the difference between 10 NM and 30 NM is the same as the difference between 50 NM and 70 NM (equal interval), and 0 NM means the nonexistence of distance (absolute zero). For distance, we can say that 30 NM is three times as long as 10 NM. The Distributed Representation of Scales From Table 1 we can see that the four types of scales have an order of repTable 1. The Formal Properties of Psychological Scales Formal
Scale Types
Properties
ratio
category
yes
yes
yes
yes
magnitude
yes
yes
yes
no
equal interval
yes
yes
no
no
absolute zero
yes
no
no
no
Example
interval ordinal nominal
distance heading seat class airport name
Cockpit Information Displays
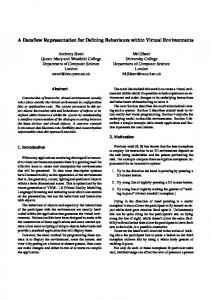
resentational power: ratio > interval > ordinal > nominal. A higher scale (e.g., ratio) possesses more information (more formal properties) than a lower scale (e.g., nominal). In general, the scale information of a dimension is distributed across internal and external representations as a distributed representation. In Figure 1, for instance, the scale information of a represented dimension (e.g., distance in 1A) is the set of the formal properties of the dimension, which constitute the abstract space of the dimension. A distributed representation of a dimension means that some of its formal properties are represented in the external representation and some in the internal representation. Figure 1 shows three different forms of distributed representations of dimensions. In Figure 1A, a higher dimension (distance, ratio scale) is represented by a lower dimension (shape of digit, nominal scale). Because shape is on a nominal scale, it can only represent the category property of distance in the external representation. The other three properties of distance (magnitude, equal interval, absolute zero) are represented internally (memorized) because they are not embedded in the physical properties of the shapes of digits. Generally speaking, when a higher dimension is represented by a lower dimension, the extra information of the higher dimension either has to be represented internally (as in Figure 1A) or is not represented at all. In Figure 1B, a lower dimension (airport name, nominal scale) is represented by a higher dimension (length of bar, ratio scale). In this case, all the scale information of the lower dimension is represented externally by the higher dimension because the formal properties of the lower dimension is a subset of those of the higher dimension. However, the extra information in the
4
higher dimension may cause misperception on the lower dimension (see Mackinlay, 1986; Norman, 1993). What we really need to represent in Figure 1B is the category property of airport names, that is, LAX, SFO, and JFK are different airports. Because length is a ratio dimension, the extra information it has (magnitude, equal interval, absolute zero) may cause misperception on the represented dimension (airport names). For example, we may get the misperception that LAX is four times as big as JFK, or other misperceptions. In Figure 1C, the scale type of the represented dimension (distance, ratio scale) matches the scale type of the representing dimension (length of bar, ratio scale). In this case, all the scale information of the represented dimension is represented externally by the representing dimension. This is a direct, efficient, and accurate representation. The Representation of Information in Navigation Displays This section uses a navigation task as an example to show how the principles of distributed dimensional representations can be applied to analyze the representational efficiencies of cockpit information displays. The navigation task, called fixing task, requires the pilot to identify the aircraft's present position with respect to the earth's surface by a latitude and longitude or by some bearings and/or ranges from one or more known, fixed points on the ground. This task can be accomplished by different sets of navigation instruments. The first subsection briefly describes three commonly used navigation systems. The second subsection describes five different methods for the fixing task. The third subsection analyzes the cognitive factors that determine the relative representational efficiencies of the five methods.
Cockpit Information Displays
Representing Dimension Represented Dimension
5
4 2 1 4 nm
2 nm
1 nm
External
Nominal Scale
Represented Dimension
SFO
Internal
External
Magnitude Magnitude Equal Interval Absolute Zero Zero Absolute Oridinal Scale
Category
Representing Dimension
LAX
JFK
4 nm
1 nm
2 nm
External
Internal
Category Magnitude Equal Interval Absolute Zero
Category Magnitude Equal Interval Absolute Zero
Magnitude Equal Interval Absolute Zero
Ratio Scale
Ratio Scale
Oridinal Scale
Category Magnitude Equal Interval Absolute Zero
Internal
Category
Category Magnitude Equal Interval Absolute Zero
Ratio Scale
Nominal Scale
Ratio Scale
Abstract
Abstract
Abstract
(A) Shape→Distance
(B) Length→Name
(C) Length→Distance
Figure 1. The distributed representation of scale information. The scale information of a dimension is in the abstract space, which is decomposed into an internal and an external representation. (A) A nominal dimension (shape) represents a ratio dimension (distance). The extra information of the ratio dimension either has to be represented in the internal representation or not represented at all. (B) A ratio dimension (length) represents a nominal dimension (airport name). The extra information of the ratio dimension may cause misperception on the nominal dimension. (C) A ratio dimension (length) represents a ratio dimension (distance). This is an efficient and accurate representation.
Navigation Systems VOR (very high frequency omnidirectional range), ADF (automatic direction finder), and DME (distance measuring equipment) are commonly used navigation systems for the fixing task. A VOR station transmits radio beams (radials) outward in every direction (Figure 2A). The airborne VOR equipment on an airplane can receive and interpret the radio signals and show the orientation of the airplane relative to the VOR station (Figure 2B). The VOR indicator is usually used to show the course of an airplane, which is the intended horizontal direction of flight measured in degrees from the magnetic north. It can also be used to determine the orientation of the airplane relative to a VOR station. The airplane in Figure 2A is on the 150û
radial. The magnetic course of the airplane is 330û TO the VOR station, as shown in Figure 2B, which is also the magnetic bearing of the VOR station from the airplane. The magnetic course of the airplane can also be displayed as 150û FROM the VOR station, which is also the magnetic bearing of the airplane from the VOR station. The TO/FROM indication may cause reverse sensing. The heading of the airplane is irrelevant to its magnetic course. When the VOR indicator is used to determine the orientation of the airplane relative to a VOR station, the VOR indicator is tuned until the CDI (course deviation indicator) needle centers. If the TO/FROM indicator displays TO, the reading of the VOR indicator is the magnetic bearing of the VOR station from the airplane. If it displays FROM, the reading
Cockpit Information Displays
6
is the magnetic bearing of the airplane from the VOR station. The ADF system can be used to determine the orientation of an airplane relative to a NDB (nondirectional radio beacon) station (Figure 3A). The ADF indicator only displays the relative bearing of a NDB station (Figure 3B). The magnetic bearing of the NDB station has to be computed, which is the sum of the magnetic heading of the airplane and the relative bearing of the NDB station. For example, in Figure 3A, the relative bearing of the NDB station is 80û and the magnetic bearing of the airplane is 340û. The magnetic bearing of the NDB station is 340û + 80û = 420û, which is then converted to 420û - 360û = 60û. In order to use the magnetic bearing of the NDB station to determine the position of the airplane in a sectional chart, we have to determine the reciprocal bearing, which is the magnetic bearing of the airplane from the NDB station. In the example shown in Figure 3, the reciprocal bearing is 60û + 180û = 240û. DME is another system that can be used to determine an airplaneÕs position.
A DME indicator displays a distance reading in nautical miles from a VOR/DME or VORTAC station. Many DME indicators also display time-tostation, which is the time it will take you to reach the station at the computed ground speed. Figure 4 shows a typical DME indicator. Methods for the Position Fixing Task Figure 5 shows the situation of an airplane flying in an area surrounded by four stations, each of which provides all three types of navigation facilities (VOR, ADF, and DME). The fixing task is to use the information provided by the α and β stations to determine the horizontal position of the airplane. There are many methods for the fixing task . Different methods require different instruments and procedures. Four of the commonly used methods are VOR, ADF, RMI, and Map methods. Others include the VOR/DME and DME/DME methods, which will not be analyzed here.
Magnetic North
30
N
W
0˚
33
3
21
24
(A) VOR Station
•• • • S
• ••••
• E
Heading: 340˚ Course: 330 ˚ (TO) or Heading: 340˚ Course: 150 ˚ (FROM)
TO
6
180˚
90˚
15
VOR
12
270˚
(B) VOR Indicator
Figure 2. The VOR system. (A) VOR station. The heading is irrelevant to the course. (B) VOR indicator. It shows that the course of the airplane is 330û to the VOR station.
Cockpit Information Displays
Magnetic North
N 3
33
24
12
NDB
E
W
6
30
Magnetic Bearing (60˚) Relative Bearing (80˚)
15
Magnetic Heading (340˚)
7
21 S (A) NDB Station
(B) ADF Indicator
Figure 3. The ADF system. (A) ADF station. (B) ADF indicator. The reading (80û) is the relative bearing of the NDB station.
120.5 NM 100 KT 72 MIN Figure 4. DME Indicator.
α
γ
β
δ Figure 5. The situation of an airplane flying in an area surrounded by four navigation stations.
Cockpit Information Displays
The VOR method requires two VOR indicators, one heading indicator, and two DME indicators. In Figure 6A, the left VOR indicator is tuned to the α station, and the right to the β station. They show the magnetic courses of the airplane relative to the two stations (330û TO α and 240û FROM β). The heading indicator shows the current heading of the airplane. And the left and right DME indicators show the distances from the airplane to the α and β stations. The readings from the five instruments in Figure 6A provide no perceptual information about where the airplane is located. Without the use of a navigation map (sectional chart), the identification of the airplaneÕs position requires extensive mental processing. First, the magnetic bearings of α and β stations have to be determined. The magnetic bearing of the α station is equal to the magnetic course of the airplane relative to the α station, which is 330û. The magnetic bearing of the β station is the reciprocal of the magnetic course of the airplane relative to the β station, which is 60û (240û + 180û - 360û). Second, the relative bearings of the α and β stations have to be determined. The relative bearing of the α station is 330û - 340û (heading) = -10û. The relative bearing of the β station is 60û - 340û = -280û, or 80û (280û + 360û). Combining the readings from the two DME indicators, we can then determine the position of the airplane: the airplane is heading toward 340û, the α station is 10û to the left of and 120.5 NM from the airplane, and the β station is 80û to the right of and 175.5 NM from the airplane. The ADF method requires two ADF indicators, one heading indicator, and two DME indicators (Figure 6B). Because the
8
readings on the two ADF indicators are the relative bearings of the two stations from the airplane (-10û for α and 80û for β), they provide direct perceptual information about the orientations of the two stations relative to the airplane: the α station is 10û to the left of the airplane, and the β station 80û to the right of the airplane. However, the relations between the heading of the airplane and the magnetic bearings of the two stations have to be computed. The magnetic bearing of the α station is 330û (340û - 10û), and the magnetic bearing of the β station is 60û (340û + 80û - 360û). The RMI (radio magnetic indicator) method requires one RMI and two DME indicators. The RMI indicator is in fact the combination of one heading and two ADF (or VOR) indicators (Figure 6C). The small arrow at the top of the RMI indicator is the heading of the airplane (340û), and the narrow and wide hands are the left and right ADF indicators (in this case, to the α and β stations). In this method, except that the distances are indicated by numeric symbols, all orientation information is shown perceptually. Not only the heading, the magnetic bearings of the two stations and their reciprocal bearings, and the relative bearings of the two stations, but also the relations between all these orientations are directly perceivable from the RMI indicator. One minor problem with this method is that the mapping between the two ADF indicators and the two DME indicators is arbitrary: the narrow hand is mapped to the left DME, and the wide hand to the right DME. The map method (Figure 6D, used in the Boeing 747-400) shows directional information on a map-like display that combines one heading indicator, two ADF indicators, two DME indicators, and the
Cockpit Information Displays
9
navigation map. This is an Electronic Flight Instrument Display (EFIS) that replicates the older, analog instrument's format on a Cathode Ray Tube (CRT) display but allows computer generation of the added symbology (e.g., locations of the VORs). From the display, we can directly perceive that the heading of the airplane is 340û, the magnetic bearings of the α and β stations to the airplane are 330û and 60û, the distances from the α and β stations to the airplane are 120.5 NM and 175.5 NM, and so on. The interval information of
30
W 24
30
W
W
24
15
6
12
24
3
21
12
E
21
12
S Right ADF Indicator
33
N
30
15
3
120.5 NM 100 KT 72MIN
E
12
S Left ADF Indicator
N
30
6
E
Right VOR Indicator
3
33
6
• •• • •• •
N
Left VOR Indicator
33
•••
33
S
•
E
• •• ••
6
•• ••
FROM
N
3
33
30
S
3 TO
N
W
15
24
21
21
N
15
33
30
orientations (magnetic north, bearings, and heading) and the ratio information of VOR distances are represented externally. However, this display makes the perception of reciprocal bearings harder. A modification of the map method is shown in Figure 6E. This modified map display makes the perception of reciprocal bearings easier. In addition, the mapping problem of DME and VOR indicators is completely solved by placing the DME readings between the stations and the airplane.
120.5 NM 100 KT 72 MIN
W
W
3
6
Left DME Indicator
24
24
6
Left DME Indicator
21
21
E
E 12
12
175.5 NM 100 KT 105 MIN
S
15
Right DME Indicator
Heading Indicator
15
175.5 NM 100 KT 105 MIN Right DME Indicator
Heading Indicator
(A) VOR Method
(B) ADF Method 340
30
W
W
060
24
175.5NM
12 15
DME 120.5
(C) RMI Method
21
21
21
α
15
VOR L
12
S Right DME Indicator
E
δ
δ
S VOR R
β
β
6
M
24
330
175.5 NM 100 KT 105 MIN Right ADF Hand
RMI Indicator
γ
E
E
S
α 120.5N
β
6
060
N
3
α
γ
24
30 330
6
Left DME Indicator
N
3
3
120.5 NM 100 KT 72 MIN
W
N
30
340
33
15
33
33
Left ADF Hand
12
S
DME 175.5
(D) Map Method
(E) Modified Map Method
Figure 6. The five methods for the position fixing task. They all provide the same navigation information about the airplaneÕs horizontal position: the airplane is heading toward 340û, the α station is 10û to the left of and 120.5 NM from the airplane, and the β station is 80û to the right of and 175.5 NM from the airplane. See text for detailed descriptions of these five methods.
Cockpit Information Displays
Cognitive Factors of Representational Efficiencies The information about an airplane's horizontal position includes the bearings of the airplane to and from the stations, the heading of the airplane, the magnetic north, the relations between these orientations, and the distances from the airplane to the stations. Orientations are on an interval scale, and distances are on a ratio scale. The interval and ratio information can be represented either externally or internally, which is the major factor of representational efficiencies of navigation displays for the fixing task. We assume that the more information is represented externally, the more efficient is the display. This is because external information is processed by more efficient perceptual mechanisms, which require little or no resources of working memory because they are usually direct, automatic, unconscious, and parallel. In contrast, internal information is processed by less efficient cognitive mechanisms, which require more working memory resources because they are usually indirect, controlled, conscious, and sequential. Because working memory resources are limited, the cognitive processes can easily overload working memory and thus make the task more difficult and error prone. Representation of interval information. Table 2 shows the representation of the interval and ratio information for the five methods. In the VOR method (Figure 6A), the interval relation (the angular difference) between the heading and the north is represented externally in the heading indicator because it is perceptually available. The interval relation between the two bearings on the two VOR indicators is represented internally because the angular difference between the
10
two bearings is not perceptually available: it has to be computed internally in the mind. Likewise, the interval relations between the heading and each bearing and between the north and each bearing are also represented internally because they have to be computed internally. In the ADF method (Figure 6B), the interval relation between the heading and the north is represented externally in the heading indicator, that between the heading and each bearing is represented externally in each ADF indicator, and that between the two bearings is represented externally in the two ADF indicators, because they are all perceptually available. However, the interval relations between the north and each bearing are represented internally because they have to be computed internally in the mind. In the RMI method (Figure 6C), the interval relation between the heading and north is represented externally in the heading indicator, and those between the heading and each bearing, between the two bearings, and between the north and each bearing are represented externally in the RMI indicator, because they are all perceptually available.. In the Map and Modified Map methods (Figure 6D and 6E), all of the interval relations are represented externally in the single map display because they are all perceptually available. Representation of ratio information. Distances are on a ratio scale. Only in the Map and Modified Map methods is the ratio information of the distances between the airplane and the stations represented externally by the distances on the map (see Figure 1C for an explanation). In all other methods, the distances are represented by numeric values, which have to be interpreted internally in the mind.
Cockpit Information Displays
11
Table 2. The Representation of the Interval Information of Orientations and the Ratio Information of Distances Methods
Interval Information
Ratio Information
heading-north
heading-bearings
VOR
external
internal
internal
internal
internal
ADF
external
external
external
internal
internal
RMI
external
external
external
external
internal
Map
external
external
external
external
external
Mod. Map
external
external
external
external
external
Reading of numerical values. Another factor of representational efficiency is whether the absolute numeric values of the magnetic bearings, reciprocal bearings, relative bearings, headings, and distances can be read directly from the indicators (Table 3). In the VOR method (Figure 6A), only the heading (340û) and the two distances (120.5 NM and 175.5 NM) can be directly read from the heading indicator and the two DME indicators. The magnetic bearings and reciprocal bearings cannot be directly read from the VOR indicators, because whether the readings indicate the magnetic bearings or the reciprocal bearings depends on the interpretation of the TO/FROM indicator: TO indicates magnetic bearing (330û magnetic bearing and 330û-180û=150û reciprocal bearing for α station) and FROM indicates reciprocal bearing (240û reciprocal bearing and 240û180û=60û magnetic bearing for β station). The relative bearings cannot be read directly because they have to be computed internally in the mind: 330û - 340û = -10û for α station and 60û -340û = -280û or -280û + 360û = 80û for β station. In the ADF method, the heading (340û), relative bearings (-10û and 80û), and distances (120.5 NM and 175.5 NM) can be directly read from the heading indicator, the ADF indicators, and the DME indicators, respectively. However, the
bearing-bearing north-bearings
distance
magnetic bearings and the reciprocal bearings cannot be read directly because they have to be computed. The magnetic bearings are 340û-10û=330û for α station and 340û+80û-360û =60û for β station. The reciprocal bearings are 330û-180û=150û for α station and 60û+180û =240û for β station. In the RMI method, the heading (340û), magnetic bearings (330û and 60û), and reciprocal bearings (150û and 240û) can be directly read from the indicator. However, relative bearings have to be computed: 330û - 340û = -10û for α station and 60û -340û = -280û or -280û + 360û = 80û for β station. In addition, the distances from the left and right DME indicators cannot be directly mapped to the two stations because the relation between the two hands of the RMI indicator and the two DME indicators is arbitrary: narrow hand corresponds to left DME and wide hand corresponds to right DME. In the Map method, relative bearings have to be computed. In addition, reading an reciprocal bearing is not easy because the lines connecting the airplane and the two stations point to magnetic bearings, not relative bearings. All other readings can be read directly. In the Modified Map method, except of relative bearings which have to be computed, all other readings can be directly read from the display.
Cockpit Information Displays
12
Table 3. Directness of Reading Absolute Numeric Values Methods
Heading
Magnetic Bearings Reciprocal Bearings Relative Bearings
VOR
Direct
Indirect
Indirect
Indirect
Direct
ADF
Direct
Indirect
Indirect
Direct
Direct
RMI
Direct
Direct
Direct
Indirect
Indirect
Map
Direct
Direct
Indirect
Indirect
Direct
Mod. Map
Direct
Direct
Direct
Indirect
Direct
Orders of representational efficiencies. The more information is represented externally, the more efficient is the display, because the perceptual mechanisms for the processing of external information are more efficient than the cognitive mechanisms for the processing of internal information. This is because the amount of cognitive processing that can take place in working memory is limited by the limited capacity of working memory. If we use the amount of information represented in external representations as a measure of representational efficiency (see Table 2), we can get a representational efficiency order, from most efficient to least efficient: Modified Map = Map > RMI > ADF > VOR. The more direct is the reading of numerical values, the more efficient is the display, because a more direct reading requires less mental computation. If we use the directness of the reading of numerical values as a measure of representational efficiency (see Table 3), we can get a representational efficiency order, from most efficient to least efficient: Modified Map > Map = RMI = ADF > VOR. Combining the above two factors, we can get the following representational efficiency order: Modified Map > Map > RMI > ADF > VOR. General Discussion Summary This article is a theoretical analysis of the representational properties of cockpit in-
Distances
formation displays. This analysis is based on Zhang & Norman's (1994) theoretical principle of distributed representations: the information needed for many tasks in a cockpit is distributed across the external information displays in the cockpit and the internal minds of the pilots. The relative amount of information in external representations versus that in internal representations is the major factor of a displayÕs representational efficiency. The more information is represented externally, the more efficient is the display. This is because external information is processed by more efficient perceptual mechanisms, which require little or no resources of working memory because they are usually direct, automatic, unconscious, and parallel. In contrast, internal information is processed by less efficient cognitive mechanisms, which require more working memory resources because they are usually indirect, controlled, conscious, and sequential. Five functionally equivalent but representationally different navigation systems are analyzed in terms of the distribution of information needed to perform the fixing task across internal and external representations. From this analysis, an order of representational efficiency was obtained for the five systems. The result for the navigation systems is merely a demonstration of the potential values of the principle of distributed representations for the studies of cockpit information displays. The principle of distributed
Cockpit Information Displays
representations also has implications for more general issues such as situation awareness and direct interaction interfaces. Applications to Situation Awareness and Direct Interaction Situation awareness or situation assessment is an important concept for aviation and other information intensive tasks (e.g., Andre & Wickens, 1991; Doughty, 1986; Endsley, 1988; Fracker, 1988; for a comprehensive review, see Vidulich, Dominguez, Vogel, & McMillan, 1994). For aviation, it usually refers to the total information that the pilot has about the current states of the aircraft and the environment. In a complex dynamic environment, the pilot needs to update his awareness of the situation in real time in order to succeed in a mission. Navigation awareness, in particular, refers to a pilotÕs knowledge of the aircraftÕs spatial orientation and position under a specific time framework (Endsley, 1988). For example, the pilot needs to know the aircraftÕs horizontal position relative to specific navigation stations or waypoints, the vertical position (altitude), air speed and vertical speed, heading, time to destination, etc. These types of information should be directly available to the pilot in real time with minimal involvement of cognitive resources. This type of complete situation awareness in real time is only possible with direct interaction interfaces. The term direct manipulation was coined by Shneiderman (1974, 1982, 1983; for a review, see Ziegler & Faehnrich, 1988) to refer to interfaces that (a) have continuous representations, (b) support physical actions instead of complex syntax, and (c) provide rapid incremental reversible operations with immediate feedback. Hutchins, Hollan, & Norman (1986), applying Norman's (1986) theory
13
of action, formulated a comprehensive cognitive account for direct manipulation. According to Norman (1986), any action has a cycle of seven stages of activities: establishing the goal at the start of the action; forming the intention, specifying the action specification, and executing the action on the action side of the cycle; and perceiving the system state, interpreting the state, and evaluating the system state with respect to the goal on the evaluation side of the cycle. Across the seven stages of an action cycle, there is a gulf of executionÑthe gap between intention and action; and there is a gulf of evaluationÑ the gap between perception and evaluation. According to Hutchins, Hollan, & Norman (1986), direct interaction means a directness of action, including a directness of the translation of intentions to actions and a directness of the translation of the outcome to interpretation. The goal of direct interaction is to minimize the gulfs of execution and evaluation by minimizing the required cognitive resources. With direct interaction, people are able to spend their full cognitive resources on the task, not the interface. As a result, the interface is invisible but the task is transparent to users. The gulfs of execution and evaluation can be bridged in two directions: from the system side by the system interface and from the user side by internal representations. The bridges from the userÕs side are aided by appropriate internal representations developed through extensive training and long-term learning. The bridges from the systemÕs side are realized by appropriate interfaces. The more of the gulf spanned by the interface, the less distance need be bridged by the cognitive efforts of the user. Thus, only the bridges spanned by the interface give rise to direct interaction because the feel-
Cockpit Information Displays
ing of directness results from the commitment of fewer cognitive processes. According to the theory of distributed representations, any distributed cognitive task has an abstract task structure, which can be distributed across internal and external representations in many different ways, producing many different isomorphs that have different representational efficiencies and behavioral outcomes. To get a complete direct interaction interface is to completely bridge the gulf of execution and the gulf of evaluation. To completely bridge the two gulfs is to find an isomorphic interface whose abstract task structure is completely represented in external representations. As a result, the interface will be direct and transparent. For real world complex tasks, however, the complete representation of a task's abstract structure in external representations is rarely possible. Thus, we should look for interfaces that maximize external representations. Zhang & Norman (1994; Zhang, 1996) developed a preliminary methodology of representational analysis, which can be used as a means of systematically generating and examining isomorphic representational systems. Conclusion In conclusion, the principle of distributed representations, which was originally developed as a theory for distributed cognitive tasks (Zhang & Norman, 1994), has valuable applications in the design of efficient cockpit information displays (the current article), in addition to relational information displays (Zhang, 1996) and numeration systems (Zhang & Norman, 1995). It also has potential implications for the studies of the general issues of situation awareness and direct interaction.
14
References Andre, A. D. & Wickens, C. D. (1991). Display formatting techniques for improving situation awareness in the aircraft cockpit. The International Journal of Aviation Psychology, 1 (3), 205-218. Doughty, L. (1986). Situation awareness. Meeting of the Eastern Region Helicopter Council. Endsley, M. R. (1988). Design and evaluation for situation awareness enhancement. Proceedings of the 32nd Annual Meeting of the Human Factors Society (pp. 97-101). Santa Monica, CA. Human Factors Society. Fracker, M. L. (1988). A theory of situation assessment: Implications for measuring situation awareness. Proceedings of the 32nd Annual Meeting of the Human Factors Society (pp. 102-106). Santa Monica, CA. Human Factors Society. Garner, W. R. (1974). The processing of information and structure. Potomac, Md.: Lawrence Erlbaum Associates. Hutchins, E. (1995). How a cockpit remembers its speed. Cognitive Science, 19, 265-288. Hutchins, E., Hollan, J. and Norman, D. A. (1986). Direct manipulation interfaces. In D. A. Norman & S. Draper (Ed.), User centered system design: New perspectives in human-computer interaction. Hillsdale, NJ: Lawrence Erlbaum Associates. Mackinlay, J. D. (1986). Automating the design of graphical presentations of relational information. ACM Transactions on Graphics, 5 (2), 110-141. Norman, D. A. (1986). Cognitive engineering. In D. A. Norman & S. W. Draper (Ed.), User centered system design. Hillsdale, NJ: Lawrence Erlbaum Associates. Norman, D. A. (1991). Cognitive science in the cockpit. CSERIAC Gateway, 11
Cockpit Information Displays
(2), 1-6. Norman, D. A. (1993). Things that make us smart. Reading, MA: AddisonWesley. Shneiderman, B. (1974). A computer graphics system for polynomials. The Mathematics Teacher, 11-113. Shneiderman, B. (1982). The future of interactive systems and the emergence of direct manipulation. Behavior and Information Technology, 1, 237-256. Shneiderman, B. (1983). Direct manipulation: A step beyond programming languages. IEEE Computer, 16 (8), 5769. Stevens, S. S. (1946). On the theory of scales of measurement. Science, 103 (2684), 677-680. Vidulich, Dominguez, Vogel, & McMillan (1994). An annotated bibliography of situation awareness. Technical Report, Armstrong Laboratory. WrightPatterson Air Force Base, OH. Zhang, J. & Norman, D. A. (1994). Representations in distributed cognitive tasks. Cognitive Science, 18, 87-122. Zhang, J., & Norman, D. A. (1995). A representational analysis of numeration systems. Cognition 57, 271-295. Zhang, J. (1996). A representational analysis of relational information displays. International Journal of HumanComputer Studies, 45, 59-74. Ziegler, J. E., & Faehnrich, K. P. (1988). Direct manipulation. In Helander, M. (Ed.), Handbook of Human-Computer Interaction. Amsterdam: Elsevier.
15