J Neurophysiol 106: 2437–2449, 2011. First published August 17, 2011; doi:10.1152/jn.01106.2010.
Distributed representation of social odors indicates parallel processing in the antennal lobe of ants Andreas Simon Brandstaetter1,2 and Christoph Johannes Kleineidam2 1
Department of Behavioral Physiology and Sociobiology (Zoology II), Biozentrum, University of Würzburg, Würzburg; and 2Department of Biology, University of Konstanz, Konstanz, Germany Submitted 20 December 2010; accepted in final form 16 August 2011
Brandstaetter AS, Kleineidam CJ. Distributed representation of social odors indicates parallel processing in the antennal lobe of ants. J Neurophysiol 106: 2437–2449, 2011. First published August 17, 2011; doi:10.1152/jn.01106.2010.—In colonies of eusocial Hymenoptera cooperation is organized through social odors, and particularly ants rely on a sophisticated odor communication system. Neuronal information about odors is represented in spatial activity patterns in the primary olfactory neuropile of the insect brain, the antennal lobe (AL), which is analog to the vertebrate olfactory bulb. The olfactory system is characterized by neuroanatomical compartmentalization, yet the functional significance of this organization is unclear. Using two-photon calcium imaging, we investigated the neuronal representation of multicomponent colony odors, which the ants assess to discriminate friends (nestmates) from foes (nonnestmates). In the carpenter ant Camponotus floridanus, colony odors elicited spatial activity patterns distributed across different AL compartments. Activity patterns in response to nestmate and nonnestmate colony odors were overlapping. This was expected since both consist of the same components at differing ratios. Colony odors change over time and the nervous system has to constantly adjust for this (template reformation). Measured activity patterns were variable, and variability was higher in response to repeated nestmate than to repeated nonnestmate colony odor stimulation. Variable activity patterns may indicate neuronal plasticity within the olfactory system, which is necessary for template reformation. Our results indicate that information about colony odors is processed in parallel in different neuroanatomical compartments, using the computational power of the whole AL network. Parallel processing might be advantageous, allowing reliable discrimination of highly complex social odors. dual olfactory pathway; nestmate recognition; cuticular hydrocarbons; two-photon calcium imaging; Camponotus floridanus SOCIAL INSECTS LIVE IN COMPLEX societies, where cooperation ultimately results in a fitness benefit for colony members (Hölldobler and Wilson 2009). In colonies of eusocial Hymenoptera, like ants or honeybees, cooperation is organized through social odors, and particularly ants rely on a sophisticated odor (pheromone) communication system (Hölldobler and Wilson 1990). Pheromones are used to facilitate recruitment, to mark trails to profitable food sources, and to signal alarm when the colony is under attack (Hölldobler 1995). Furthermore, low-volatile substances on the cuticle [cuticular hydrocarbons (CHC)] serve as intra- and interspecific recognition cues: CHCs are used to assess fertility status and inform about caste and colony membership (Greene and Gordon 2003;
Address for reprint requests and other correspondence: A. S. Brandstaetter, CNRS (UPR 9034), Laboratoire Evolution, Génome et Spéciation (LEGS), Ave. de la Terrasse, Bât 13, BP 1, 91198 Gif-sur-Yvette, France (e-mail:
[email protected]). www.jn.org
Lahav et al. 1999; Moore and Liebig 2010; Smith et al. 2009; van Zweden et al. 2009; Wagner et al. 1998). The chemical and behavioral basis of colony recognition has been described in great detail for ants (D’Ettorre and Lenoir 2010; van Zweden and D’Ettorre 2010). For a given species, CHC profiles consist of the same multiple components, yet different ratios of the components provide colony specificity. Ants use these colony-specific CHC profiles (colony odor) to discriminate between colony members (nestmates) and foreign workers (nonnestmates) (Akino et al. 2004; Lahav et al. 1999; Singer 1998; Wagner et al. 2000). Despite their very low volatility, colony odors can be detected and discriminated via olfactory sensilla over short distances (Brandstaetter et al. 2008). According to the common notion, a detected colony odor (label) is compared with a neuronal template that is located in a so far unidentified region of the nervous system (labeltemplate matching). A mismatch between label and template will result in aggression (Vander Meer and Morel 1998), and the aggressive response is context and experience dependent (Bos et al. 2010; Knaden and Wehner 2003). Colony odors are not stable but change over time in the course of weeks, and months as they are influenced by environmental factors and vary with age, reproductive status, and/or caste membership of the bearer (Heinze et al. 2002; Morel et al. 1988; Nielsen et al. 1999; Wagner et al. 1998). Consequently, the neuronal template needs to be continuously updated, a learning process called template reformation (Lahav et al. 2001; Provost et al. 1993; Vander Meer et al. 1989; Wallis 1963). Associative learning in an appetitive context (foraging) is well described in ants (Dupuy et al. 2006; Josens et al. 2009; Kleineidam et al. 2007b; Roces 1990, 1994). Yet, in contrast to appetitive or aversive learning, template reformation is a relatively slow process, requiring several hours if induced artificially. During this process, social interaction, which might act as a positive or negative reinforcer, is not required (Guerrieri et al. 2009; Leonhardt et al. 2007; Stroeymeyt et al. 2010). Alternatively, a sensory filter in the periphery of the nervous system has been suggested to act as a template (Ozaki et al. 2005). Ozaki et al. described a sensillum (Sensilla basiconica) on the antennae of Camponotus japonicus, which is CHC sensitive. The authors reported S. basiconica to be selectively activated by nonnestmate colony odor only. According to their hypothesis, sensory adaptation causes specific anosmia to nestmate colony odor and only information about nonnestmates is relayed to the brain. It remains elusive how colony odors are processed by the nervous system and the mechanism by which
0022-3077/11 Copyright © 2011 the American Physiological Society
2437
2438
PARALLEL PROCESSING OF SOCIAL ODORS IN ANTS
the olfactory system allows reliable recognition of nestmates and nonnestmates is unknown. The insect olfactory system is well investigated (Hansson 1999). Odors are received at olfactory receptor neurons (ORN) housed in olfactory sensilla on the antenna. ORNs project to the first olfactory neuropile of the insect brain, the antennal lobe (AL). The insect AL is the analog to the vertebrate olfactory bulb, and similar odor processing mechanisms seem to act in both (Dupuy et al. 2010; Hildebrand and Shepherd 1997). Axons of ORNs of similar type terminate in single glomeruli, which constitute the functional units of the AL. (Vosshall et al. 2000; Wang et al. 2003). Odor-induced activation of ORNs results in odor-specific patterns of glomerular activity in the AL (spatial activity pattern), and activation and inhibition across glomeruli has been shown to be important for odor coding (combinatorial or assembly code) (Galizia and Szyszka 2008). Glomeruli are densely interconnected via local interneurons, and olfactory information is processed within the AL network (Deisig et al. 2010; Sachse and Galizia 2002). Processed odor information is further relayed to higher integration centers of the insect brain (mushroom bodies and lateral protocerebrum) by AL output neurons [projection neurons (PN)]. The olfactory system is characterized by neuroanatomical compartmentalization, particularly prominent in Hymenoptera, and neuronal compartments may have an important functional role for odor processing (Kleineidam and Rössler 2009). The first compartments are the olfactory sensilla (S. trichodea curvata and S. basiconica) with multiple ORNs (Dumpert 1972; Kelber et al. 2010; Nishino et al. 2009; Ozaki et al. 2005). The high number of ORNs within each sensillum and the many corresponding functional units within the AL suggest that both sensilla types are sensitive to a wide range of different odors (Kelber et al. 2006; Nakanishi et al. 2009). Different ORN types are segregated almost exclusively into either S. trichodea curvata or S. basiconica, but each of these two sensilla types has variable combinations of ORN types (Kelber et al. 2010). Interaction between ORNs within olfactory sensilla has been reported on in honeybees (Akers and Getz 1992, 1993; Getz and Akers 1993, 1994). Second, the antennal nerves split into several sensory tracts before entering the AL, and in carpenter ants, each of the seven sensory tracts (T1-T7) innervates a distinct subregion (glomerular cluster) of the AL (Nakanishi et al. 2010; Zube et al. 2008). As common for ants, Camponotus species contain a large number of glomeruli in the AL (⬎340; Mysore et al. 2009, 2010; Nakanishi et al. 2010; Zube et al. 2008). Different clusters in the AL have been suggested to act as processing centers, e.g., for alarm pheromones or CHC profiles (Nakanishi et al. 2010; Ozaki et al. 2005; Yamagata et al. 2006). However, several studies in honeybees and ants indicate that social odors (e.g., alarm pheromone) are represented as distributed activity patterns at the level of the AL (Brandstaetter et al. 2010; Galizia et al. 1999a, 1999b; Joerges et al. 1997; Sandoz et al. 2007; Wang et al. 2008; Zube et al. 2008). Third, the Hymenopteran AL is separated by its output tracts into two hemilobes. PNs project to higher integration centers either via a lateral or a medial antenno-protocerebral tract (land m-APT, respectively), and this organization results in a dual olfactory pathway (Abel et al. 2001; Kirschner et al. 2006; Mobbs 1982; Zube et al. 2008). Parallel processing of odor J Neurophysiol • VOL
information has been suggested in the dual pathway (Krofczik et al. 2009; Müller et al. 2002; Yamagata et al. 2009). Exclusive representation of odors in single compartments suggests a functional segregation of odor information. In contrast, distributed representation across multiple compartments indicates parallel processing of odor information, taking advantage of the computational power of the whole AL network. Depending on the requirements on discrimination or detection of an odor, one or the other processing mechanism might be advantageous. In this study, we investigated whether colony odor is represented exclusively in single, specialized AL compartments or whether it is distributed across compartments. While the former would correspond to specific AL compartments as processing centers devoted to colony recognition, the latter would indicate parallel processing of the multicomponent colony odors in the AL. Calcium imaging with advanced two-photon microscopy allowed us to monitor neuronal activity in response to colony odors in different AL compartments of the carpenter ant Camponotus floridanus. We analyzed the spatial activity patterns elicited by nestmate and nonnestmate colony odor to further our understanding on how ants discriminate friends from foes. MATERIALS AND METHODS
Ethics statement. The performed experiments and protocols comply with the Guide for the Care and Use of Laboratory Animals of the National Institutes of Health published by National Academic Press (1996) and the current laws of the Federal Republic of Germany (“Tierschutzgesetz”). Collection of founding queens for laboratory colonies conformed to the laws of the United States of America effective at time of collection. Animals. C. floridanus is an evolutionary-derived eusocial species with colonies consisting of ⬎10,000 individuals but only one singlemated queen (Gadau et al. 1996). Genetic homogeneity within colonies is high, and heritable components of the colony odor are probably important for colony recognition in this species (Carlin and Hölldobler 1986, 1987). Workers show distinct colony recognition behavior, which has been studied in great detail (Carlin and Hölldobler 1983, 1986, 1987; Carlin et al. 1987). Experimental colonies were raised from founding queens collected by A. Endler and C. Strehl at Florida Keys after mating flight. Colonies were kept in the laboratory in artificial plaster nests at a constant temperature of 25°C and 50% humidity (12:12-h photoperiod) and provided with artificial diet (Bhatkar and Whitcomb 1970), honey water, and dead cockroaches (Nauphoeta cinerea) twice a week and water ad libitum. Colony size was ⬃4,000 ants. Neurophysiological experiments were conducted with large workers (head width ⬎ 3 mm) from a colony, with a founding queen collected at Sugarloaf Shores in July 2002 and nestmate colony odor was obtained from small workers (head width ⬍ 3 mm) of the same colony. Nonnestmate colony odors were obtained from small workers, whose founding queens had been collected at Orchid Island in September 2001. Colony odors. The chemical basis of colony recognition and the composition of colony odors have been extensively investigated and reviewed repeatedly (D’Ettorre and Lenoir 2010; Howard and Blomquist 2005). Long-chained hydrocarbons on the cuticle (CHCs) are the main discriminators for colony recognition and are therefore referred to as colony odor (Akino et al. 2004; Lahav et al. 1999; Singer 1998; Wagner et al. 2000). Dimethyl-alkanes seem to be specifically important for colony recognition, but to date it is not known whether some key components of the CHC profile are used for discrimination (Guerrieri et al. 2009; Martin and Drijfhout 2009). The colony odor of C. floridanus is well characterized and is mainly
106 • NOVEMBER 2011 •
www.jn.org
PARALLEL PROCESSING OF SOCIAL ODORS IN ANTS
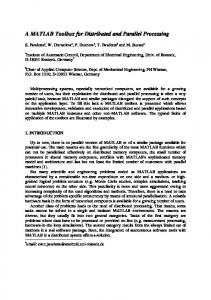
composed of linear and methyl-branched alkanes of chain lengths between C29 and C32 (Endler et al. 2004, 2006). Nestmate and nonnestmate colony odors consist of the same components, but their ratios differ (Fig. 1). Colony odors were obtained from postpharyngeal glands (PPG), which contain the same components as the colony odor found on the cuticle in equivalent ratios (Akino et al. 2004; Bagneres and Morgan 1991; Soroker et al. 1994). To obtain nestmate and nonnestmate colony odor, a small worker was immobilized on ice, the gaster removed, and the thorax pinned upside down onto a silicone elastomer (Sylgard 182; Dow Corning) in a Petri dish. The head was covered with distilled water, the maxillo-labial apparatus was removed, and the PPGs were taken out by pulling out the pharynx. To compensate for differences in content quantity between glands, three PPGs were collected in 500 l of distilled hexane and the glandular content was extracted for ⱖ2 h. Before experiments, hexane was evaporated under a constant stream of pure N2 (Sauerstoffwerk Friedrichshafen) to a volume of ⬃75 l. As colony odors change over time in the range of weeks and months (Nielsen et al. 1999; Provost et al. 1993; Vander Meer et al. 1989), we used only PPG extracts that had been prepared no more than 5 days in advance. A previous study (Brandstaetter et al. 2008) showed that PPG extracts contain remarkably less short-chain components, which do not belong to the hydrocarbons constituting the colony odor, than hexane cuticle washes. In contrast, long-chained hydrocarbons, which are used for colony recognition, have been found in similar ratios in both PPG extracts and hexane cuticle washes, and PPG extracts of nestmates and nonnestmates are readily discriminated by ants (Brandstaetter et al. 2008, 2011). Gas chromatography. One microliter of each extract was directly injected into a gas chromatograph (Trace GC Ultra coupled to a DSQ II mass spectrometer; Thermo Scientific) with a split/splitless injector using a Hamilton syringe (Hamilton). The components were separated on a nonpolar capillary column (BPX5; 60 m ⫻ 0.25 mm, 1-m film thickness; SGE Europe) with helium as carrier gas (column flow of 1.5 ml/min). Gas chromatograms were recorded with Xcalibur software 1.4 SR1 (Thermo Scientific) using following temperature program: 1) constant temperature of 40°C for 1 min, 2) increasing temperature at 10°C/min to 350°C, and 3) constant temperature of 350°C for 20 min.
Fig. 1. Examples of chromatograms of nestmate and nonnestmate colony odors. Hydrocarbon profiles of nestmates (A) and nonnestmates (B) contain the same components but at different ratios. Hydrocarbon extracts were obtained from postpharyngeal glands, which contain the same hydrocarbons in similar ratios as found on the cuticle, and such extracts were loaded onto dummies used for colony odor stimulation. J Neurophysiol • VOL
2439
Stimulus delivery. For stimulation with colony odors, we used a recently developed stimulus delivery technique that simulates a nearby nestmate or nonnestmate. We used a colony odor-loaded metal rod (dummy) and moved its tip into close vicinity of the antenna. Dummy-delivered simulation has been shown to be advantageous for stimulation with low-volatile odors (Brandstaetter et al. 2010) and has been successfully used for presentation of colony odor in both behavioral and neurophysiological experiments (Brandstaetter et al. 2008, 2011). To increase colony odor concentration in headspace, we used heatable dummies set to a temperature of 40°C before loading them with colony odor [Firerod Cartridge Heater (power rating: 23 W, diameter: 3 mm) operated by a F4SL controller; Watlow]. In a recent study, this moderate increase in temperature has been shown not to interfere with colony recognition: ants readily discriminated heated dummies loaded with colony odors of nestmates or nonnestmates (Brandstaetter et al. 2011). A custom-built positioning system with a computer-controlled servo-motor allowed for exactly timed and precise positioning of the dummy (distance to antenna 2–3 mm). Before stimulation, hexane-rinsed dummies were loaded with 25 l of colony odor using hexane-rinsed Hamilton syringes (Hamilton), and the solvent was allowed to evaporate for 2 min. Room temperature was kept constant at 21°C. The loading of a dummy with colony odor corresponded to 1 PPG equivalent, and this has been shown to elicit adequate behavioral responses, showing that colony odor concentration in headspace at the antenna is well within a physiologically relevant range (Brandstaetter et al. 2008, 2011). Calcium imaging. Neuronal activity was monitored via calcium imaging by measuring changes in intracellular calcium levels using fluorescent calcium indicators. This technique has been repeatedly used in ants (Brandstaetter et al. 2010, 2011; Dupuy et al. 2010; Galizia et al. 1999a; Kuebler et al. 2010; Zube et al. 2008) and was recently combined with two-photon microscopy to measure neuronal activity in response to thermal stimuli in leaf-cutting ants (Ruchty et al. 2010). Large workers were immobilized by briefly cooling them on ice for a few minutes, and then they were tethered in a custom-made Plexiglas stage using soft dental wax (surgident periphery wax; Heraeus Kulzer). A small window was cut in the head capsule with a piece of razorblade attached to a blade holder (Fine Science Tools) to access the brain and the site of dye application. Tracheae and glands were carefully moved aside with Dumont tweezers, and a sharp glass electrode was used to penetrate the tissue of the lateral protocerebrum, dorsolaterally to the vertical lobe of the right mushroom body. Subsequently, another sharp glass electrode coated with fura-2 dextrane (potassium salt, 10,000 MW, F3029; Molecular Probes) dissolved in 2% BSA solution was inserted at the same region, aiming for the projection neurons of the l- and the m-APT. The window in the head capsule was closed with the cut piece of cuticle, and the animals were kept in darkness and moistened air for a staining period of 6 – 8 h. Before imaging, antennae and mandibles were fixated with wax and the window in the head capsule was enlarged to access the right AL. Glands and trachea were carefully removed, and the esophagus was pulled out of the head capsule to prevent movement of the brain during data acquisition. Hemolymph above the brain was removed and substituted by two-component adhesive (KWIK-SIL; World Precision Instruments) to further prevent movement and desiccation of the brain. During experiments, the preparation was kept at constant temperature of 25°C using a heat lamp (IOT 100; Elstein). Calcium imaging experiments were performed using an upright microscope (LSM 510 Meta; Carl Zeiss) equipped with a 20 ⫻ water-immersion lens (Apochromat 20x, NA 1, VIS-IR, Carl Zeiss). For excitation, a two-photon laser was used at an excitation wavelength of 810 nm (Chameleon Titan:Sapphire LASER, Coherent Deutschland; beam splitters: MBS: HFT KP 650, NDD MBS: NDD KP685, NDD Refl.: none; filters: NDD2: HC680/SP), and laser power was adjusted depending on preparation and focal plane. For each stimulus, a series of 40 frames was recorded at a sampling rate of 4 Hz
106 • NOVEMBER 2011 •
www.jn.org
2440
PARALLEL PROCESSING OF SOCIAL ODORS IN ANTS
at a resolution of 64 ⫻ 64 pixels and an image pixel size of 3.4 ⫻ 3.4 m to 5.4 ⫻ 5.4 m. Pixel exposure time was ⬃25 s. The focal plane within the AL was adjusted to 40, 160, and 200 m below the ventral AL surface using a focusing system integrated in the microscope. We describe the orientation of neuropiles according to the nomenclature used for the honeybee (Strausfeld 2002), and the ventral AL surface corresponds to the anterior AL surface in Drosophila literature (Tanaka et al. 2008). A focal plane at 40 m has been selected as it corresponds to the region of the AL where previously glomerular activity in response to colony odors had been recorded using wide-field microscopy (Brandstaetter et al. 2011). Focal planes at 160 and 200 m have been selected to record activity from AL regions not accessible with wide-field microscopy, aiming for the T6 cluster, which has been suggested to act as a processing center for colony odors (Nakanishi et al. 2010). The T6 cluster is innervated by S. basiconica (Kelber et al. 2010), which have been proposed of being important for nonnestmate detection (Ozaki et al. 2005). We prepared 144 workers of which 38 (26.4%) showed bright staining of projection neurons and glomeruli across the whole AL, and in 18 preparations we measured spontaneous activity of glomeruli. As a test stimulus for functionality, we presented a general odor (octanol at a dilution of 10⫺2) incorporated into a constant and moistened air stream by a computer-controlled solenoid valve as a 1 s odor puff. We measured neuronal activity in response to air-delivered octanol in 13 animals. For colony odor stimulation, we used dummies loaded with a PPG extract of nestmates (NM), a PPG extract of nonnestmates (nNM), and solvent only on a heated dummy (control). Dummydelivered stimulation was triggered by the imaging software and started 5 s after recording onset for a stimulation period of 1 s. Colony odors were presented in a stereotyped stimulation sequence. Each stimulation sequence consisted of 3 stimulation cycles. Within a stimulation cycle we presented odors in the following sequence: NM, nNM, control (i.e., 3 odor trials). Within each odor trial, we recorded successively neuronal responses at three different focal planes (at 40, 160, and 200 m below AL surface); hence, stimulating three times with the same odor at an interstimulus interval of 1 min. Intertrial interval between different odors was ⱖ6 min The whole stimulation sequence at three different focal planes was recorded in nine animals; however, in two animals recordings at 200 m could not be analyzed. Imaging data were analyzed using custom software written in Interactive Data Language (IDL 6.0; ITT Visual Information Solutions) by Giovanni Galizia and Mathias Ditzen (University of Konstanz). We calculated the change in fluorescence intensity of the images (⌬F/F) and corrected manually for possible movement of the AL between measurements. Furthermore, intensity value signs were inverted, and as a result an increase in brightness indicates an increase in neuronal activity. To visualize neuronal responses to the different colony odors as false color-coded images, we subtracted the average of three frames before stimulation from the average of three frames during stimulation. Anatomy of the AL. After calcium imaging experiments, a highresolution image stack was recorded for visual inspection of the AL anatomy (256 ⫻ 256 pixel, 1-m step size). For orientation, we used easily identifiable landmarks in the AL: the ventral-lateral and the medial-dorsal somata clusters and the dorsal border of the antennal nerve entrance point (Zube et al. 2008), as well as the “lateral passage” in the dorsal part of the AL (Flanagan and Mercer 1989; Kirschner 2005; Kirschner et al. 2006; Pareto 1972). We assured that similar AL areas were recorded in the different specimens by visual comparison of identified landmarks. In one specimen, an image stack with a resolution of 512 ⫻ 512 pixel (1-m step size) was recorded and used to reconstruct the glomeruli of the AL using 3-D reconstruction software (AMIRA 3.1, Mercury Computer Systems). The hemilobe located in the ventral-rostral part of the AL (VR-hemilobe) is innervated by l-APT PNs, while the dorsal-caudally located hemilobe (DC-hemilobe) is innervated by m-APT PNs. Based on the landmarks, glomeruli were assigned to J Neurophysiol • VOL
the VR- or the DC-hemilobe at each focal plane by comparison to earlier anatomical studies in Camponotus species (Nakanishi et al. 2010; Zube et al. 2008). At 40 m, the brightly stained ventrallateral somata cluster is visible (Fig. 2A, white arrow heads), and the glomeruli, hence, belong to the VR-hemilobe (l-APT innervated). The focal plane at 160 m is at the dorsal border of the antennal nerve entrance point (Fig. 2D), and the ventral border of the medial-dorsal somata cluster is visible (Fig. 2B). At 200 m, the medial-dorsal somata cluster and the “lateral passage” are clearly visible (Fig. 2C). From this, we conclude that the brightly stained glomeruli at 160 m and the glomeruli at 200 m below ventral AL surface belong to the DC-hemilobe of the AL (m-APT innervated). The AL volume we measured was larger than reported in other publications, probably because in our study were recorded in vivo; hence, the ALs were not subject to shrinking. Data evaluation. First, we selected regions of interest (ROIs) within animals at each recorded focal plane (at 40, 160, and 200 m below the ventral AL surface). ROIs were selected where glomeruli were morphologically visible based on the fura-2 dextrane staining. Here, spontaneous activity unambiguously corresponded to individual glomeruli. Additionally, ROIs were selected where spontaneous activity was in the size range of morphologically visible glomeruli and, hence, revealed the location of glomeruli, which were not clearly distinguishable solely based on the innervation of their stained PNs. However, we cannot completely exclude that in few of these cases the selected ROIs may represent more than one single glomerulus. Since there is no standard AL atlas available for C. floridanus, and the ⬃460 glomeruli are small and densely packed (Zube et al. 2008), identification of individual glomeruli across specimen is not possible. To meet with these constraints, analysis of imaging data and statistics were performed only within animals. To separate spontaneous activity from colony odor elicited activity, we pooled the fluorescence changes over time of repeated stimulations with the same colony odor. This procedure was used to average out random, spontaneous activity, and at the same time preserved stimulus correlated activity. A glomerulus was defined as activated by colony odor if its fluorescence change upon stimulation was at least three times higher than the SD of variation in fluorescence changes before stimulation. Glomeruli activated by control stimulation were excluded from further analyses. To test whether there are differences in the strength of neuronal responses to colony odors at different focal planes, we determined the proportion of colony odor activated glomeruli at each focal plane and tested for differences using Wilcoxontests (matched-pair comparison within animals). Furthermore, we identified the glomeruli activated most strongly (i.e., with the highest fluorescence change) by colony odors at each focal plane and tested for differences in maximal fluorescence change between focal planes using paired t-tests (comparison within animals). Significance levels for both tests were adjusted to correct for multiple testing using the Bonferroni-Holm method, setting ␣1 to 0.017, ␣ 2 to 0.025, and ␣ 3 to 0.05. To compare spatial activity patterns elicited by nestmate and nonnestmate colony odors, we calculated principal component analyses (PCA) over time (ranging from 1 s before stimulation to 2 s after stimulation). We prepared one matrix for each animal containing all ROIs as rows and all stimuli in consecutive time frames as columns as described by Niessing and Friedrich (2010) and calculated covariance-based principal components (PC). We included all ROIs in the PCAs, and this yielded qualitatively similar results as PCAs containing only ROIs of colony odoractivated glomeruli or glomeruli located 160 m below the ventral AL surface. For each odor trial (i.e., stimulation at all 3 focal planes), we pooled 1) eigenvector loadings of 1 s before stimulation (pre) and 2) eigenvector loadings during stimulation (stim) to describe how the spatial activity patterns evolve upon stimulation (odor trajectories). For visualization of trajectories, we pooled within animals the eigenvector loadings of repeated odor trials of
106 • NOVEMBER 2011 •
www.jn.org
PARALLEL PROCESSING OF SOCIAL ODORS IN ANTS
2441
Fig. 2. Antennal lobe (AL) anatomy: 2-photon images and 3-D reconstruction. A–C: High-resolution two-photon microscope images of an in vivo recorded AL (ventral view) at 3 different focal planes (40, 160, and 200 m below ventral AL surface). Glomeruli are visible as spherical structures with a diameter of 20 –50 m, which are innervated by projection neuron dendrites (bright branches). Projection neuron somata are brightly stained, and the somata clusters can be used as landmarks for orientation. At 40 m (A), the ventral-lateral somata cluster is visible (white arrow heads). At 160 m (B), the ventral border of the medial-dorsal somata cluster is visible (white arrow). At 200 m (C), the medial-dorsal somata cluster can be clearly seen (white arrow) in addition to the “lateral passage” (grey arrow). Based on the landmarks, glomeruli at 40 m below AL surface belong to ventral-rostral part of the AL (VR-hemilobe; l-APT-innervated), while the brightly stained glomeruli at 160 m and glomeruli at 200 m belong to the dorsal-caudally located hemilobe (DC-hemilobe; m-APT-innervated). D: 3-D reconstruction of a vital AL (caudal view). A high-resolution image stack allowed reconstructing the AL to illustrate the location of the focal planes at 40, 160, and 200 m below ventral AL surface. For orientation, the antennal nerve is shown in transparent green. For each focal plane, the glomerulus responding most strongly to colony odor stimulation has been marked in yellow. c, Caudal. r, rostral; m, medial; l, lateral; v, ventral; d, dorsal.
the same colony odor (pooled trajectories) and plotted the first three PCs in a three-dimensional space (3-D plot). For statistical analysis, we calculated Euclidean distances of eigenvector loadings (ED) between odor pairs of nestmate and nonnestmate trials (NM-nNM) before stimulation (“pre”) and during stimulation (“stim”). According to Scree-tests, we included 8 –14 PCs, describing 33.3– 69.6% of the variance. To test whether the activity patterns change upon stimulation, we compared EDs of the odor pair NM-nNM in pre and in stim conditions using paired t-tests. To describe the variability of spatial activity patterns of repeated odor trials of the same colony odor, we plotted the trajectories representing individual odor trials within animals. To quantify variability, we calculated EDs between odor pairs of consecutive repeated J Neurophysiol • VOL
odor trials with the same colony odor (nestmate: NM-NM; nonnestmate nNM-nNM) and between odor pairs of consecutive odor trials with nestmate and nonnestmate colony odor (NM-nNM). We tested these distances statistically using paired t-tests. First, we compared EDs of similar odor pairs in pre and stim conditions; second, we compared EDs of the odor pairs NM-NM, nNM-nNM, and NM-nNM in the stim condition. Again, significance levels were adjusted to correct for multiple testing using the Bonferroni-Holm method, setting ␣1 to 0.008, ␣2 to 0.01, ␣3 to 0.0125, ␣4 to 0.017, ␣5 to 0.025, and ␣6 to 0.05. Euclidean distances were calculated with table calculation software (MS Office Excel 2007 SP2; Microsoft). For statistical testing and plotting of graphs, we used Statistica 9.1 (StatSoft Europe).
106 • NOVEMBER 2011 •
www.jn.org
2442
PARALLEL PROCESSING OF SOCIAL ODORS IN ANTS
RESULTS
We investigated the neuronal representation of colony odors in glomeruli of the AL in nine animals. We recorded neuronal activity of VR-hemilobe glomeruli at 40 m and of DChemilobe glomeruli at 160 and 200 m below the ventral AL surface. Glomeruli were clearly visible at all recorded focal planes of the AL, and the high spatial resolution of two-photon microscopy allowed for collecting high-resolution image stacks right after recording neuronal activity (Fig. 2). Spontaneous activity was very high throughout the recordings (⌬F/F ⬎ 2.5%), and this allowed identification of less clearly visible glomeruli. In the 9 investigated animals, between 102 and 264 ROIs corresponding to glomeruli were selected for further analysis (mean: 197 ROIs). We measured both activation and inhibition of glomeruli in response to nestmate and nonnestmate colony odor stimulation at all recorded focal planes (see Fig. 3 as an example at 160 m) and between 13.5 and 32.4% of all ROIs responded to stimulation with colony odors (mean: 21.7%). In contrast, no stimulus-correlated activity was measured, when a heated control dummy (solvent only) was presented (Fig. 3, D and H). Spatial activity patterns in response to nestmate and nonnestmate colony odors were overlapping (compare Fig. 3, B and C): between 12.0 and 44.4% of the ROIs responding to colony odor stimulation responded to both nestmate and nonnestmate colony odor (mean: 27.3%). To quantify neuronal responses to colony odors in different AL compartments, we investigated the strength of response to colony odors across focal planes. As a measure of response strength, we counted how many ROIs responded at each focal plane and assessed the maximal signal amplitude (i.e., fluores-
cence change; Fig. 4). A higher number of ROIs responded to colony odors at 160 and 200 m than at 40 m (Table 1). To avoid bias from a possibly higher number of selected ROIs at the two more dorsally located levels, we compared the proportion of responding ROIs for each focal plane within each animal. A significantly higher proportion of ROIs responded to colony odors at 160 m than at 40 m (Fig. 4A; BonferroniHolm corrected Wilcoxon-test, Z ⫽ 2.55, P ⫽ 0.011), whereas no significant differences were found between 40 and 200 m (Z ⫽ 0.169, P ⫽ 0.866) and between 160 and 200 m (Z ⫽ 1.69, P ⫽ 0.091). To compare signal amplitudes across focal planes, we selected the ROI most strongly activated by colony odor (i.e., with the highest fluorescence change) on each focal plane and in each animal and tested them statistically (Fig. 4B). Maximal signal amplitudes were significantly higher at 160 m than at 40 m [Bonferroni-Holm corrected paired t-test, t ⫽ ⫺3.55, degrees of freedom (DF) ⫽ 8, P ⫽ 0.0075]. Maximal signal amplitudes at 200 m were between those at 40 and 160 m, yet no significant differences were found (40 vs. 200 m: t ⫽ ⫺1.57, DF ⫽ 6, P ⫽ 0.167; 160 vs. 200 m: t ⫽ 1.21, DF ⫽ 6, P ⫽ 0.271). Interestingly, all ROIs responding most strongly to colony odors at 160 m responded to both nestmate and nonnestmate colony odor (Table 2). In summary, neuronal responses to colony odors were stronger in the DC-hemilobe (at 160 m) than in the VR-hemilobe (at 40 m), i.e., more glomeruli responded with higher signal amplitudes. Importantly, however, neuronal activity elicited by colony odors was not restricted to specific compartments within the AL. Next, we compared the spatial activity patterns elicited by nestmate and nonnestmate colony odor. We performed princi-
Fig. 3. Calcium imaging: neuronal activity in response to colony odor stimulation. A: low-resolution image of the AL at a focal plane of 160 m below the ventral surface of the AL with marked regions of interest (ROI; white boxes). Note that the resolution for calcium imaging was reduced to reduce exposure time. ROIs were selected were glomeruli were clearly visibly or where their location was revealed by spontaneous activity. B–D: false-color-coded images of neuronal activity in response to nestmate (B) and nonnestmate colony odor (C) and control stimulation (solvent only, D). Red indicates areas of increased neuronal activity (activation), while blue indicates regions of reduced activity (inhibition). A colored bar indicates the fluorescence changes in percent. Spatial activity patterns elicited by nestmate and nonnestmate colony odors were overlapping. E-H: kinetics of 2 selected ROIs (E), each representing 1 activated glomerulus (red line) and 1 inhibited glomerulus (blue line) upon stimulation with nestmate (F) and nonnestmate colony odor (G). No stimulus correlated activity was measured upon control stimulation (H). Selected ROIs are marked in B–D as black boxes. A grey bar indicates the stimulation period of 1 s. The red glomerulus is only activated upon colony odor stimulation. In contrast, the blue glomerulus is spontaneously active throughout the recording, being only briefly inhibited during colony odor stimulation. J Neurophysiol • VOL
106 • NOVEMBER 2011 •
www.jn.org
PARALLEL PROCESSING OF SOCIAL ODORS IN ANTS
2443
Table 2. Odor identity of ROIs most strongly activated by colony odors across focal planes Activated By
Focal Plane Below Ventral AL Surface
N
NM
nNM
NM and nNM
40 m 160 m 200 m
9 9 7
7 9 5
4 9 6
2 (22%) 9 (100%) 4 (57%)
For each focal plane below ventral AL surface, the ROI activated most strongly (with the highest fluorescence change) by colony odor was selected in each animal. Table shows how many ROIs responded most strongly to which colony odor in each focal plane: nestmate (NM), nonnestmate (nNM), or both (NM and nNM). Proportions of how many ROIs were activated by both nestmate and nonnestmate colony odor at each focal plane is given in parenthesis. N ⫽ number of tested animals per focal plane.
Fig. 4. Comparison of neuronal response strength to colony odors across focal planes. A: proportion of ROIs (corresponding to glomeruli) activated by colony odors across focal planes below ventral AL surface. *Significant difference in a Bonferroni-Holm corrected Wilcoxon-test. A significantly higher proportion of glomeruli was activated by colony odors at 160 m than at 40 m. B: mean signal amplitude (fluorescence change) of the most strongly activated glomeruli in each focal plane. For each focal plane in each animal the glomerulus activated most strongly by colony odor was selected and the measured fluorescence changes tested across focal planes. *Significant difference in a Bonferroni-Holm corrected paired t-test. Glomeruli located 160 m below ventral AL surface responded with a significantly higher signal amplitude to stimulation with colony odors than glomeruli located at 40 m. Thus colony odors are represented stronger in the DC-hemilobe (at 160 m) than in VR-hemilobe (at 40 m), i.e., more glomeruli responded with higher signal amplitudes. N, number of tested animals per focal plane.
pal component analyses within animals. First, we plotted pooled NM and nNM trajectories (Fig. 5). Upon stimulation (stim) the NM and nNM trajectories evolved into the same direction, which was different from the control trajectory (Fig. 5, A and B). We compared EDs of the odor pair NM-nNM in Table 1. Number of ROIs responding to colony odors across focal planes Focal Plane Below Ventral AL Surface
Median
Range
Total
40 m 160 m 200 m
9 21 16
2–12 14–38 5–23
75 197 101
ROIs, regions of interest. AL, antennal lobe. J Neurophysiol • VOL
pre and in stim conditions and found a significant difference (Fig. 5C; paired t-test, t ⫽ ⫺4.64, DF ⫽ 8, P ⫽ 0.0017). This result shows that the spatial activity patterns in the AL become more different in response to nestmate and nonnestmate colony odor stimulation, indicating a change from spontaneous activity before stimulation to colony odor specific activity patterns upon stimulation. To assess variability, we compared the trajectories representing individual odor trials (Fig. 6). Individual NM and nNM trajectories evolved into the same general direction upon stimulation and were not clearly segregated from each other, whereas the control trajectory evolved into a different direction (Fig. 6, A and B). To quantify variability, we statistically tested 1) EDs of similar odor pairs (NM-NM and nNM-nNM) in pre and stim conditions, and 2) EDs of the odor pairs NM-NM, nNM-nNM, and NM-nNM in the stim condition. EDs between odor pairs in the pre condition were significantly lower than in the stim condition (Table 3, pre and stim). In the stim condition, EDs between nNM-nNM were significantly lower than between NM-NM and between NM-nNM. There was no significant difference in EDs between NM-NM and between NM-nNM (Table 3, stim). Thus, in a n-dimensional space, trajectories representing activity patterns elicited by nestmate colony odor expand more fanned out than those representing nonnestmate colony odor; yet, the nonnestmate colony odor representations are not clustered distinctly outside the (larger) area of space occupied by nestmate colony odor representations. Spatial activity patterns elicited by nonnestmate colony odor are less variable than activity patterns elicited by nestmate colony odor. DISCUSSION
In this study, we investigated the neuronal representation of a social odor, which is used to identify friends and foes, in the AL of ants. Multicomponent colony odors of nestmates and nonnestmates were represented in overlapping spatial activity patterns. Overlapping representation was expected, since both colony odors consist of the same components at differing ratios. Although the activity patterns were not homogeneously distributed, we did not find exclusive representations restricted to single AL compartments. Our results indicate that information about colony odors is processed in parallel, using the computational power of the whole AL network. Parallel processing might be advantageous, when the olfactory system has to reliably discriminate highly complex social odors. Activity
106 • NOVEMBER 2011 •
www.jn.org
2444
PARALLEL PROCESSING OF SOCIAL ODORS IN ANTS
Fig. 5. Principal component (PC) analysis: pooled 3-D trajectories upon colony odor stimulation. A and B: exemplary 3-D trajectories representing the evolution of spatial activity patterns from prestimulus condition to stimulation (stim) in 2 animals. Repeated stimulations with nestmate (NM, green) and nonnestmate colony odor (nNM, magenta) were pooled. In addition, a trajectory describing the control stimulation is shown (control, blue). Colony odor trajectories evolve into the same direction, which is different from the control stimulation trajectory. C: mean Euclidean distances of eigenvecotrs between nestmate and nonnestmate trajectories (NM-nNM) of 9 animals before (pre) and during simulation (stim). *Significant difference in a paired t-test. This result shows that the spatial activity patterns in the AL become more different in response to nestmate and nonnestmate colony odor, indicating a change from spontaneous activity before stimulation to colony odor-specific activity patterns upon stimulation. J Neurophysiol • VOL
patterns in response to repeated stimulation with the same colony odor were variable, yet variability was higher in response to nestmate than to nonnestmate colony odor. We speculate that this finding may reflect plasticity of the AL network, which allows for adjustment of the neuronal template to a changing colony odor, i.e., template reformation. The AL of C. floridanus consists of ⬃460 glomeruli, which are arranged in distinct neuroanatomical compartments (Zube et al. 2008). Using advanced two-photon microscopy, we measured neuronal activity in various compartments by recording at three different focal planes in the AL (at 40, 160, and 200 m below ventral AL surface). High spatial resolution of two-photon microscopy in combination with high spontaneous activity in the AL allowed us to localize the majority of glomeruli at each focal plane. We carefully selected on average almost 200 ROIs in each AL, and based on our selection criteria we are confident that these actually correspond to individual glomeruli. Hence, recording at three different focal planes allowed us to monitor the neuronal activity of ⬃40% of all AL glomeruli. We identified landmarks in the AL (ventrallateral and the medial-dorsal somata clusters, dorsal border of the antennal nerve entrance point, “lateral passage”), and this allowed us to allocate the glomeruli to either the VR-hemilobe (l-APT innervated; glomeruli at 40 m and lateral-rostrally located glomeruli at 160 m) or the DC-hemilobe (m-APT innervated; medial-caudally located glomeruli at 160 m and glomeruli at 200 m). In our approach, it is not possible to precisely allocate glomeruli to specific AL clusters; however, based on their location within the AL and visual comparison to completely reconstructed ALs with allocated clusters (Kirschner 2005; Zube et al. 2008), we conclude that glomeruli at 40 m belong to the glomerular clusters T1-T3. At 160 m, the brightly stained, medial-caudally located glomeruli are part of the T5-cluster, while the weakly stained, lateral-rostrally located glomeruli belong to the T4-cluster. In the most dorsal part of the AL, the T6-cluster is located, consisting of ⬃140 glomeruli (Nakanishi et al. 2010; Zube et al. 2008; Zube and Rössler 2008). Based on the high number of glomeruli and our 3-D reconstruction (Fig. 2D), we are confident that we recorded from T6-glomeruli at the most dorsal focal plane, although glomeruli of other clusters might as well have been visible at this plane. The T6-cluster is innervated by S. basiconica (Kelber et al. 2010), which are CHC-sensitive and which have been suggested to be important for colony recognition (Ozaki et al. 2005). Neither did we find an exclusive representation of nestmate and/or nonnestmate colony odor in the T6-cluster nor did we measure the strongest neuronal responses in the region where T6-glomeruli are located (at 200 m). Since we measured neuronal responses to colony odors in clusters, which are not innervated by S. basiconica but by S. trichodea curvata, an exclusive role of a specific sensillum type, i.e., at the first level of compartments, can be ruled out for colony recognition. Furthermore, we did not find any indications that the S. basiconica innervated T6-cluster might function as a center for colony recognition, as proposed previously (Nakanishi et al. 2010). Besides the T6-cluster, we measured activity in response to colony odors in all other investigated glomerular cluster (T1–T5 cluster). For the T7 cluster that is located at the most dorsal part of the AL, which we could not assess in our recordings, it is known that some of its glomeruli are involved
106 • NOVEMBER 2011 •
www.jn.org
PARALLEL PROCESSING OF SOCIAL ODORS IN ANTS
in temperature sensing (Nakanishi et al. 2009; Ruchty et al. 2010). Our results show that colony odors are represented in at least six out of the seven sensory tract clusters of the AL. Thus information about colony odors is processed across sensory tract clusters, which indicates parallel processing also on this second level of compartments. Since the combinatorial code about colony odors is distributed across glomerular clusters, we asked the question whether this is also the case on the third level of compartments, which is the dual olfactory pathway (Kirschner et al. 2006; Zube et al. 2008). We found activity in glomeruli that belong either to the l-APT or the m-APT hemilobe, which supports the idea of parallel processing of colony odor information also along the dual olfactory pathway. On average, one-fifth of all ROIs (individual glomeruli) in an animal responded to colony odors. The strongest responses
2445
Table 3. Statistics on Euclidean distances between principal components of colony odor-elicited neuronal responses (i.e., trajectories; see Fig. 5C) Paired t-Test Comparing Pre and stim NM-NM (pre) vs. NM-NM (stim) nNM-nNM (pre) vs. nNM-nNM (stim) NM-nNM (pre) vs. NM-nNM (stim) Stim NM-NM (stim) vs. nNM-nNM (stim) NM-nNM (stim) vs. NM-NM (stim) NM-nNM (stim) vs. nNM-nNM (stim)
DF
t Value
P Value
9 9 9
⫺5.92 ⫺6.30 ⫺5.20
0.0004 0.0002 0.0008
9 9 9
3.02 ⫺1.00 3.60
0.016 0.346 0.007
Degrees of freedom (DF), t values, and P values are given for BonferroniHolm corrected paired t-tests on Euclidean distances between principal components of odor pairs before (pre) and during stimulation (stim) and during stimulation (stim). Odor pairs were repeated stimulations with nestmate colony odor (NM-NM), repeated stimulations with nonnestmate colony odor (nNMnNM), and stimulation with nestmate and nonnestmate colony odor (NMnNM).
were measured in the ventral part of the DC-hemilobe (at 160 m). The inhomogeneous distribution of neuronal activity is based on the functional organization of the AL network, and glomeruli with similar odor response profiles are not dispersed stochastically across the AL but are often located closely adjacent to each other (Sachse et al. 1999). Colony odors of nestmates and nonnestmates are very similar, consisting of the same components with differing ratios (Howard and Blomquist 2005). On average, 27.3% of all glomeruli activated by a colony odor in an animal responded to both nestmate and nonnestmate colony odor, and this was particularly true for those glomeruli responding most strongly to colony odors (at 160 m). Spatial activity patterns in response to repeated stimulation with nestmate and nonnestmate colony odor were variable in both hemilobes. What might have caused these variable neuronal representations in response to colony odors? Variable neuronal responses may reflect variability of the stimulus. Colony odors have a very low volatility, and, hence, diffusion Fig. 6. Principal component analysis: 3-D trajectories upon repeated colony odor stimulation. A and B: exemplary 3-D trajectories representing the evolution of spatial activity patterns from prestimulus condition to stimulation (stim) of 2 animals (same specimens as in Fig. 4, A and B, respectively). Trajectories of repeated stimulation with nestmate (NM, green) and nonnestmate colony odor (nNM, magenta) and of 1 control stimulation (control, blue) are shown (first stimulation: solid lines with pointed ends; second stimulation: dashed lines with squared ends; third stimulation: dotted lines with diamonded ends). In contrast to the control stimulation trajectory, colony odor trajectories evolve generally into the same direction; however, repeated nestmate and nonnestmate trajectories are variable and not segregated from each other. C: mean Euclidean distances of eigenvectors between odor pairs of 9 animals before (pre) and during simulation (stim). Odor pairs are either consecutive repeated stimulations with the same colony odor (NM-NM and nNM-nNM) or consecutive stimulations with nestmate and nonnestmate colony odors (NM-nNM). This analysis allows for assessing the variability of spatial activity patterns in response to repeated stimulations with the same colony odor and compare it to the variability in spatial activity patterns in response to stimulation with a different colony odor. Euclidian distances before stimulation (pre, empty boxes) were significantly lower than during stimulation (stim, full boxes) for all odor pairs. During stimulation (stim, full boxes), Euclidean distances between nNM-nNM (a) were significantly lower than between NM-NM and between NM-nNM (b; see Table 3 for statistics). Thus spatial activity patterns elicited by nonnestmate colony odor are less variable than activity patterns elicited by nestmate colony odor. J Neurophysiol • VOL
106 • NOVEMBER 2011 •
www.jn.org
2446
PARALLEL PROCESSING OF SOCIAL ODORS IN ANTS
into headspace is low. For presentation of colony odors, we used a stimulation technique resembling the natural situation by simulating close-range colony odor detection from a nearby nestmate or nonnestmate. The multicomponent odor stimulus arriving at the antenna of an ant does not only depend on the chemical composition of the colony odor but may also vary depending on external physical factors like temperature, humidity, as well as the distance and diffusion rate between colony odor source and receiver. Subtle differences in the arriving stimulus may result in variable neuronal responses. Nevertheless, ants are able to very accurately discriminate colony odors under such stimulus conditions (Brandstaetter et al. 2008, 2011). To quantify variability, we compared the spatial activity patterns of odor pairs of repeated stimulations with the same colony odor (nestmate vs. nestmate and nonnestmate vs. nonnestmate) using a PCA. We found that spatial activity patterns were less variable in response to repeated stimulation with nonnestmate than with nestmate colony odor. What might be the cause of different variability of nestmate and nonnestmate colony odor elicited activity patterns? The neuronal template needs to be plastic, as it has to be constantly adjusted to changing colony odors (Lahav et al. 2001; Provost et al. 1993; Vander Meer et al. 1989; Wallis 1963). Learning has been shown to result in changes of the neuronal representation of odors in the AL, indicating plasticity of the AL network (Daly et al. 2004; Faber et al. 1999; Fernandez et al. 2009; Hourcade et al. 2009). Representation of nestmate colony odor possibly is constantly adjusted, even between repeated stimulations. We propose that the variability in activity patterns reflects the adjustment of the neuronal template, particularly apparent for nestmate colony odor representation. Variability might be a neuronal correlate of template reformation. Due to their high variability, spatial activity patterns do not provide sufficient information to discriminate nestmate from nonnestmate colony odor. How are colony odors classified by the nervous system as being nestmate or nonnestmate specific? Additional parameters of neuronal activity are most probably necessary to allow discrimination and recent studies emphasize the importance of precise timing of neuronal activity for discrimination of chemically similar odors and odor blends (Krofczik et al. 2009; Lei et al. 2004; Lei and Vickers 2008; Martin and Hildebrand 2010; Riffell et al. 2009a, 2009b). In this study, we found less variable spatial activity patterns in response to nonnestmate compared with nestmate colony odor and this might facilitate the detection and classification of foes at the next level of the olfactory pathway by increasing the chance of precisely timed coincidental activity, e.g., in Kenyon cells of the mushroom bodies. Recently, and based on behavioral data, colony recognition was suggested to be effectively mediated by nonnestmate recognition only (Guerrieri et al. 2009; van Zweden and D’Ettorre 2010). However, commonly used behavioral assays do not allow for determining why individuals are accepted, be it because they are recognized as nestmates or classified as friends due to learning and memory of several colony odors. Aggression-based behavioral experiments are biased in assessing only the high discriminatory power of ants for rejection but not for acceptance. Indeed, ants are well known to reliably discriminate between members of different castes and life J Neurophysiol • VOL
stages within their own colony (Greene and Gordon 2003; Kaib et al. 2000; Wagner et al. 1998, 2001). We show that ants are not anosmic to nestmate colony odor. Information about both nestmates and nonnestmates is passed on to higher brain centers, as we measured the AL output. For a neuronal process as complex as colony recognition, it may be advantageous to use information about nestmates and nonnestmates side by side to allow reliable recognition. Functional segregation within single compartments and parallel processing distributed across compartments are two different processing mechanism and examples for both have been described in the insect olfactory system (Galizia and Rössler 2010). Depending on the requirements on odor detection or odor discrimination, selective pressure may ultimately favor either one or the other mechanism. Complex blends, like e.g., colony odors, demand a high discriminatory power of the nervous system. In this case, distributed activity and parallel processing may be advantageous, as the computational power of the whole AL network can be used to solve the discriminatory task. On the other hand, a functional segregation with exclusive processing in specialized centers may be favored in case high sensitivity is needed for detecting even minute quantities of single components, e.g., of a sex pheromone. However, these two principles are not irrevocably imperative: trail pheromone is used by many different ant species, and often sensitivity is remarkably high (Hölldobler and Wilson 1990). However, whereas major workers of leaf-cutting ants exhibit functional segregation using a trail pheromone specific macroglomerulus for detection (Kelber et al. 2009, 2010; Kleineidam et al. 2005, 2007a; Kuebler et al. 2010), carpenter ants do not feature such a specialized compartment and the releaser component of their trail pheromone is represented in the AL in distributed patterns of activity (Brandstaetter et al. 2010; Zube et al. 2008). In conclusion, the organization of the AL is shaped to balance the requirements of discriminatory power and sensitivity, and eventually opposing selective pressures result in a complex olfactory system adapted to the behavioral repertoire of a species. As the highly developed olfactory system of ants is easily accessible for a range of neurophysiological techniques, this system is ideally suited to unlock the principles underlying the processing of complex odors. ACKNOWLEDGMENTS We thank Christina Kelber for essential support in 3-D reconstruction, Giovanni Galizia for valuable assistance in IDL data analysis, and Gerhard Eisenmann for crafting our custom-built positioning system. Furthermore, we thank Giovanni Galizia, Paul Szyszka, and Jacob Stierle for support in two-photon microscopy, Gabriele Pszolla for support in gas chromatography, and two anonymous reviewers for helpful comments on an earlier version of this manuscript. GRANTS This work was supported by the Deutsche Forschungsgemeinschaft (Bonn, Germany; SFB 554/A6, SPP 1392/KL 1327) and by the Bioimaging Center, University of Konstanz (LSM 510 Meta). A. S. Brandstaetter was supported by a grant of the German Excellence Initiative to the Graduate School of Life Sciences, University of Würzburg. DISCLOSURES No conflicts of interest, financial or otherwise, are declared by the author(s).
106 • NOVEMBER 2011 •
www.jn.org
PARALLEL PROCESSING OF SOCIAL ODORS IN ANTS AUTHOR CONTRIBUTIONS A. S. B. and C. J. K. conception and design of research; A. S. B. performed experiments; A. S. B. analyzed data; A. S. B. and C. J. K. interpreted results of experiments; A. S. B. and C. J. K. prepared figures; A. S. B. drafted manuscript; A. S. B. and C. J. K. edited and revised manuscript; A. S. B. and C. J. K. approved final version of manuscript. REFERENCES Abel R, Rybak J, Menzel R. Structure and response patterns of olfactory interneurons in the honeybee, Apis mellifera. J Comp Neurol 437: 363–383, 2001. Akers RP, Getz WM. A test of identified response classes among olfactory receptor neurons in the honeybee worker. Chem Senses 17: 191–209, 1992. Akers RP, Getz WM. Response of olfactory receptor neurons in honeybees to odorants and their binary-mixtures. J Comp Physiol A 173: 169 –185, 1993. Akino T, Yamamura K, Wakamura S, Yamaoka R. Direct behavioral evidence for hydrocarbons as nestmate recognition cues in Formica japonica (Hymenoptera: Formicidae). Appl Entomol Zoolog 39: 381–387, 2004. Bagneres AG, Morgan ED. The postpharyngeal glands and the cuticle of Formicidae contain the same characteristic hydrocarbons. Experientia 47: 106 –111, 1991. Bhatkar A, Whitcomb WH. Artificial diet for rearing various species of ants. Florida Entomologist 53: 229 –232, 1970. Bos N, Guerrieri FJ, d’Ettorre P. Significance of chemical recognition cues is context dependent in ants. Anim Behav 80: 839 – 844, 2010. Brandstaetter AS, Endler A, Kleineidam CJ. Nestmate recognition in ants is possible without tactile interaction. Naturwissenschaften 95: 601– 608, 2008. Brandstaetter AS, Rössler W, Kleineidam CJ. Dummies versus air puffs: efficient stimulus delivery for low-volatile odors. Chem Senses 35: 323–333, 2010. Brandstaetter AS, Rössler W, Kleineidam CJ. Friends and foes from an ant brain’s point of view–neuronal correlates of colony odors in a social insect. PLos One 6: e21383, 2011. Carlin NF, Hölldobler B. Nestmate and kin recognition in interspecific mixed colonies of ants. Science 222: 1027–1029, 1983. Carlin NF, Hölldobler B. The kin recognition system of carpenter ants (Camponotus spp.). I. Hierarchical cues in small colonies. Behav Ecol Sociobiol 19: 123–134, 1986. Carlin NF, Hölldobler B. The kin recognition system of carpenter ants (Camponotus spp.). II. Larger colonies. Behav Ecol Sociobiol 20: 209 –217, 1987. Carlin NF, Hölldobler B, Gladstein DS. The kin recognition system of carpenter ants (Camponotus spp.). III. Within-colony discrimination. Behav Ecol Sociobiol 20: 219 –227, 1987. D’Ettorre P, Lenoir A. Nestmate recognition. In: Ant Ecology, edited by Lach L, Parr CL, Abbott KL. Oxford, UK: Oxford Univ. Press, 2010, p. 194 –209. Daly KC, Christensen TA, Lei H, Smith BH, Hildebrand JG. Learning modulates the ensemble representations for odors in primary olfactory networks. Proc Natl Acad Sci USA 101: 10476 –10481, 2004. Deisig N, Giurfa M, Sandoz JC. Antennal lobe processing increases separability of odor mixture representations in the honeybee. J Neurophysiol 103: 2185–2194, 2010. Dumpert K. Structure and distribution of sensilla on antannal flagellumg of Lasius fuliginosus (Latr) (Hymenoptera, Fomicidae). Zeitschrift für Morphologie der Tiere 73: 95–116, 1972. Dupuy F, Josens R, Giurfa M, Sandoz JC. Calcium imaging in the ant Camponotus fellah reveals a conserved odour-similarity space in insects and mammals. BMC Neurosci 11: 2010. Dupuy F, Sandoz JC, Giurfa M, Josens R. Individual olfactory learning in Camponotus ants. Anim Behav 72: 1081–1091, 2006. Endler A, Liebig J, Hölldobler B. Queen fertility, egg marking and colony size in the ant Camponotus floridanus. Behav Ecol Sociobiol 59: 490 – 499, 2006. Endler A, Liebig J, Schmitt T, Parker JE, Jones GR, Schreier P, Hölldobler B. Surface hydrocarbons of queen eggs regulate worker reproduction in a social insect. Proc Natl Acad Sci USA 101: 2945–2950, 2004. Faber T, Joerges J, Menzel R. Associative learning modifies neural representations of odors in the insect brain. Nat Neurosci 2: 74 –78, 1999. Fernandez PC, Locatelli FF, Person-Rennell N, Deleo G, Smith BH. Associative conditioning tunes transient dynamics of early olfactory processing. J Neurosci 29: 10191–10202, 2009. J Neurophysiol • VOL
2447
Flanagan D, Mercer AR. An atlas and 3-D reconstruction of the antennal lobes in the worker honey bee, Apis-Mellifera 6 (Hymenoptera, Apidae). Int J Insect Morphol Embryol 18: 145–159, 1989. Gadau J, Heinze J, Hölldobler B, Schmid M. Population and colony structure of the carpenter ant Camponotus floridanus. Mol Ecol 5: 785–792, 1996. Galizia CG, Menzel R, Hölldobler B. Optical imaging of odor-evoked glomerular activity patterns in the antennal lobes of the ant Camponotus rufipes. Naturwissenschaften 86: 533–537, 1999a. Galizia CG, Rössler W. Parallel olfactory systems in insects: anatomy and function. Annu Rev Entomol 55: 399 – 420, 2010. Galizia CG, Sachse S, Rappert A, Menzel R. The glomerular code for odor representation is species specific in the honeybee Apis mellifera. Nat Neurosci 2: 473– 478, 1999b. Galizia CG, Szyszka P. Olfactory coding in the insect brain: molecular receptive ranges, spatial and temporal coding. Entomol Exp Appl 128: 81–92, 2008. Getz WM, Akers RP. Olfactory response characteristics and tunig structure of placodes in the honey-bee Apis mellifera L. Apidologie 24: 195–217, 1993. Getz WM, Akers RP. Honeybee olfactory sensilla behave as integrated processing units. Behav Neural Biol 61: 191–195, 1994. Greene MJ, Gordon DM. Social insects– cuticular hydrocarbons inform task decisions. Nature 423: 32, 2003. Guerrieri FJ, Nehring V, Jørgensen CG, Nielsen J, Galizia CG, d’Ettorre P. Ants recognize foes and not friends. Proc R Soc Lond B Biol Sci 276: 2461–2468, 2009. Hansson BS (Editor). Insect Olfaction. Berlin, Germany: Springer-Verlag, 1999. Heinze J, Stengl B, Sledge MF. Worker rank, reproductive status and cuticular hydrocarbon signature in the ant, Pachycondyla cf. inversa. Behav Ecol Sociobiol 52: 59 – 65, 2002. Hildebrand JG, Shepherd GM. Mechanisms of olfactory discrimination: converging evidence for common principles across phyla. Annu Rev Neurosci 20: 595– 631, 1997. Hölldobler B. The chemistry of social regulation - multicomponent signals in ant societies. Proc Natl Acad Sci USA 92: 19 –22, 1995. Hölldobler B, Wilson EO. The Ants. Cambridge, MA: Belknap Press of Harvard Univ, Press, 1990, p. 732. Hölldobler B, Wilson EO. The Superorganism. New York, NY: W. W. Norton, 2009. Hourcade B, Perisse E, Devaud JM, Sandoz JC. Long-term memory shapes the primary olfactory center of an insect brain. Learn Mem 16: 607– 615, 2009. Howard RW, Blomquist GJ. Ecological, behavioral, and biochemical aspects of insect hydrocarbons. Annu Rev Entomol 50: 371–393, 2005. Joerges J, Kuttner A, Galizia CG, Menzel R. Representations of odours and odour mixtures visualized in the honeybee brain. Nature 387: 285–288, 1997. Josens R, Eschbach C, Giurfa M. Differential conditioning and long-term olfactory memory in individual Camponotus fellah ants. J Exp Biol 212: 1904 –1911, 2009. Kaib M, Eisermann B, Schoeters E, Billen J, Franke S, Francke W. Task-related variation of postpharyngeal and cuticular hydrocarbon compositions in the ant Myrmicaria eumenoides. J Comp Physiol A 186: 939 –948, 2000. Kelber C, Rössler W, Kleineidam CJ. Multiple olfactory receptor neurons and their axonal projections in the antennal lobe of the honeybee Apis mellifera. J Comp Neurol 496: 395– 405, 2006. Kelber C, Rössler W, Kleineidam CJ. Phenotypic plasticity in number of glomeruli and sensory innervation of the antennal lobe in leaf-cutting ant workers (A. vollenweideri). Dev Neurobiol 70: 222–234, 2010. Kelber C, Rössler W, Roces F, Kleineidam CJ. The antennal lobes of fungus-growing ants (Attini): neuroanatomical traits and evolutionary trends. Brain Behav Evol 73: 273–284, 2009. Kirschner S. Neuroanatomische Organisation von Projektionsneuronen des Antennallobus bei sozialen Hymenopteren. In: Diploma Thesis at the Department of Behavioral Physiology and Sociobiology (Zoology II). Würzburg, Germany: University of Würzburg, 2005. Kirschner S, Kleineidam CJ, Zube C, Rybak J, Grünewald B, Rössler W. Dual olfactory pathway in the honeybee, Apis mellifera. J Comp Neurol 499: 933–952, 2006. Kleineidam C, Rössler W. Adaptations in the olfactory system of social hymenoptera. In: Organization of Insect Societies: From Genome to Socio-
106 • NOVEMBER 2011 •
www.jn.org
2448
PARALLEL PROCESSING OF SOCIAL ODORS IN ANTS
complexity, edited by Gadau J, Fewell J. Cambridge/London: Harvard Univ. Press, 2009, p. 195–219. Kleineidam CJ, Obermayer M, Halbich W, Rössler W. A macroglomerulus in the antennal lobe of leaf-cutting ant workers and its possible functional significance. Chem Senses 30: 383–392, 2005. Kleineidam CJ, Rössler W, Hölldobler B, Roces F. Perceptual differences in trail-following leaf-cutting ants relate to body size. J Insect Physiol 53: 1233–1241, 2007a. Kleineidam CJ, Ruchty M, Casero-Montes ZA, Roces F. Thermal radiation as a learned orientation cue in leaf-cutting ants (Atta vollenweideri). J Insect Physiol 53: 478 – 487, 2007b. Knaden M, Wehner R. Nest defense and conspecific enemy recognition in the desert ant Cataglyphis fortis. J Insect Behav 16: 717–730, 2003. Krofczik S, Menzel R, Nawrot MP. Rapid odor processing in the honeybee antennal lobe network. Front Comput Neurosci 2: 9, 2009. Kuebler LS, Kelber C, Kleineidam CJ. Distinct antennal lobe phenotypes in the leaf-cutting ant (Atta vollenweideri). J Comp Neurol 518: 352–365, 2010. Lahav S, Soroker V, Hefetz A, Vander Meer RK. Direct behavioral evidence for hydrocarbons as ant recognition discriminators. Naturwissenschaften 86: 246 –249, 1999. Lahav S, Soroker V, Vander Meer RK, Hefetz A. Segregation of colony odor in the desert ant Cataglyphis niger. J Chem Ecol 27: 927–943, 2001. Lei H, Christensen TA, Hildebrand JG. Spatial and temporal organization of ensemble representations for different odor classes in the moth antennal lobe. J Neurosci 24: 11108 –11119, 2004. Lei H, Vickers N. Central processing of natural odor mixtures in insects. J Chem Ecol 34: 915–927, 2008. Leonhardt SD, Brandstaetter AS, Kleineidam CJ. Reformation process of the neuronal template for nestmate-recognition cues in the carpenter ant Camponotus floridanus. J Comp Physiol A 193: 993–1000, 2007. Martin JP, Hildebrand JG. Innate recognition of pheromone and food odors in moths: a common mechanism in the antennal lobe? Front Behav Neurosci 4: 159, 2010. Martin SJ, Drijfhout FP. Nestmate and task cues are influenced and encoded differently within ant cuticular hydrocarbon profiles. J Chem Ecol 35: 368 –374, 2009. Mobbs PG. The brain of the honeybee Apis-Mellifera. 1. The connections and spatial-organization of the mushroom bodies. Philos Trans R Soc Lond B Biol Sci 298: 309 –354, 1982. Moore D, Liebig J. Mixed messages: fertility signaling interferes with nestmate recognition in the monogynous ant Camponotus floridanus. Behav Ecol Sociobiol 64: 1011–1018, 2010. Morel L, Vander Meer RK, Lavine BK. Ontogeny of nestmate recognition cues in the red carpenter ant (Camponotus floridanus)– behavioral and chemical evidence for the role of age and social experience. Behav Ecol Sociobiol 22: 175–183, 1988. Müller D, Abel R, Brandt R, Zockler M, Menzel R. Differential parallel processing of olfactory information in the honeybee, Apis mellifera L. J Comp Physiol A 188: 359 –370, 2002. Mysore K, Shyamala BV, Rodrigues V. Morphological and developmental analysis of peripheral antennal chemosensory sensilla and central olfactory glomeruli in worker castes of Camponotus compressus (Fabricius, 1787). Arthropod Struct Dev 39: 310 –321, 2010. Mysore K, Subramanian KA, Sarasij RC, Suresh A, Shyamala BV, VijayRaghavan K, Rodrigues V. Caste and sex specific olfactory glomerular organization and brain architecture in two sympatric ant species Camponotus sericeus and Camponotus compressus (Fabricius, 1798). Arthropod Struct Dev 38: 485– 497, 2009. Nakanishi A, Nishino H, Watanabe H, Yokohari F, Nishikawa M. Sexspecific antennal sensory system in the ant Camponotus japonicus: structure and distribution of sensilla on the flagellum. Cell Tissue Res 338: 79 –97, 2009. Nakanishi A, Nishino H, Watanabe H, Yokohari F, Nishikawa M. Sexspecific antennal sensory system in the ant Camponotus japonicus: glomerular organizations of antennal lobes. J Comp Neurol 518: 2186 –2201, 2010. Nielsen J, Boomsma JJ, Oldham NJ, Petersen HC, Morgan ED. Colonylevel and season-specific variation in cuticular hydrocarbon profiles of individual workers in the ant Formica truncorum. Insectes Soc 46: 58 – 65, 1999. Niessing J, Friedrich RW. Olfactory pattern classification by discrete neuronal network states. Nature 465: 47–U53, 2010. Nishino H, Nishikawa M, Mizunami M, Yokohari F. Functional and topographic segregation of glomeruli revealed by local staining of antennal J Neurophysiol • VOL
sensory neurons in the honeybee Apis mellifera. J Comp Neurol 515: 161–180, 2009. Ozaki M, Wada-Katsumata A, Fujikawa K, Iwasaki M, Yokohari F, Satoji Y, Nisimura T, Yamaoka R. Ant nestmate and nonnestmate discrimination by a chemosensory sensillum. Science 309: 311–314, 2005. Pareto A. Die zentrale Verteilung der Fühlerafferenz bei Arbeiterinnen der Honigbiene, Apis mellifera L. Cell Tissue Res 131: 109 –140, 1972. Provost E, Riviere G, Roux M, Morgan ED, Bagneres AG. Change in the chemical signature of the ant Leptothorax lichtensteini bondroit with time. Insect Biochem Mol Biol 23: 945–957, 1993. Riffell JA, Lei H, Christensen TA, Hildebrand JG. Characterization and coding of behaviorally significant odor mixtures. Curr Biol 19: 335–340, 2009a. Riffell JA, Lei H, Hildebrand JG. Inaugural Article: Neural correlates of behavior in the moth Manduca sexta in response to complex odors. Proc Natl Acad Sci USA 106: 19219 –19226, 2009b. Roces F. Olfactory conditioning during the recruitment process in a leafcutting ant. Oecologia (Berl) 83: 261–262, 1990. Roces F. Odor learning and decision-making during food collection in the leaf-cutting ant Acromyrmex lundi. Insectes Soc 41: 235–239, 1994. Ruchty M, Helmchen F, Wehner R, Kleineidam CJ. Representation of thermal information in the antennal lobe of leaf-cutting ants. Front Behav Neurosci 4: 174, 2010. Sachse S, Galizia CG. Role of inhibition for temporal and spatial odor representation in olfactory output neurons: A calcium imaging study. J Neurophysiol 87: 1106 –1117, 2002. Sachse S, Rappert A, Galizia CG. The spatial representation of chemical structures in the antennal lobe of honeybees: steps towards the olfactory code. Eur J Neurosci 11: 3970 –3982, 1999. Sandoz JC, Deisig N, de Brito Sanchez MG, Giurfa M. Understanding the logics of pheromone processing in the honeybee brain: from labeled-lines to across-fiber patterns. Front Behav Neurosci 1: 5, 2007. Singer TL. Roles of hydrocarbons in the recognition systems of insects. Am Zool 38: 394 – 405, 1998. Smith AA, Hölldobler B, Liebig J. Cuticular hydrocarbons reliably identify cheaters and allow enforcement of altruism in a social insect. Curr Biol 19: 78 – 81, 2009. Soroker V, Vienne C, Hefetz A, Nowbahari E. The postpharyngeal gland as a gestalt organ for nestmate recognition in the ant Cataglyphis niger. Naturwissenschaften 81: 510 –513, 1994. Strausfeld NJ. Organization of the honey bee mushroom body: representation of the calyx within the vertical and gamma lobes. J Comp Neurol 450: 4–33, 2002. Stroeymeyt N, Guerrieri FJ, van Zweden JS, D’Ettorre P. Rapid decisionmaking with side-specific perceptual discrimination in ants. PLos One 5: e12377, 2010. Tanaka NK, Tanimoto H, Ito K. Neuronal assemblies of the Drosophila mushroom body. J Comp Neurol 508: 711–755, 2008. van Zweden JS, D’Ettorre P. Nestmate recognition in social insects and the role of hydrocarbons. In: Insect hydrocarbons, edited by Blomquist GJ, Bagneres AG. Cambridge, MA: Cambridge Univ. Press, 2010, p. 222–243. van Zweden JS, Dreier S, d’Ettorre P. Disentangling environmental and heritable nestmate recognition cues in a carpenter ant. J Insect Physiol 55: 158 –163, 2009. Vander Meer RK, Morel L. Nestmate recognition in ants. In: Pheromone Communication in Social Insects: Ants, Wasps, Bees, and Termites, edited by Vander Meer RK, Breed MD, Espelie KE, Winston ML. Boulder, CO: Westview, 1998, p. 79 –103. Vander Meer RK, Saliwanchik D, Lavine B. Temporal changes in colony cuticular hydrocarbons of Solenopsis invicta. J Chem Ecol 15: 2115–2126, 1989. Vosshall LB, Wong AM, Axel R. An olfactory sensory map in the fly brain. Cell 102: 147–159, 2000. Wagner D, Brown MJF, Broun P, Cuevas W, Moses LE, Chao DL, Gordon DM. Task-related differences in the cuticular hydrocarbon composition of harvester ants, Pogonomyrmex barbatus. J Chem Ecol 24: 2021– 2037, 1998. Wagner D, Tissot M, Cuevas W, Gordon DM. Harvester ants utilize cuticular hydrocarbons in nestmate recognition. J Chem Ecol 26: 2245– 2257, 2000. Wagner D, Tissot M, Gordon D. Task-related environment alters the cuticular hydrocarbon composition of harvester ants. J Chem Ecol 27: 1805– 1819, 2001. Wallis DL. A comparison of the response to aggressive behaviour in two species of ants, Formica fusca and Formica sanguinea. Anim Behav 11: 164 –171, 1963.
106 • NOVEMBER 2011 •
www.jn.org
PARALLEL PROCESSING OF SOCIAL ODORS IN ANTS Wang JW, Wong AM, Flores J, Vosshall LB, Axel R. Two-photon calcium imaging reveals an odor-evoked map of activity in the fly brain. Cell 112: 271–282, 2003. Wang S, Sato K, Giurfa M, Zhang S. Processing of sting pheromone and its components in the antennal lobe of the worker honeybee. J Insect Physiol 54: 833– 841, 2008. Yamagata N, Nishino H, Mizunami M. Pheromone-sensitive glomeruli in the primary olfactory centre of ants. Proc R Soc Lond B Biol Sci 273: 2219 – 2225, 2006.
J Neurophysiol • VOL
2449
Yamagata N, Schmuker M, Szyszka P, Mizunami M, Menzel R. Differential odor processing in two olfactory pathways in the honeybee. Front Syst Neurosci 3: 16, 2009. Zube C, Kleineidam C, Kirschner S, Neef J, Rössler W. Organization of the olfactory pathway and odor processing in the antennal lobe of the ant Camponotus floridanus. J Comp Neurol 506: 425– 441, 2008. Zube C, Rössler W. Caste- and sex-specific adaptations within the olfactory pathway in the brain of the ant Camponotus floridanus. Arthropod Struct Dev 37: 469 – 479, 2008.
106 • NOVEMBER 2011 •
www.jn.org