DISTRIBUTING STEREOSCOPIC SCIENTIFIC VISUALISATION ACROSS THE GRID Stuart M. Charters, Nicolas S. Holliman and Malcolm Munro Visualisation Research Group, e-Science Research Institute, University of Durham, South Road, Durham, DH1 3LE, UK
[email protected] [email protected] [email protected] ABSTRACT An architecture that allows stereoscopic scientific visualisation to be distributed across the grid is presented. As the quantity of data generated by scientists increases so does the need for tools to analyse and interpret that data: visualisation is one such tool. The architecture presented allows resources distributed across the grid to be brought together and allows scientists to build effective stereoscopic visualisations that can provide insight and help in the understanding of the data being analysed. KEY WORDS Distributed Visualization, Scientific Visualization, Stereoscopic, Grid
1 Introduction Visualisation is becoming increasingly important for the analysis of results from science, the datasets generated by experiments and simulations are growing rapidly in size and complexity. As these datasets cannot be analysed using pencil and paper, the use of visualisation becomes the only way for scientists to gain an insight into data allowing them to explore and discover new phemonema The size of the datasets that scientists wish to analyse have grown greatly, to the order of gigabytes, terrabytes and even some of the order of petabytes. As these datasets have been growing in size, the computing power available has also been growing, however the point has been reached where these datasets have grown greater than the computing power generally available to the scientist. A solution to this is to make use of multiple computing resources, spread across the grid, to provide the computing resources required, for the duration of the visualisation without the scientist requiring the resources to be available locally. Traditional visualisation tools are designed to run on a single computer, from a desktop PC to a multi-processor supercomputer, this use of a single computer often resulted in a specialist computer being used for general purpose computing in data manipulation or a general purpose computer being used for a highly specialised task such as high
performance graphics. The machines being used for visualisation often have insufficient resources for the datasets that scientists now wish to analyse or those machines that have sufficient resources are heavily used and use of them has to be planned and booked. Some efforts have been made to adapt these tools for use on the grid [1] however it is felt that a new approach is required to exploit the grid to its full potential. An architecture is presented that allows resources on the grid to be used to form visualisation pipelines that the scientist can exercise complete control over from their desk. The distributed nature of the the pipeline means that appropriate resources can be used for each stage of the pipeline, resulting in better utilisation of specialist resources as they no longer have to perform general purpose computing and more effective use of general purpose resources as they no longer have to be used for specialist computing jobs. The result of this will be higher quality, more efficient and effective visualisations that the scientist can use from their desk as and when required.
2
Background
The Grid [2] is a term used to describe a computing infrastructure where resources such as processing, storage and high performance graphics are made available for use. The goal of the grid is to allow resources to be used by people other than the host organization through a set of standards. The use of these resources will be supported by middleware that allows for billing, security and management.
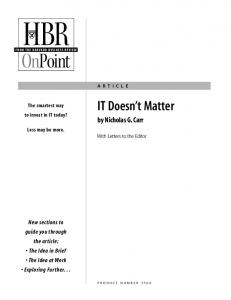
Figure 1. Haber-McNabb Visualisation Pipeline
The traditional visualisation pipeline, expressed by Haber and McNabb [3] shown in Figure 1, breaks the visualisation process down into stages. Modular visualisation
environments turn these stages into component parts of a self contained visualisation system that allows bespoke visualisations to be built by joining together these components within the system. This type of visualisation system is very widely used by the scientific community and some applications that make use of the pipeline model are reviewed to provide background to the distributed architecture presented. IRIS Explorer [4] is a modular visualisation environment widely used by the scientific community. It uses the pipeline model and provides a library of modules. These modules can be joined together using a drag and drop interface to form pipelines. The application typically runs on a single computer although extensions to allow it to be used in a collaborative manner have been developed [5]. AVS [6] have developed a family of visualisation products following the modular visualisation environment structure. These products are targeted at different market sectors but all make use of the same general principals. SciRun [7] described as a problem solving environment and developed by the university of Utah again makes use of the modular visualisation environment structure.
2.1
Grid Visualisation Projects
The gViz [1] project is aiming to Grid enable IRIS Explorer [4] by allowing individual modules in the visualisation pipeline to be run on remote grid resources. The nature of the solution means that users remain tied to IRIS Explorer and are unable to make use of modules from outside the environment. The RealityGrid project [8] uses visualisation as part of a bespoke application for visualising the output of simulations run on the grid. RealityGrid makes use of the ICENI [9] framework which has services for data and visualisation with each user running a client and a central co-ordination server managing the visualisation. The framework uses a pull data model with data being transferred by GridFTP [10].
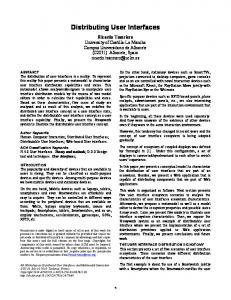
3 Proposed Distributed Architecture The proposed architecture developed for distributing stereoscopic scientific visualisation across the grid uses as a basis the traditional visualisation pipeline as shown in Figure 1 and disrupts its structure by breaking the links between each stage of the visualisation, introducing elements of grid computing and separating the render and presentation stages of the pipeline to allow for remote rendering of the visualisation, as shown in Figure 2. Each of these stages, as in the modular visualisation environments, is developed as a separate component. These components can then be linked together to form visualisation pipelines. In the architecture each of the components is built as a web service and as such is known as a visualisation service. Using existing technology to aid in the development and de-
Figure 2. Distributed Architecture
ployment of these visualisation services allows them to use standard protocols and allows other visualisation systems to make use of the services through standard interfaces. Each of the visualisation services has a specific role in the pipeline, these are outlined below.
3.1
Pipeline Stages
The Data Service in the pipeline is responsible for delivering the raw data to the visualisation. These services can be an interface to a simple data file or complex services bringing together data from multiple sources and in a variety of formats. The Filter Service takes data and converts the format of that data if required and also reduces the size of a data stream by filtering off the content that is not required for the visualisation. Mathematical calculations and transformations of the data can also be done at this stage, for example interpolation. The Mapping Service is responsible for mapping data onto a visual representation. A metaphor, either abstract or real world is used at this stage, and the data is converted into geometry which can then be rendered. An example Mapping Service is an Isosurfacing Service, which calculates the boundary between two regions and generates a surface at that boundary. The Render Service takes the geometry of the Mapping Service and renders it as an image which can be passed to the Presentation Service The Presentation Service receives from the Render Service an image which can be displayed to the user, who may then interact with the image presented. The render and presentation stages of the pipeline may be implemented as a single service for devices where rendering can take place locally. The separation is maintained in the architecture for the purposes of flexibility and to allow remote rendering systems to be implemented. Whilst services have a nominal stage in the pipeline, no requirement on the ordering of services is enforced and
as such a pipeline may not make use of all types of service. There are two issues concerning co-ordination, that of data co-ordination and of pipeline composition. Data coordination between services is achieved through the mechanism of grid level streaming. Pipeline co-ordination is achieved through the external pipeline composition tool.
3.2
4
Use of Stereoscopic Visualisation
Steering
Communication that alters the behaviour of a service is known as steering, a term often used in relation to simulations. In the visualisation pipeline steering refers to any change made to the parameters of a service, this usually affects the output of that service. An example of steering would be a user altering the value at which an isosurface is drawn. Here the change of parameter would cause the isosurface mapping service to re-execute and to produce a new set of geometry. This geometry would then be fed to the render service which would render the changed scene and update the presentation client for the user to see the result of the change. Steering can also be used to exercise control over the pipeline, for example halting a computation that is taking too long or where it is evident that the desired result will not be achieved.
Figure 4. Perceived Depth Equation
3.3 Pipeline Composition
Figure 5. Mapping Scene Depth to Screen Depth
Figure 3. Visualisation Pipeline Composition Tool
To support distributed visualisation on the grid a mechanism to create pipelines from visualisation services is required. A composition tool, illustrated in Figure 3, has been developed which allows services registered via UDDI to be composed together into a visualisation pipeline using a drag and drop mechanism. The tool allows users to select services for their visualisation pipeline, providing information about them to help inform the use of the service.
The power of visualisation can be increased for many scientists if they have the ability to view their datasets using stereoscopic images. This allows the scientist to see the visualisation in three dimensions and often reveals features that may have been obscured using a standard two dimensional visualisation. To aid scientists in their use of stereoscopic images autostereoscopic displays [11] can be used. Autostereoscopic displays allow the viewer to see images in stereo without the use of glasses or other headwear thus making them especially suitable for use on the desktop. The use of autostereoscopic displays and other stereo display devices presents several challenges. Each device has differing physical properties and therefore requires the images for display on that device to be tailored in order that the perceived depth, that is how depth is seen on the display by the viewer, remains constant across different devices. The perceived depth equation in Figure 4 shows how the physical properties of the display affect the perceived depth in the viewed image.
When using autostereoscopic displays to view visualisations the depth in the visualisation must be mapped onto the depth available on the display as shown in Figure 5. Different techniques can be used for this from a simple depth reduction technique to techniques that aim to maintain depth in the region of interest whilst compressing depth outside of that area [12]. To generate correct stereo images for the display in use the rendering system must know the details of the display it is rendering for in advance of the rendering process. The requirement to know details of the display before rendering and the distributed nature of the visualisation pipeline supported by the architecture means that services must be capable of supporting late binding, and the change of services within the pipeline should a resource fail.
5
Implementation
Implementations of the architecture that have been reported previously [13] made use of grid services using Globus Toolkit 3 Alpha 2 and later Globus Toolkit 3. Following WS-GAF [14] and WS-Resource [15] the implementation was refactored to make use of standard web service technology, and to implement services as web services rather than grid services. The differing implementations brought different issues. With grid service technology much of the underlying software was still under development and liable to change making an unstable foundation for developing upon. Although the basis for grid services is web services it extends and builds upon the existing standards in such a manner that interoperability is an issue. The move to web services whilst making use of standard technology that has been in existence for some time and hence more widely adopted with more tools and general community support brought with it issues of its own. There is a significant conceptual change between grid services and web services, that of state and state ownership. Grid services allows individual instances of a service to be created and for users to interact with those services. The web service approach means that one instance of a service is deployed and it is used anonymously, progress is being made to develop standards to allow state information to be maintained within a web service such as WS-Context[16].
6
Figure 6. Case Study: X-Ray Crystallography Visualisation Pipeline
Case Study
The architecture for distributed stereoscopic scientific visualisation has been used to analyse data from the X-Ray Crystallography domain. This analysis requires a branching pipeline shown in Figure 6, using two different visualisation techniques and combining the end result which can be seen in Figure 7. The start of the pipeline is the raw data, the output from experimentation where crystals are cooled to low temperatures and X-Ray diffraction is used to take measure-
Figure 7. Example Output
ments from the crystals. The output from these experiments is in the form of a mixed format dataset containing information on the position of atoms and also the electric field strength surrounding the atoms. This dataset is then read and filtered by two Filter Services which split the dataset into its two component parts. The individual parts of the dataset are then read by separate Mapping Services: one generates a ball and stick model representation from the atom positions and a second generates an isosurface from the electric field data. The Render Service reads the output from both Mapping Services and produces a combined image that is then displayed by the Presentation Service to the user.
7
Challenges and Issues
The development of an architecture for distributed stereoscopic visualisation brings with it many interesting and varied challenges and issues, which centre on the underlying support mechanisms for service based applications on the grid. One of the main issues is that of data transport between services. With large datasets it is infeasible to transfer a whole dataset between services and for those services to perform operations on that dataset before it is transferred to the next service in the pipeline. For this reason streaming of data between services so that once a chunk of data has been processed by a service it is passed to the next service is required. Current streaming mechanisms suitable for use with services such as the Java COG HTTP Streaming implementation [17] do not support blocking I/O, the result of which is that incomplete data transfers can occur due to early end of file markers. This can result in an incomplete
visualisation or a failure of the pipeline to complete. Rendering for different stereo devices remains an open challenge. No standard for describing stereo display devices, to allow the rendering process to be configured, has been developed as yet. Each of these devices have differing properties and the desire to have a descriptive framework that is not restricted to stereo devices to allow for future extensions of the distritbuted architecture is desired. Different output devices and different network bandwidths between the render service and the presentation service mean that the output suitable for one type of device for example a PC, is not suitable for another such as a PDA. The tailoring of output between the render service and the presentation client, when to send geometry and when to send static images remains an open challenge. However the RAVE project [18] is examining this issue and results from that research will influence the development of the architecture in this area. Description of services for lookup and discovery by composition clients is an issue that will become increasingly important as more visualisation services are made available on the grid. A common description mechanism for services is required to allow the development of composition clients for visualisation. The UK visualisation community has begun work on an ontology of visualisation [19] that will assist in this area. The present implementation of the architecture makes use of web services which do not at present provide a mechanism for a context to be maintained in a service. This is an important issue when steering is used as multiple users could make use of a service, each of whom would require a separate context to hold information for their visualisation pipeline. Work is in progress to develop a standard, WS-Context [16], which will remedy this situation.
8 Future Work Future work will be to support steering within the pipeline allowing scientists to exercise control over the entire pipeline. Advanced visualisation services will also be developed to provide more options for visualisation of data. Users will also be encouraged to develop their own visualisation services and make those available to the wider community. The architecture also serves as a framework upon which collaborative visualisations can be built and this is also an area of future work.
9 Conclusion A distributed architecture for stereoscopic scientific visualisation across the grid has been presented. This architecture is designed to deal with large datasets generated by scientists from both experiments and simulations. Use of grid resources will become increasingly important as the size of datasets continues to grow and the use of visualisation in the analysis and interpretation of the datasets will also be-
come inescapable. The architecture presented allows the scientist to build visualisation pipelines for the analysis of data, from their desk, avoiding the need and expense of having local resources dedicated to the visualisation task and removing the requirement to allocate specific time to the visualisation process allowing them to work more effectively.
10
Acknowledgments
This work is funded by the EPSRC/DTI e-Demand: A Demand-Led Service-Based Architecture for Dependable e-Science Applications Project (Grant No.: THBB/C008/00112C) which is supported by Industry partners Sharp, Sun and Sparkle Technology. References [1] J. Wood, K. Brodlie, and J. Walton. gViz - visualization and steering for the grid. In Proceedings of the UK All Hands Meeting 2003, Nottingham 2003. http://www.nesc.ac.uk/events/ahm2003/AHMCD/pdf/030.pdf. [2] I. Foster and C. Kesselman, editors. The Grid: Blueprint for a New Computing Infrastructure. Morgan Kaufmann Publishers, Inc., San Francisco, USA, 1999. [3] R. B. Haber and D. A. McNabb. Visualization idioms: A conceptual model for scientific visualization systems. In G. Nielson, B. Shriver, and L. J. Rosenblum, editors, Visualization in Scientific Computing, pages 7493. IEEE, 1990. [4] NAG. http://www.nag.co.uk/welcome iec.html. IRIS Explorer. [5] M. Walkley, J. Wood, and K. Brodlie. Distributed cooperative problem solving environment. In P.M.A.Sloot, editor, Computational Science - ICCS 2002, LNCS 2329, pages 853861. Springer, 2002. [6] AVS. http://www.avs.com/. [7] SCI. SCIRun: A scientific computing problem solving environment. http://software.sci.utah.edu/scirun.html, 2002. Scientific Computing and Imaging Institute (SCI). [8] J. Stanton, S. Newhouse, and J. Darlington. Implementing a scientific visualisation capability within a grid enabled component framework. In 8th International Euro-Par Conference, volume 2400 of Lecture Notes in Computer Science, 2002. [9] N. Furmento, A. Mayer, S. McGough, S. Newhouse, and J. Darlington. Optimisation of component-based applications within a grid environment. In Supercomputing 2001, 2001. [10] Globus. GridFTP: Universal data transfer for the grid. Technical report, The University of Chicago and The University of Southern California, http://www.globus.org/datagrid/deliverables/C2WPdraft3.pdf, 2000. [11] N. S. Holliman. 3D Display Systems. In Handbook of Optoelectronics. Institute of Physics Press, to appear September 2004. ISBN 0 7503 0646 7. [12] N.
Holliman. Mapping percieved depth to regions of interest in stereoscopic images. In Stereoscopic Displays and Applications XV. SPIE and IS&T, January 2004. [13] S. M. Charters, N. S. Holliman, and M. Munro. Visualisation in e-Demand: A Grid Service Architecture for Stereoscopic Visualisation. In Proceedings of the UK All Hands Meeting 2003, 2003. http://www.nesc.ac.uk/events/ahm2003/AHMCD/pdf/161.pdf. [14] S. Parastatidis, J. Webber, P. Watson, and T. Rischbeck. A grid application framework based on web services specifications and practises. Technical report, University of Newcastle, 2003. http://www.neresc.ac.uk/wsgaf/documents.html. [15] I. Foster, J. Frey, S. Graham, and S. Tuecke. Modeling stateful resources with web services. Technical report, Globus and IBM, 2004. http://wwwfp. globus.org/wsrf/ModelingState.pdf. [16] D. Bunting, M. Chapman, O. Hurley, M. Little, J. Mischkinsky, E. Newcomer, J. Webber, and K. Swenson. Web services context. Technical report, Arjuna Technologies Ltd., Fujitsu Limited, IONA Technologies Ltd., Oracle Corporation, and Sun Microsystems Inc, 2003. http://www.arjuna.com/library/specs/ws caf 10/WSCTX.pdf. [17] G. von Laszewski, I. Foster, J. Gawor, and P. Lane. A java commodity grid kit. Concurrency and Computation: Practice and Experience, 13(8-9):643662, 2001. http:/www.cogkits.org/. [18] D. W. Walker and I. Grimstead. Resource aware visualization environment. http://www.wesc.ac.uk/projects/rave/. [19] K. Brodlie, D. Duce, and D. Duke. Visualisation ontology workshop. http://www.nesc.ac.uk/esi/events/393/.