Quinby, G. F. Steward, and F. Azam (2001), Heterotrophic bac- terioplankton in the Arabian Sea: Basinwide response to year- round high primary productivity, ...
Distribution and Relative Quantification of Key Genes Involved in Fixed Nitrogen Loss From the Arabian Sea Oxygen Minimum Zone Amal Jayakumar Department of Geosciences, Princeton University, Princeton, New Jersey, USA
S. Wajih A. Naqvi National Institute of Oceanography, Council of Scientific and Industrial Research, Dona Paula, India
Bess B. Ward Department of Geosciences, Princeton University, Princeton, New Jersey, USA
The Arabian Sea (AS) oxygen minimum zone (OMZ) is one of the largest pelagic low-oxygen environments in the open ocean. It is responsible for the removal of up to 60 Tg of nitrogen annually, roughly an eighth of the global fixed nitrogen sink. Although denitrification has long been believed to be the major process responsible for fixed nitrogen loss from the oceans, recent studies show that anaerobic ammonium oxidation (anammox) is potentially a more important process involved. We have investigated the phylogeny of both anammox and denitrifying microbes in the AS, and here we report on their diversity in terms of their characteristic genes. Denitrifiers were targeted using nirS and nirK genes and anammox bacteria with the 16S rRNA gene. The nirK gene was amplified from all the samples, but nirS gene could only be detected when nitrite was present. The distribution of phylotypes was related to the concentration of nitrite and the apparent stage of denitrification. Most nirK or nirS genes from the AS had low identities with other published sequences. The closest identities were to sequences from other water column denitrifying environments rather than sedimentary or terrestrial environments. Phylogenetic analysis of the nirS and nirK genes revealed overall lower diversity than the very high diversities reported from estuarine and sedimentary environments. 16S rRNA partial gene sequences revealed very limited diversity among anammox sequences. All the anammox sequences were ≥98% identical to each other and were similar to sequences from other marine and water column environments, which are distantly related to Scalindua sp. Quantification
Indian Ocean Biogeochemical Processes and Ecological Variability Geophysical Monograph Series 185 Copyright 2009 by the American Geophysical Union. 10.1029/2008GM000730 187
188 DISTRIBUTION AND RELATIVE QUANTIFICATION OF KEY GENES
using quantitative polymerase chain reaction assays showed that both nirS genes and anammox 16S rRNA genes were more abundant at depths with higher nitrite concentrations. The presence and abundance of genes indicative of both processes suggest that both canonical denitrification and anammox likely occur in the OMZ of the AS. However, the abundance of the nirS gene, one of the genes responsible for canonical denitrification, was an order of magnitude higher than the abundance of the anammox 16S gene, indicating that denitrifiers are numerically dominant in this environment. The greater diversity of nirS and nirK genes relative to anammox genes both among and within stations also suggests that the denitrifier assemblages are more dynamic in response to environmental conditions. 1. Introduction Nitrogen is a key element in biological processes and is often limiting in marine ecosystems. This essential nutrient is efficiently recycled within ecosystems, and fresh input occurs mainly through nitrogen fixation. Oceans lose >400 Tg N of fixed nitrogen every year, mainly in low-oxygen environments [Codispoti, 2007]. Low-oxygen pelagic environments are responsible for ~35% of the marine-fixed nitrogen loss through microbially catalyzed reductive processes [Codispoti, 2007] and are hot spots for intense turnover of nitrous oxide, a potent greenhouse gas. The oxygen minimum zones (OMZ) contain a large volume of water with oxygen levels marginally above 1 µM, the threshold value thought to induce dissimilatory nitrate reduction [Naqvi et al., 2003; Codispoti et al., 2005]. Minor perturbations of the delicate balance between oxygen consumption and supply caused by, for example, an increase in organic matter loading may result in large changes in the fixed N loss. Such shifts might occur through global warming-induced changes in circulation patterns or via input of excess nitrogen or organic carbon resulting from fertilizer runoff or atmospheric deposition [Duce et al., 2008]. The Arabian Sea (AS) OMZ is one of the largest OMZs in the open ocean and alone could be responsible for the removal of up to 60 Tg of nitrogen annually [Codispoti, 2007]. The region is distinguished by very low dissolved oxygen (DO) concentration at depths between 150 and 1200 m, especially east of 60oE and north of 12oN. Nitrogen transformations appear to be most intense between 150 and 600 m. In this zone, net loss of combined nitrogen occurs on a perennial basis, as indicated by the persistent presence of a broad secondary nitrite maximum (SNM) and large fixed N deficits [Naqvi, 1991]. Microorganisms capable of denitrification and anaerobic ammonium oxidation (anammox) both convert oxidized forms of nitrogen to gaseous species and thereby cause net fixed N loss. The relative importance of anammox and conventional denitrification in the removal
of fixed nitrogen in the AS is not known. There have been no systematic studies in this region targeting the distribution, diversity, and abundance of organisms capable of these conversions. Knowledge of the diversity, distribution, and relative abundance of denitrifiers and anammox bacteria will help to determine what mechanisms are responsible for the observed net nitrogen deficits. Such knowledge is also essential for understanding microbial community structure and its dynamics in natural assemblages, as well as the response of microbes to environmental factors. It is also not known how the denitrifying and anammox communities in the OMZ of the AS are related to their counterparts in similar environments elsewhere, such as OMZs in the eastern tropical North and South Pacific. If each OMZ harbors a unique microbial assemblage, community composition might be related to differences in N transformations and fluxes in the different OMZs. The key step in the denitrification process is the reduction of nitrite, which is the rate-limiting step in the transformation of nitrate to dinitrogen gas [Zumft, 1997], since the downstream products are gases that cannot be readily assimilated. Nitrite reduction is carried out by two enzymes, one that requires copper and is encoded by the gene nirK, and one that requires iron and is encoded by the gene nirS. The two enzymes apparently are functionally and physiologically equivalent [Zumft, 1997]. The nirK gene from Pseudomonas auerofaciens can be expressed in a mutant of Pseudomonas stutzeri that lacks the nirS gene [Glockner et al., 1993], but the two enzymes do not usually occur in the same organism. Denitrifying bacteria are taxonomically diverse and are found in over 50 genera. The nitrite reductase genes appear to have spread by horizontal gene transfer, as their phylogeny is not congruent with that of the 16S rRNA genes [Song and Ward, 2003]. Therefore, a 16S rRNA-based approach to studying the diversity of microbial assemblages does not provide reliable information on their denitrification capabil-
JAYAKUMAR et al. 189
ity. The nirS gene is found nearly exclusively in proteobacteria, but recently has been reported from planctomycetes [Strous et al., 2006], while the nirK gene has been reported from many diverse and unrelated taxa [Zumft, 1997]. There is minimal information available on functional genes for anammox, but 16S rRNA reliably differentiates this unique functional group [Schmid et al., 2005]. Here we present data on the diversity, distribution, and abundance of the two marker genes, nirS and nirK, for denitrifying organisms and the 16S rRNA genes for anammox, in order to evaluate their involvement in the major pathways for the removal of fixed nitrogen from the OMZ of the AS. 2. Materials and Methods Samples were collected on board ORV Sagar Kanya from five stations during two cruises, SK208 and SK209, in August– September 2004 (Figure 1). The maximum water column depth at stations 1, 2, and 23 was 2000–4000 m, while station K03 was 40 m and station 17 was 65 m deep, respectively. Samples for nutrients and DNA analysis were collected using a Sea-Bird Electronics conductivity-temperature-depth (CTD)-rosette sampling system, Model SBE 9, fitted with Niskin/Go-flo bottles. Nutrients were analyzed using a SKALAR autoanalyzer following standard methods [Grasshoff et al., 1983] and DO was estimated using the Winkler method [Carpenter, 1965]. For DNA analysis, 5–10 L of seawater
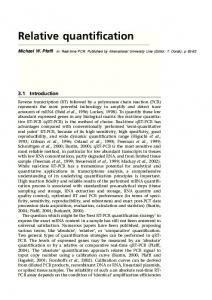
Figure 1. Station locations for Sagar Kanya cruise SK208 and SK209 September–October 2004. K03 is offshore of Karwar, G8 and V4 are station locations from the previously published coastal study [Jayakumar et al., 2004]. Contour line encloses the region in the Arabian Sea (AS) where nitrite concentrations exceed 0.5 µM within the OMZ region [Naqvi, 1991].
was filtered onto Sterivex capsules (0.2 µm pore size, Millipore, Inc., Bedford, MA, USA) with a peristaltic pump, quick frozen in liquid nitrogen and stored at −80°C until the DNA could be extracted. DNA analyses are reported for samples from the SNM for the open-ocean locations. The sampling depth was determined after a quick analysis of the depth distribution of nitrite concentration in the water column from an initial cast. For the coastal stations, DNA samples were collected from the depth at which the DO was low; nitrite was not present at the sample depth at either coastal location. DNA extraction, polymerase chain reaction (PCR) amplification, and clone library construction methods for nirS gene [Jayakumar et al., 2004] and nirK gene [Santoro et al., 2006] have been described previously. Anammox 16S rRNA genes were amplified using primers AMX368F and AMX820R [Schmid et al., 2003]. Clones were selected randomly from the clone libraries and amplified using T7M13 primers. The products were used as templates for cycle sequencing from both ends with Big DyeTM V.3.1 terminator chemistry (Applied Biosystems) with the same primers using an ABI 310 or ABI3100 Genetic Analyzer (Applied Biosystems). Sequences were edited using Sequencher 4.1TM (Genetic Codes) and assembled. Assemblies of 16S rRNA anammox genes and translated amino acid sequences for nirS and nirK genes were then aligned using ClustalX [Thompson et al., 1997]. Neighbor-joining trees were produced using distance matrix methods (PAUP 4.0, Sinauer Associates), and the reliability of the phylogenetic reconstructions (1000 replicates) was evaluated by bootstrapping. For descriptive purposes, nirS and nirK gene clusters were identified as groups containing sequences with >90% identity at DNA level, although some clusters contained slightly more divergent sequences, and cluster designations are therefore somewhat subjective at a few branch points. The clone numbering includes the station number as the prefix, and depth is not specified in the clone name because data from only one depth per station are reported. Analytical rarefaction 1.3TM software [Holland, 2001] was used to compute the rarefaction statistics [Heck et al., 1975]. nirS and nirK operational taxonomic units (OTUs) were defined as DNA sequences >90% identical. nirS data from stations G8 and V4 (Figure 1) from a previous study in the coastal AS [Jayakumar et al., 2004] have been included for comparison with data from the open-ocean environment. OTUs for 16S rRNA sequences were defined at 2% difference in identity. Anammox 16S rRNA partial gene sequences reported previously [Jayakumar et al., 2009] are included in the larger environmental data set analyzed here. The sequences reported in this study have been deposited in GenBank under the following accession numbers: nirK, FJ596039–FJ596098; nirS, FJ596099–FJ596141.
190 DISTRIBUTION AND RELATIVE QUANTIFICATION OF KEY GENES
DNA was quantified using PicoGreen (Molecular Probes), and quantitative PCR (QPCR) analyses were performed on an Mx3000p real-time PCR system (Stratagene) using a QuantiTect SYBR Green PCR master mix kit (Qiagen). Three gene fragments were quantified: total nirS (Tot nirS), a nirS gene sequence that was dominant in the station 1 clone library (Dom nirS) [Jayakumar et al., 2009], and a fragment of the anammox16S rRNA gene. DNA from the environmental samples, negative controls and standards were all run in triplicate in the same QPCR assay. Standards were prepared by amplifying a constructed plasmid containing the respective gene. Both Tot nirS and Dom nirS regions are present in the cloned fragment obtained with primers nirS1F and nirS6R [Braker et al., 1998]. The same anammox 16S rRNA gene fragment used for phylogenetic analysis, obtained with the primers AMX 368F and AMX820R, was used to construct the standard plasmid for anammox. Standard curves were used to determine the copy number of Tot nirS/Dom nirS/anammox 16S rRNA genes. Standard curves were quite reproducible, and results were included only from replicate assays that yielded reproducible standard curves. All assays used the same annealing temperature, 62 oC, and were performed on the same plates to maximize reproducibility. To quantify Tot nirS gene, primers nirS1F and nirS3R (100 pM) [Braker et al., 1998] were used to target a 260-bp conserved region within the nirS1F-nirS6R region. For Dom nirS, primers (50 pM) targeted a different 280-bp region that was conserved only within the dominant nirS clone sequences (forward primer nirSASDom30F 5′-CGATGGTCTTACGCTCGAGCC-3′; reverse primer nirSASDom310R 5′-GAGATCGACGATCACCATCG-3′). Clones representing all clusters from total nirS phylogeny were tested to verify the specificity of the Dom nirS primers. Primer concentrations for the QPCR assays were optimized, and specificity of the QPCR for the production of only one product was assured by performing a melting curve analysis at the end of 40 cycles. Gel electrophoresis of the QPCR products further confirmed that only one product of the right size was amplified. nirS, nirK, and anammox amplifications for clone library construction and QPCR were all done from the same DNA samples for each location. Clone library analysis using primers AMX 368F and AMX820R detected only anammox 16S rRNA gene sequences, confirming that the QPCR analysis was also specific for anammox bacteria. 3. Results and Discussion 3.1. Hydrography of the Region The AS is enclosed by land on three sides. Its unusual circulation pattern and large supply of organic material from
the productive surface waters combine to produce an intense and perennial OMZ. High primary productivity in the AS occurs during both the NE and SW monsoon seasons [Barber et al., 2001]. The sinking and decomposition of the locally produced and laterally advected organic carbon from the highly productive upwelling regions culminates in excessive consumption of DO and its near depletion at midwater depths (Figure 2) [Naqvi et al., 2003]. The classical Winkler method is not sufficiently sensitive to determine the exact concentration of DO in these waters. However, a more sensitive colorimetric method suggests that DO concentrations are 50%) are indicated at the branch points. Names of 16S rRNA clones from the present study are in bigger font and marked with asterisks, Station 1, *; station 2, **; station 23, ***; and those sequences from other oceanic environments and published databases are in smaller font.
JAYAKUMAR et al. 199
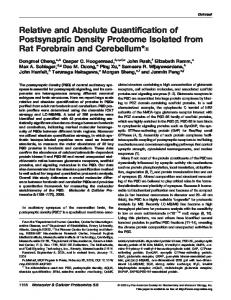
freshwater environments using various primer combinations have failed to amplify other novel anammox organisms. The sequences presented here and from other marine and fresh water environments [Schmid et al., 2007] show the ubiquitous presence of anammox bacteria, but suggest low diversity of these organisms in suboxic/anoxic marine ecosystems. 3.5. Rarefaction Analysis Rarefaction analysis showed that nirS gene richness was similar in all three open-ocean clone libraries (Figure 4a) and the libraries saturated at about nine phylotypes. nirK gene rarefaction curves were quite different among stations (Figure 4b). The richness at stations 1 and K03 appear to be saturated, while at stations 2, 17, and 23, more sequencing effort will likely detect more novel sequence types. To compare the richness between the open-ocean and coastal AS, the sequences for each gene type were grouped as either coastal or open ocean. By this analysis, nirS gene communities were much richer in the coastal environment than in the open ocean (Figure 4c). Total richness was not as dramatically different between open-ocean and coastal stations for nirK gene (Figure 4d), but the extrapolation of the curves implies greater richness in libraries from the coastal environment. Because very little diversity was detected in the anammox 16S rRNA gene sequences of the open AS, a 1% cutoff was used to investigate the degree of small-scale variability in the sequence distribution (Figure 4e). If 98% similarity for the 16SrRNA gene delineates a genus, then the data shown here indicate that there is some species level diversity in the AS anammox assemblage. However, there was no definite pattern with respect to their distribution among the locations, and richness was more or less saturated at all three locations. 3.6. Quantification of nirS and Anammox Genes Total nirS gene copy numbers ranged from 1.9 to 5.6 × 10⁵ ml−1 of seawater, with highest numbers at station 1 (Figure 5), assuming 100% efficiency in DNA extraction. Total nirS, Dom nirS, and anammox 16S rRNA gene copy
Figure 4. (opposite) Rarefaction curves. Ten percent difference in DNA sequences was the cutoff limit for defining an OTU for nirS and nirK; 1% for anammox 16S rRNA OTUs. (a) nirS sequences from the open AS (three stations). (b) nirK sequences from AS (five stations). (c) nirS sequences grouped by open ocean (three stations) and coastal ocean (two stations). (d) nirK sequences grouped by open ocean (three stations) and coastal ocean (two stations). (e) Anammox 16S rRNA sequences from the open AS (three stations).
200 DISTRIBUTION AND RELATIVE QUANTIFICATION OF KEY GENES
tuted between 0.4% and 1.5% of the total cell count. The cell numbers and relative abundance of anammox as a percent of the total appear to be higher (10–12%) in the AS than in the other OMZ environments for which comparable data are available. 3.7. Ecology of Denitrification and Anammox
Figure 5. Abundance of nirS and anammox genes. Total nirS genes, Dom1 nirS genes, and anammox 16S rRNA genes at three stations from cruise SK209 (October 2004) determined by quantitative polymerase chain reaction. Error bars represent standard deviations of three to six replicate assays for each gene.
numbers all varied in similar patterns among stations: all three were more abundant, by a factor of ~2, at the two stations (1, 23) with highest nitrite concentrations. Anammox 16S rRNA gene copy number was highest at station 1 (84,398 ml−1) but always was