Aug 22, 2018 - field; and (3) at a critical value, anomalous resistivity is activated ... below) of the low-resolution off-limb coronal channel of ... Astronomy for the DKIST, which will see first light early in ... Boundaries: x and y .... time of 22.9 s) from left to right in the image plane, resulting in .... The mosaic tile is located in the.
The Astrophysical Journal, 863:172 (13pp), 2018 August 20
https://doi.org/10.3847/1538-4357/aad3bc
© 2018. The American Astronomical Society.
Predictions of DKIST/DL-NIRSP Observations for an Off-limb Kink-unstable Coronal Loop B. Snow1,2,3
, G. J. J. Botha2, E. Scullion2 1
, J. A. McLaughlin2
, P. R. Young2,4,5, and S. A. Jaeggli6
School of Mathematics and Statistics, University of Sheffield, S3 7RH, UK 2 Northumbria University, Newcastle upon Tyne, NE1 8ST, UK 3 University of Exeter, Exeter, EX4 4QF, UK 4 NASA Goddard Space Flight Center, Greenbelt, MD 20771, USA 5 George Mason University, Fairfax, VA 22030, USA 6 National Solar Observatory, 8 Kiopa‘a St. Suite 201, Pukalani, HI 96768, USA Received 2018 April 3; revised 2018 July 12; accepted 2018 July 12; published 2018 August 22
Abstract Synthetic intensity maps are generated from a 3D kink-unstable flux rope simulation using several DKIST/ DL-NIRSP spectral lines to make a prediction of the observational signatures of energy transport and release. The reconstructed large field-of-view intensity mosaics and single tile sit-and-stare high-cadence image sequences show detailed, fine-scale structure and exhibit signatures of wave propagation, redistribution of heat, flows, and finescale bursts. These fine-scale bursts are present in the synthetic Doppler velocity maps and can be interpreted as evidence for small-scale magnetic reconnection at the loop boundary. The spectral lines reveal the different thermodynamic structures of the loop, with the hotter lines showing the loop interior and braiding and the cooler lines showing the radial edges of the loop. The synthetic observations of DL-NIRSP are found to preserve the radial expansion, and hence the loop radius can be measured accurately. The electron number density can be estimated using the intensity ratio of the Fe XIII lines at 10747 and 10798 Å. The estimated density from this ratio is correct to within ±10% during the later phases of the evolution; however, it is less accurate initially when lineof-sight density inhomogeneities contribute to the Fe XIII intensity, resulting in an overprediction of the density by ≈30%. The identified signatures are all above a conservative estimate for instrument noise and therefore will be detectable. In summary, we have used forward modeling to demonstrate that the coronal off-limb mode of DKIST/ DL-NIRSP will be able to detect multiple independent signatures of a kink-unstable loop and observe small-scale transient features including loop braiding/twisting and small-scale reconnection events occurring at the radial edge of the loop. Key words: magnetohydrodynamics (MHD) of a kink-unstable flux rope via forward modeling using the off-limb coronal mode of the forthcoming Daniel K. Inouye Solar Telescope (DKIST)/Diffraction Limited Near Infrared Spectropolarimeter (DL-NIRSP) instrument. The noneruptive kink instability has been used to trigger reconnection in numerical simulations of cylindrical coronal loops (Browning et al. 2008; Botha et al. 2011; Gordovskyy et al. 2016; Pinto et al. 2016). The general process is as follows: (1) a magnetic field is specified that is unstable to the ideal kink instability; (2) the simulation is allowed to evolve, ideally resulting in an increase in the twist of the magnetic field; and (3) at a critical value, anomalous resistivity is activated and the reconnection occurs at current sheets, producing local temperature increases and flows and reducing the overall twist present in the simulation. The majority of the heating is a result of shock heating, as opposed to ohmic heating (Bareford & Hood 2015; Bareford et al. 2016). Localized heating is conducted away from reconnection sites parallel to magnetic field lines through thermal conduction, reducing the peak temperatures obtained in the loop (Botha et al. 2011). To accurately compare simulation results to observations and predict signatures of events, it is necessary to apply forward modeling. This is a process whereby the numerical data is converted into observables such as line-of-sight (LOS) integrated intensity and Doppler velocities. For coronal phenomena, the plasma is usually assumed to be optically thin
1. Introduction One mechanism capable of producing the high temperatures observed in the solar corona is nanoflares, where a cascade of reconnection events releases magnetic energy, leading to heating (Parker 1988). Such heating events are assumed to be the result of reconnection occurring in tangled or twisted magnetic fields (e.g., Parker 1988; Hood et al. 2009; Bareford & Hood 2015). The origin of twisted coronal fields is thought to be due to photospheric convective/shearing motions that propagate into the corona due to the relatively long coronal diffusion times, resulting in magnetic reconnection (Parker 1988; Pariat et al. 2015; Kumar et al. 2017). Alternatively, twisted flux can emerge from below the photosphere (Ishii et al. 1998; Cheung & Isobe 2014; Takasao et al. 2015). These twisted magnetic structures are susceptible to instabilities, such as the kink instability, whereby magnetic energy is released, creating pressure gradients, flows, and local temperature increases. However, convincing evidence of nanoflares and small-scale reconnection events remains elusive in observations from current ground-based and space-borne instruments (Parnell & De Moortel 2012). In this paper, we consider the observational signatures of energy transport from a simulation Original content from this work may be used under the terms of the Creative Commons Attribution 3.0 licence. Any further distribution of this work must maintain attribution to the author(s) and the title of the work, journal citation and DOI.
1
The Astrophysical Journal, 863:172 (13pp), 2018 August 20
Snow et al. Table 1 Spatial Properties of DL-NIRSP
Property Focal ratio Plate scale [arcsec mm–1] BiFOIS FOV width×height [arcsec] Maximum FOV [arcsec] Instrument spatial sampling [arcsec]
High-Resolution
Mid-Resolution
Wide-field
f/62 0.832 2.40×1.80 120 0.03
f/24 2.15 6.19×4.64 120 0.077
f/8 6.45 18.6×27.8 120 0.464
and, as such, only in emission. This results in the observable intensity and Doppler velocity being a function of temperature, density, and velocity from the numerical simulations. This methodology has been applied to the synthesis of the observational signatures of various solar phenomena (e.g., Verwichte et al. 2009; Peter & Bingert 2012; De Moortel et al. 2015; Snow et al. 2015; Mandal et al. 2016; Yuan & Van Doorsselaere 2016; Snow et al. 2017). Synthetic observables using several SDO/AIA and TRACE broadband EUV filters reveal the general twisted structure of a kink-unstable loop (Botha et al. 2012; Srivastava et al. 2013), and there are several signatures of energy release and transport when observing through various Hinode/EIS lines (Snow et al. 2017). However, the forward modeling does not show clear signatures of nanoflares or sites of small-scale reconnection, even when they are present in the numerical simulation. This is because the spatial and temporal degradation for these instruments results in small-scale, transient features becoming averaged out and is not visible in the synthetic observables. In this paper, the forward modeling of a 3D numerical simulation of a noneruptive kink-unstable flux rope is performed using the spectral lines of the coronal off-limb mode of DKIST/DL-NIRSP. Intensity and Doppler maps are generated, and the results are compared to the simulation. Both the mosaic and sit-and-stare observing modes (see Section 5 below) of the low-resolution off-limb coronal channel of DKIST/DL-NIRSP are investigated. The signal-to-noise ratio (S/N) and photon rates are estimated for the different spectral lines to ensure the observability of the results. This allows us to make a prediction of the observational signatures of the offlimb coronal mode of DKIST/DL-NIRSP.
Table 2 Initialization in the Numerical Simulation Temperature Density Electron number density
0.125 MK 1.67×10⁻¹² kg m−3 109 cm−3
Loop length Loop radius
80 Mm 4 Mm
Magnetic field Inside loop Outside loop Twist Numerical grid: x axis y axis z axis Cell: δx=δy δz Boundaries: x and y z
20 G maximum 15 G uniform 0 at axis and loop edge 11.5π at radius 1 Mm [−8 Mm, 8 Mm ] [−8 Mm, 8 Mm ] [0, 80 Mm ] 0.125 Mm 0.3125 Mm Reflective Line-tied
3. Computational Model and Loop Evolution The 3D numerical simulation was performed by Botha et al. (2011) using Lare3d (Arber et al. 2001), solving the resistive magnetohydrodynamic (MHD) equations with Spitzer–Härm thermal conductivity acting parallel to magnetic field lines. The initial conditions of the simulation are based on the observation of Srivastava et al. (2010). The loop is initialized as a straight cylinder with aspect ratio 10 (Table 2) and a force-free magnetic field that is unstable to the ideal MHD kink instability. The initial magnetic field twist is above the critical numerical stability limit of 4.8π (Mikić et al. 1990). The initial temperature and density are uniform with the values given in Table 2, and the initial electron number density ne is obtained assuming quasi-neutrality. The numerical domain is a Cartesian box with the loop axis along the z direction. The x and y boundaries are far enough from the loop’s radial edge not to influence the results. The z boundary condition at the loop footpoints has no velocity component across it and has constant density and temperature values fixed at their initial values. A temperature gradient is allowed so that heat flows across the boundary. Full details of the numerical model can be found in Botha et al. (2011). The time evolution of the kink instability can be separated into two phases: a linear phase, during which current sheets form and grow, and a nonlinear phase (starting at time t = 261 s), where reconnection occurs in current sheets. This reconnection releases magnetic energy, causing localized heating and the straightening of magnetic field lines. The local heating results in pressure gradients that act to drive flows along magnetic field lines, while thermal conduction acts to
2. Instrument Information The DL-NIRSP is an imaging spectropolarimeter currently under development by the University of Hawai‘i’s Institute for Astronomy for the DKIST, which will see first light early in 2020. The DL-NIRSP will have the unique ability to obtain high-cadence spectropolarimetric measurements of small fields of view through the use of a bidimensional fiber-optic image slicer (BiFOIS). The DL-NIRSP will support disk, limb, and off-disk coronal observations of up to three simultaneous wavelength regions in the visible and near-infrared. The selected diagnostic lines are targeted at making multi-height magnetic field measurements and are planned to include Fe XI 7892, Ca II 8542, Fe XIII 10747, He I 10830, Si X 14300, and Fe I 15650 Å. The DL-NIRSP feed optics provide three different resolution modes: high-resolution f/62, mid-resolution f/24, and widefield f/8. The first two modes are suitable for disk and limb observations, while the wide-field mode is primarily for coronal observations. Details of the spatial properties of DL-NIRSP are given in Table 1. 2
The Astrophysical Journal, 863:172 (13pp), 2018 August 20
Snow et al.
Table 3 Spectral Information for the Different Spectral Lines Spectral Line Fe X Fe XI Si X Fe XIII Fe XIII Ar XIII Ca XV
Air Wavelength (Å)
Temperature Peak (log(T))
6375 7892 14300 10747 10798 10140 5695
6.05 6.15 6.15 6.25 6.25 6.45 6.65
Note. Fe XI, Fe XIII, and Ca XV are used in this paper. The wavelengths are given as their rest values in air.
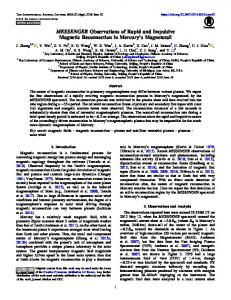
equalize the temperature inside the loop. A full description of the physics during the time evolution is given in Botha et al. (2011). Figure 1. Contribution functions for the synthesized spectral lines.
4. Forward Modeling and Line Synthesis function for several lines that were initially considered for DKIST/DL-NIRSP but are not included in the current specification. The DKIST/DL-NIRSP will observe the three coronal lines of Fe XI, Fe XIII, and Si X at first light. The results from the Si X line are very similar to those from the Fe XI line, as the two lines are formed at the same temperature, so they are not shown here. The Fe XI line also has a higher predicted photon rate than the Si X line; see Section 5.4. Instead, we present the observables from the Ca XV line, a previously considered line that was omitted in the respecification. This activates at a higher temperature than the Fe XI and Fe XIII lines and therefore shows different thermal structures. We believe there is a significant benefit to including this line in future respecifications of DKIST/DL-NIRSP. Note that the Ca XV line will be observed using the DKIST/VISP instrument. The wide-field mode of DKIST/DL-NIRSP is used for this paper; see Table 1. Each mosaic tile focuses on off-limb observations of coronal lines and has a sampling size of 0 464 and a field of view (FOV) of 18 6×27 8. The medium- and high-resolution channels are targeted at bright chromospheric and photospheric regions on the solar disk and would require longer exposure times in the corona; they are therefore less useful for this study, where we consider the dynamic signatures of a coronal flux rope. In this study, we use conservative estimates for the spatial resolution (0 464) and exposure time (22.9 s). Under good instrumental and atmospheric scattered-light conditions, far higher spatial and temporal resolution will be possible. This paper presents results using fairly pessimistic values of the scattered light in order to assess a low-quality observation of a kink-unstable coronal loop using DKIST/DL-NIRSP. In this way, we identify a minimum threshold that will be detectable. Various observational signatures of this event are described, and the observability is tested by consideration of the S/N and photon rates.
The simulation of the kink-unstable coronal loop has been used previously to generate observational images for TRACE 171 Åand SDO/AIA (Botha et al. 2012; Srivastava et al. 2013), as well as for Hinode/EIS (Snow et al. 2017), in order to investigate the signatures of energy release and transport during the evolution of the nonlinear phase of the kink instability. In this paper, we follow a similar approach for DKIST/DL-NIRSP, where the synthetic intensity is calculated according to I=
ò ne2 C (T ) dl,
(1 )
where ne is the electron number density, C(T) is the contribution function, T is the temperature, and dl is the unit length along the LOS. This formula uses the optically thin assumption, whereby it is assumed that the plasma is entirely in emission. This assumption is valid for coronal temperatures such as those studied here. The electron density ne is provided by the numerical simulation using the assumption of quasineutrality, and the contribution functions C(T) are synthesized using CHIANTI v8. The emission is then integrated along the LOS to produce 2D intensity maps for the different spectral lines. The signal is spatially integrated to the instrument pixel size and temporally integrated to the instrument exposure time. The contribution functions from several spectral lines that can be observed using DKIST/DL-NIRSP have been synthesized using CHIANTI v8 (Dere et al. 1997; Del Zanna et al. 2015). Spectral information about these lines is given in Table 3. The contribution functions were synthesized using the initialization density for the simulation. The effect of density on these contribution functions was found to be negligible for the intensity and Doppler maps. For the density diagnostic investigated in Section 5.3, the contribution functions were resynthesized in each simulation cell using the local density and temperature values. Note that photoexcitation from the photospheric radiation field is omitted in the line synthesis, since it was found to be negligible for the considered spectral lines. In this paper, we investigate the observational signatures using the Fe XI (7892 Å), Fe XIII (10747 Å), and Ca XV (5695 Å) spectral lines, covering a large thermal range of the loop. The contribution functions for these lines are shown in Figure 1. Note that the plot also contains the contribution
5. Results We consider two types of image sequence: mosaic and sitand-stare. For the mosaic configuration, three tiles (18 6×27 8) are scanned sequentially (with an exposure time of 22.9 s) from left to right in the image plane, resulting in 3
The Astrophysical Journal, 863:172 (13pp), 2018 August 20
Snow et al.
Figure 2. Contour of the intensity of the loop at time t=261 s using the Fe XIII (10747 Å) spectral line. The four black lines mark the edges of the three mosaic tiles investigated in this section.
a larger effective FOV (55 7×27 8), and this mosaic image sequence is repeated, resulting in an effective mosaic cadence of 69 s. In the sit-and-stare mode, a single mosaic tile is observed repeatedly without moving in the image plane, resulting in a higher-cadence image sequence but with a reduced effective FOV (18 6×27 8).
We consider three tiles, each with an FOV of 18 6×27 8, referred to as the coronal mode of DL-NIRSP. The three-tile scan is centered on the middle of the loop, as shown in Figure 2. We will refer to these three tiles individually as the left, center, and right tiles. These tiles form a simple mosaic, with a scan sequence order of left to center to right. This sequence is suitable for this simulation, as it captures the majority of the length of the loop. The FOV does not capture the loop footpoints but instead focuses on the central part of the loop, which has much more dynamic behavior. Note that the simulation snapshot presented in Figure 2 is taken at the full numerical spatial and temporal resolution. In contrast, the tiles will be exposed with an instrumental exposure time resulting in blurring of the structures present at full numerical resolution. For example, the exposure time frames (in seconds) for the tiles for the first mosaic are 261t400 s), the bright edges of the loop have a typical photon count of ≈8000 counts s–1 pixel–1 at the line core. This is far above the noise threshold in both cases, and hence the full dynamics of this event will be observable using
Figure 12. Maximum and median photon rate (counts per second per pixel) during the evolution of the loop.
5.4. S/N and Photon Rates The synthetic intensities are used as an input to the DLNIRSP instrument performance calculator. The instrument calculation uses the telescope area, instrumental efficiency, and instrumental sampling to calculate photons per pixel per second at the detector and adds detector-dependent quantities for read noise and dark current, wavelength and pointing-dependent quantities for the average coronal continuum and sky brightness, and an instrumental scattered light that is a fixed fraction of the disk intensity. This creates a pixel-by-pixel estimation of the S/N at the peak intensity of the line profile, allowing us to test the observability of the results presented in this paper. The straight loop is projected to be a curved half loop with an apex of 25.5 Mm. Note that this is purely to simulate the observation, and the projection itself does not affect the S/N. Two values of instrumental scattered light are used, good (2.5×10⁻⁶) and bad (160×10−6), allowing us to consider the observability of the loop in a range of scattered-light conditions. These estimates for scattered light are based on the expected values for a clean condition (good) and after one week of dust buildup (bad). The total exposure time used in this paper is a combination of the camera exposure and the number of coadds (i.e., total 11
The Astrophysical Journal, 863:172 (13pp), 2018 August 20
Snow et al.
DKIST/DL-NIRSP. The photon rates are of comparable magnitudes for the other spectral lines, indicating that multithermal studies of a kink-unstable coronal flux rope will be possible. Note that these photon counts are per detector pixel, not imaging pixel. The imaging pixel consists of multiple detector pixels, and hence the photon count per imaging pixel will be significantly higher. These photon counts are also measured at the line core and could be integrated over the line to further increase the counts.
6.3. Small-scale Loop Boundary Bursts Small-scale bursts present in the Doppler velocity maps are indicative of small-scale reconnection events at the loop radial boundary as the loop expands during its evolution into the background medium. Most interesting is the observable bidirectional nature of the flows in these small-scale bursts, and we detect adjacent Doppler motions on the order of±100kms−1 at the loop radius. These occur most frequently in the Fe XIII channel (Figure 6) but also occur in the other channels, albeit less frequently. Furthermore, if this is indeed small-scale magnetic reconnection, it explains the redistribution of the energy to beyond the loop edge according to the full simulation, resulting in a larger loop width in the synthetic observable (black line) than that of the simulation width (red line), as shown in Figure 9. At the same time, the Doppler velocity bursts are less frequent in the hotter channels (such as Ca XV), and the emission in this channel is largely concentrated (from imaging) within the middle of the loop cross-section. The ordering of the cooler line responses in the measurement of the loop edge can also be explained by the evolution of the instability; i.e., sudden loop expansion should drive a larger burst rate at the loop edge early on, followed by a reduced burst rate later as the loop system restores itself to a new equilibrium. Aside from the effects due to radial expansion of the loop, we also detect the presence of flows along the axis of the loop that evolve according to the thermal conduction timescale.
6. Discussion Here we have successfully reconstructed DL-NIRSP observables for a kink-unstable coronal loop. These diagnostics will be useful in the interpretation of the observations of such loops at first light, currently projected for 2020. We have also shown that the observed intensity structures are significantly above the noise threshold for the instrument. Next, we highlight a number of important physical observables that DL-NIRSP mosaic tiles should detect in identifying such an off-limb loop evolution. 6.1. Loop Substructure and Braiding The large FOV mosaic is capable of detecting transient features and structures present in kink-unstable coronal loops. The initial twist is captured in the first exposure of both the mosaic (Figures 3–5) and sit-and-stare intensity maps (Figure 7). The LOS Doppler motions can also be measured in these braided substructures during this evolution, with motions in the range of±30kms−1 in FeXIII near the center of the loop (Figure 6). As the loop evolves, large structures form along the loop and are identifiable in the moving mosaic intensity maps, and these structures are traceable across tiles. Fine structure is also present in these intensity maps, e.g., the braided field lines in Ca XV (Figure 5). The Ca XV line shows hot structure in the center of the loop. Fe XI and Fe XIII show the structure at the edges of the loop. This is consistent with previous results for loop oscillations whereby cooler spectral lines are more suitable for observing the edge of the loop (e.g., Antolin et al. 2016).
6.4. Energy Transport through the Loop From the light curves of Figure 8, we can detect a sequential ordering of responses in spectral lines evolving from hot lines that respond first, followed by cooler lines that respond later. This strongly indicates cooling processes in the loop after the onset of the instability leading to a redistribution of heat along the loop axis. That redistribution of heat is present in the form of large-scale motions (flows) transporting energy away from the central tile in the mosaic. We have detected this signature of energy transport in the measurement of the responses of the spectral lines between the left and right tiles relative to the center tile. The left and right panels of the loop increase in intensity before the central tile. This shows the loop heating away from the center of the loop along the axis of the loop, and this is then followed by heat conducting back toward the center again along the loop axis. Mass motions are also considered to take place during this redistribution through measurements of changes in the density along the axis, which we have calculated through taking the synthetic Fe XIII line ratios from the intensity maps.
6.2. Thermodynamic Loop Expansion The expansion (radial increase) of the loop, arising from the thermodynamic changes in the middle of the loop cross-section during the instability, is apparent in both the mosaic and sitand-stare intensity maps. It is clearest in the sit-and-stare image sequence due to the higher cadence, allowing for more image frames in this early evolution. The loop width in the sit-andstare intensity maps agrees closely with the simulation loop. The radial edge can also be estimated from these sit-and-stare intensities, as presented in Figure 9. The observed loop width (black line) is very close to the loop width of the simulation resolution intensities (red line). However, there remains a notable offset in the full simulation width measurement versus the synthetic observation loop width, in particular for relatively cooler lines, whereas the hottest lines show a better agreement with the loop edge. There is also an ordering in the spectral line formation in time, whereby the cooler Fe XI spectral line increases in width first, followed by the Fe XIII and finally the hot Ca XV. The discussion surrounding the location of the edge of a coronal loop is important in the solar physics literature, since it dictates how we understand energy deposition across loop boundaries for coronal heating.
6.5. Density Diagnostics The Fe XIII line ratios provide a good estimate of the density throughout the loop. Through integrating density along a ray passing through the simulated loop, we calculated the line intensities for the line ratio pair using the CHIANTI contribution function. From the line ratio maps, we determined the profile for the line ratio as a function of density. In this simulation, we could compare how closely matched the line ratios are in determining the density distribution along the loop with that for an isothermal atmosphere derived through CHIANTI. The estimated density is fairly accurate (±10%) during the later stages of the instability, where the system is 12
The Astrophysical Journal, 863:172 (13pp), 2018 August 20
Snow et al.
evolving slowly in the Fe XIII intensity channel. During the initial impulsive stage, the estimated density becomes less accurate and overpredicts the density by ≈30% due to contributions from LOS density inhomogeneities. Therefore, it will be possible to estimate the density using the Fe XIII pair, but the accuracy improves greatly when features remain reasonably stable in the Fe XIII intensity maps.
acknowledge STFC for IDL support, as well as support via ST/L006243/1. ORCID iDs B. Snow https://orcid.org/0000-0002-4500-9805 E. Scullion https://orcid.org/0000-0001-9590-6427 J. A. McLaughlin https://orcid.org/0000-0002-7863-624X S. A. Jaeggli https://orcid.org/0000-0001-5459-2628
6.6. Comparison to Existing Instruments Previous forward-modeling studies have been performed investigating the observational signatures of a kink-unstable coronal loop using EUV (Botha et al. 2012; Snow et al. 2017) and SXR/HXR (Pinto et al. 2016) instruments. The study presented in this paper demonstrates that DL-NIRSP is a significant advancement on current instrumentation and is able to resolve new signatures of energy release and transport in kink-unstable flux ropes; namely, the high spatial and temporal cadence of DL-NIRSP captures dynamic, small-scale events such as magnetic reconnection, interior braiding, and accurate measurement of LOS density. However, the lines used by the coronal mode of DL-NIRSP cover a fairly small temperature range that misses the temperature extremes that could be measured using HXR or EUV lines. As such, while DL-NIRSP represents a significant advance, it would have to be used in conjunction with existing instruments to capture the full thermal structure of the loop.
References Antolin, P., De Moortel, I., Van Doorsselaere, T., & Yokoyama, T. 2016, ApJL, 830, L22 Arber, T., Longbottom, A. W., Gerrard, C., & Milne, A. M. 2001, JCoPh, 171, 151 Bareford, M. R., Gordovskyy, M., Browning, P. K., & Hood, A. W. 2016, SoPh, 291, 187 Bareford, M. R., & Hood, A. W. 2015, RSPTA, 373, 20140266 Botha, G. J. J., Arber, T. D., & Hood, A. W. 2011, A&A, 525, A96 Botha, G. J. J., Arber, T. D., & Srivastava, A. K. 2012, ApJ, 745, 53 Browning, P. K., Gerrard, C., Hood, A. W., Kevis, R., & van der Linden, R. A. M. 2008, A&A, 485, 837 Cheung, M. C. M., & Isobe, H. 2014, LRSP, 11, 3 De Moortel, I., Antolin, P., & Van Doorsselaere, T. 2015, SoPh, 290, 399 Del Zanna, G., Dere, K. P., Young, P. R., Landi, E., & Mason, H. E. 2015, A&A, 582, A56 Dere, K., Landi, E., Mason, H., Fossi, B. M., & Young, P. 1997, A&AS, 125, 149 Gordovskyy, M., Kontar, E. P., & Browning, P. K. 2016, A&A, 589, A104 Hood, A. W., Browning, P. K., & van der Linden, R. A. M. 2009, A&A, 506, 913 Ishii, T. T., Kurokawa, H., & Takeuchi, T. T. 1998, ApJ, 499, 898 Kumar, P., Yurchyshyn, V., Cho, K.-S., & Wang, H. 2017, A&A, 603, A36 Mandal, S., Magyar, N., Yuan, D., Van Doorsselaere, T., & Banerjee, D. 2016, ApJ, 820, 13 Mikić, Z., Schnack, D. D., & van Hoven, G. 1990, ApJ, 361, 690 Pariat, E., Dalmasse, K., DeVore, C. R., Antiochos, S. K., & Karpen, J. T. 2015, A&A, 573, A130 Parker, E. N. 1988, ApJ, 330, 474 Parnell, C. E., & De Moortel, I. 2012, RSPTA, 370, 3217 Peter, H., & Bingert, S. 2012, A&A, 548, A1 Pinto, R. F., Gordovskyy, M., Browning, P. K., & Vilmer, N. 2016, A&A, 585, A159 Snow, B., Botha, G. J. J., & Régnier, S. 2015, A&A, 580, A107 Snow, B., Botha, G. J. J., Régnier, S., et al. 2017, ApJ, 842, 16 Srivastava, A. K., Botha, G. J. J., Arber, T. D., & Kayshap, P. 2013, AdSpR, 52, 15 Srivastava, A. K., Zaqarashvili, T. V., Kumar, P., & Khodachenko, M. L. 2010, ApJ, 715, 292 Takasao, S., Fan, Y., Cheung, M. C. M., & Shibata, K. 2015, ApJ, 813, 112 Verwichte, E., Aschwanden, M. J., Van Doorsselaere, T., Foullon, C., & Nakariakov, V. M. 2009, ApJ, 698, 397 Yuan, D., & Van Doorsselaere, T. 2016, ApJS, 223, 24
6.7. Summary The off-limb coronal mode of the forthcoming DKIST/ DL-NIRSP instrument is capable of observing many signatures of energy release in a kink-unstable coronal loop. Notably, we observe the substructure, radial growth, smallscale Doppler bursts, and thermal structure of the loop. We are also able to estimate the LOS density using the Fe XIII pair to a reasonable degree of accuracy (±10%). The signatures demonstrate that the forthcoming DKIST/DLNIRSP instrument will provide a significant advance on current observations and will be able to provide revolutionary observations to help understand the release of magnetic energy in the solar corona. CHIANTI is a collaborative project involving George Mason University, the University of Michigan (USA), and the University of Cambridge (UK). B.S. was supported by STFC grant ST/M000826/1. P.R.Y. acknowledges funding from NASA grant NNX15AF25G. G.J.J.B., E.S., and J.A.M.
13