Volume 148 â No.8, August 2016. 44. DME Detection using LBP Features ... Diabetes added to 231,404 deaths in the US in 2007. $245 billion is the total cost of ...
International Journal of Computer Applications (0975 – 8887) Volume 148 – No.8, August 2016
DME Detection using LBP Features Ruaa Adeeb Abdulmunem Al-falluji University of Babylon Babylon, Iraq
ABSTRACT A system for detecting Diabetic Macular Edema (DME) using Optical Coherence Tomography (OCT) volumes is presented. In preprocessing stage noise removal and flattening of scans is done which is followed by Local binary pattern feature extraction. The extracted features are then classified using linear support vector machine classifier. The proposed system achieved an specificity and sensitivity of 100% and 86.67% respectively.
General Terms Pattern Recognition, Digital Image Processing, Computer Vision
Keywords Diabetic Macular Edema, Optical Coherence Tomography, DME, OCT, LBP
1. INTRODUCTION Sugar level instability is what determines the existence of Diabetes in human body. Diabetes has two types: type 1 which is insulin-dependent and type 2 which insulin independent. This critical disease is affecting many parts of the body like the Eye, Heart, Pancreas, body power and others. The scope of this project is to focus in the Eye disease specifically Retina. The sight for human is so important and with the Optical Coherence Tomography (OCT) images, the doctor can decide the status of the patient either it has disease or not. Some statistics are showing from [1] that 29.1 million of Americans in the United States are affected with diabetes, which contributes to 9.3% of the overall population. Diabetes added to 231,404 deaths in the US in 2007. $245 billion is the total cost of diagnosing the disease in the United States in 2012. With this big number of affected people and the money spent for Research and development (R&D) in this area, many algorithms are designed to detect diabetes in the early stage. Eye diseases such as Diabetic Retinopathy (DR) and Diabetic Macular Edema (DME) are the most common causes of irreversible vision loss in individuals with diabetes. DME is defined as the increase in retinal thickness within one disk diameter of the fovea center with or without hard exudate and sometimes associated with cysts[2]. Spectral Domain OCT (SD-OCT) [3] images the depth of the retina with a high resolution and fast image acquisition is an adequate tool, compared to fundus images for DME identification[4,5,6]. Automated diagnosis on OCT imaging is rather new and most of the pioneer works on OCT image analysis have focused on the problem of retinal layers or specific lesions (e.g. cysts) segmentation[7,8,9,10]. However, very few works, up to our knowledge, have addressed the specific problem of DME and its associated features detection from OCT images. In this paper we propose a solution for automated detection of DME on OCT volumes. This paper is organized as follows. Section 2 states some of the recent works done. Section 3 describes proposed methodology. Experiments and results are discussed in
Section 4. Conclusions and avenue for future directions are drawn in section 5.
2. LITERATURE REVIEW Srinivasan[11] proposed a system to classify OCT volumes as Normal, Diabetic Macular Edema (DME) or Age-related Macular Degeneration (AMD). The proposed system first denoises the image using BM3D algorithm in which transfer domain is used to enhance the sparse representation of image. Then the retinal curvature is flattened followed by Histogram of Oriented Gradients(HOG) feature extraction. The extracted features are then used as input foe linear support vector machine classifier(SVM). To test the accuracy of system the method was applied on a dataset of 45 patients, containing 15 volumes for each class i.e normal, DME and AMD. The system was able to correctly classify of 100%, 100% and 86.67% for AMD, DME and normal patients, respectively. Venhuizen used Bag of words model to classify OCT volumes [12]. To start with keypoints in each individual B-scan were detected, out of the detected keypoint salient keypoints that had high valiant gradient values were selected for futher processing. Around each selected point a 9X9 texton was extracted. To reduce the size of the extracted textons Principal Component Analysis (PCA) was applied and the size was reduced from 81 to 9. Then Kmeans clustering is applied on the extracted textons to form a dictionary. A feature vectors containing codeword occurrences histogram is then constructed to represent each Oct volume. Random Forest (RF) classifier, with a maximum of 100 trees, is then used to classify the volumes between Normal and AMD. Venhuizen used a dataset containing 326 OCT volumes and got a 0.984 Area under the curve (AUC)[13]. Local Binary Patterns (LBP) and gradient information were used by Liu for detecting macular pathology in OCT images [14]. The proposed methodology first aligns and flattens the retinal curvature of the images. A 3 level multi scale spatial pyramid is then constructed and each level is then subdivided into 80 blocks. Edge histogram and LBP features are then extracted for each block and concatenated together to form the global descriptor. To reduce the dimensionality of the descriptor PCA is used. To classify the scans support vector machine with Radial Basis Function (RBF) kernel was used and achieved an AUC of 0.93 while classifying different pathologies such as AMD and DME. A dataset of 326 scans was used for testing the system. Although the proposed system shows good result the major problem was that it classified the foveal scans for each patient. Lemaitre used LBP texture descriptors and Bag of Words model for the classification of OCT images [15]. Instead of using spatial; pyramids Lemaitre extracted 2D LBP features from images and 3D LBP features from volumes. In images the descriptors were extracted from local patches where as 3D features where extracted from the entire sample. A number of experiments with different configurations were conducted by the author and was able to achieve a sensitivity and specificity of 81.2% and 93.2% with their best configuration.
44
International Journal of Computer Applications (0975 – 8887) Volume 148 – No.8, August 2016 The presented algorithms classify the whole volume and also use only LBP and svm without the use of multi-scale spatial pyramid, gradient information and pca making it less computationally expensive.
3. METHODOLOGY The proposed system is divided into three main parts: PreProcessing, Feature Extraction and classification. The flow chart of the proposed system is shown below.
Fig 2: Noise Removed Image
3.1.2 Flattening SD-OCT images of the retina have a natural curvature (which is further distorted due to the common practices in OCT image acquisition and display [17]) that varies both between patients and within each SD-OCT volume. Thus to reduce the effects of the perceived retinal curvature when classifying SDOCT images, the retinal curvature in each image is flattened.
Fig 1: Flow Chart of the Proposed System
3.1 Pre- Processing The preprocessing stage is further divided into three steps: noise removal, flattening and cropping.
To flatten the retinal curvature in each SD-OCT image, we first a pilot estimate of the retinal pigment epithelium (RPE) layer is calculated ,by thresholding each image using Threshold value „T‟. The position of lower boundary of the layer is calculated for each column and a second-order polynomial is fitted to the estimated retinal lower boundary points and shifts each column up or down so that these points lie on a horizontal line.
3.1.1 Noise Removal SD-Oct volumes acquire speckle noise during the imaging process which reduces the efficiency of the system. In order to remove speckle noise, each individual scan is denoised using BM3D filtering in which transfer domain is used to enhance the sparse representation of image. The aforementioned filter is freely available online [16]. To increase the speed of processing and to avoid excessive features all scan are resized to 248 x 256
Fig 3: Flattened Image
3.1.3 Cropping A significant amount of area below and above the scan is complete black adding this part will only result in redundant features as well increase processing time. So to avoid these problem the scan are cropped to the area containing maximum variation between morphological structures of both classes.
45
International Journal of Computer Applications (0975 – 8887) Volume 148 – No.8, August 2016 (P, R) denotes a neighborhood of P sampling points on a circle of radius of R.
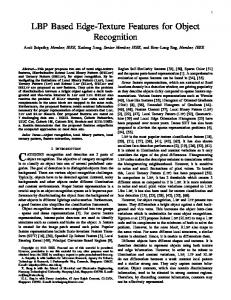
Fig 6: Examples of the extended LBP operator [20]: the circular (8, 1), (16, 2), and (24, 3) neighborhoods
5. EXPERIMENTAL RESULTS Fig 4: Cropped Image
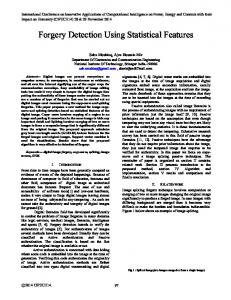
4. FEATURE EXTRACTION Local Binary Features (LBP) are used as features for our system. The original LBP operator labels the pixels of an image with decimal numbers, called Local Binary Patterns or LBP codes, which encode the local structure around each pixel. It proceeds thus, as illustrated in Fig: Each pixel is compared with its eight neighbors in a 3x3 neighborhood by subtracting the center pixel value; The resulting strictly negative values are encoded with 0 and the others with 1; A binary number is obtained by concatenating all these binary codes in a clockwise direction starting from the top-left one and its corresponding decimal value is used for labeling. The derived binary numbers are referred to as Local Binary Patterns or LBP codes
5.1.1 Dataset Duke datasets published by Srinivasan et al. [11] were acquired in Institutional Review Board-approved protocols using Spectralis SD-OCT (Heidelberg Engineering Inc., Heidelberg, Germany) imaging at Duke University, Harvard University and the University of Michigan. This datasets consist of 45 OCT volumes (15 AMD, 15 DME and 15 normal). In this study a subset of the original data containing 15 DME and 15 normal OCT volumes is used.
5.1.2 Validation Technique An entire SD-OCT volume is classified as the mode of the individual image classification results. The validation is done on a leave two patient out basis (one DME volume, one normal volume). As 15 volumes were provided for each type, the experiments were performed 15 times and the results averaged.
5.1.3 Classifier
Fig 5: An example of the basic LBP operator In other words, given a pixel position (xc, yc), LBP is defined as an ordered set of binary comparisons of pixel intensities between the central pixel and its surrounding pixels. The resulting decimal label value of the 8-bit word can be expressed as follows: 7
LBP( xc , yc ) s(ln lc )2n n 0
Support Vector Machine (SVM) is one of the best supervised learning algorithms. SVM was originally designed as a binary classifier. Here a brief description of the classifier is provided for complete details refer to [19][20]. Consider a data set (x1,y1)(x2,y2)…(xn,yn),where x‟s are the features and y‟s are the class labels, which is to be classified into two classes [+1,1]. Assume a hyper plane w.x b 0 in some space H separate both the classes and that no information about the data distribution is know , then the hyper plane with the maximum margin is the optimal hyper plane. Lagrange
(i 1....m)
i multiplier can be used to calculate the values of w and b by solving constrained minimization problem. m
where lc corresponds to the grey value of the centre pixel (xc, yc), ln to the grey values of the 8 surrounding pixels, and function s(k) is defined as
F ( x) sgn i yi K ( xi , x) b i 1
Where SVC learning algorithm is used to find
One limitation of the basic LBP operator is that its small 3x3 neighborhood cannot capture dominant features with large scale structures. To deal with the texture at different scales, the operator was later generalized to use neighborhoods of different sizes [18]. A local neighborhood is defined as a set of sampling points evenly spaced on a circle which is centered at the pixel to be labeled, and the sampling points that do not fall within the pixels are interpolated using bilinear interpolation, thus allowing for any radius and any number of sampling points in the neighborhood. Fig. 6 shows some examples of the extended LBP operator, where the notation
i
and b.
Support vectors are those xi that have i .For k(x,y)=x.y, this corresponds to constructing an optimal separating hyper plane in the input space. An accuracy of 93.33% was achieved.Table 1 shows the confusion matrix.
46
International Journal of Computer Applications (0975 – 8887) Volume 148 – No.8, August 2016 layers in sdoct images congruent with expert manual segmentation,” Optics express, vol. 18, no. 18, pp. 19 413–19 428, 2010.
Table 1. Confusion Matrix DME
Normal
DME
13
0
Normal
2
15
[8]
Table 2 shows the comparison with other papers. Table 2. Comparison Table Algorithm
Sensitivity(%)
Specificity(%)
Venhuizen
71.42
68.75
Lemaitre
81.2
93.7
Proposed
86.67
100
6. CONCLUSION A system for identifying Normal and DME SD-OCT volumes was proposed. To undertake this task Local Binary pattern features were extracted which were then classified using linear support vector machine. An accuracy of 93.33% was achieved. Going further to extend the work other features such as sift, hog,surf and other variants of LBP will be experiment with to see which combination provides better accuracy. Also different classifiers such as neural networks will be experimented with.
7. REFERENCES [1] National Diabetes Data Group (US), National Institute of Diabetes, Digestive, Kidney Diseases (US), and National Institutes of Health (US). Diabetes in America. Number 95. National Institutes of Health, National Institute of Diabetes and Digestive and Kidney Diseases, 1995. [2] Early Treatment Diabetic Retinopathy Study Group, “Photocoagulation for diabetic macular edema: early treatment diabetic retinopathy study report no 1,” JAMA Ophthalmology, vol. 103, no. 12, pp. 1796–1806, 1985. [3] T. C. Chen, B. Cense, M. C. Pierce, N. Nassif, B. H. Park, S. H. Yun, B. R. White, B. E. Bouma, G. J. Tearney, and J. F. de Boer, “Spectral domain optical coherence tomography: ultra-high speed, ultra-high resolution ophthalmic imaging,” JAMA Ophthalmology, vol. 123, no. 12, pp. 1715–1720, 2005. [4]
M. D. Abr`amoff, M. K. Garvin, and M. Sonka, “Retinal imaging and image analysis,” Biomedical Engineering, IEEE Reviews in, vol. 3, pp. 169–208, 2010.
[5]
E. Trucco, A. Ruggeri, T. Karnowski, L. Giancardo, E. Chaum, J. P. Hubschman, B. al Diri, C. Y. Cheung, D. Wong, M. Abramoff et al., “Validating retinal fundus image analysis algorithms: Issues and a proposalvalidating retinal fundus image analysi algorithms,” Investigative ophthalmology & visual science, vol. 54, no. 5, pp. 3546– 3559, 2013.
[6]
L. Giancardo, F. Meriaudeau, T. P. Karnowski, K. W. Tobin Jr, E. Grisan, P. Favaro, A. Ruggeri, and E. Chaum, “Textureless macula swelling detection with multiple retinal fundus images,” Biomedical Engineering, IEEE Transactions on, vol. 58, no. 3, pp. 795–799, 2011.
[7] S. J. Chiu, X. T. Li, P. Nicholas, C. A. Toth, J. A. Izatt, and S. Farsiu, “Automatic segmentation of seven retinal
M. K. Garvin, M. D. Abr`amoff, X. Wu, S. R. Russell, T. L. Burns, and M. Sonka, “Automated 3-d intraretinal layer segmentation of macular spectral-domain optical coherence tomography images,” Medical Imaging, IEEE Transactions on, vol. 28, no. 9, pp. 1436–1447, 2009.
[9] M. K. Garvin, M. D. Abr`amoff, R. Kardon, S. R. Russell, X. Wu, and M. Sonka, “Intraretinal layer segmentation of macular optical coherence tomography images using optimal 3-d graph search,” IEEE Transactions on Medical Imaging, vol. 27, no. 10, pp. 1495–1505, 2008. [10] I. Oguz, L. Zhang, M. D. Abr`amoff, and M. Sonka, “Optimal retinal cyst segmentation from oct images,” in SPIE Medical Imaging. International Society for Optics and Photonics, 2016, pp. 97 841E– 97 841E. [11] P. P. Srinivasan, L. A. Kim, P. S. Mettu, S. W. Cousins, G. M. Comer, J. A. Izatt, and S. Farsiu, “Fully automated detection of diabetic macular edema and dry age-related macular degeneration from optical coherence tomography images,” Biomedical optics express, vol. 5, no. 10, pp. 3568–3577, 2014. [12] J. Sivic and A. Zisserman, “Video google: a text retrieva approach to object matching in videos,” in IEEE ICCV, 2003, pp. 1470–1477. [13] F. G. Venhuizen, B. van Ginneken, B. Bloemen, M. J. van Grinsven, R. Philipsen, C. Hoyng, T. Theelen, and C. I. S´anchez, “Automated age-related macular degeneration classification in oct using unsupervised feature learning,” in SPIE Medical Imaging. International Society for Optics and Photonics, 2015, pp. 94 141I–94 141I. [14] Y.-Y. Liu, M. Chen, H. Ishikawa, G. Wollstein, J. S. Schuman, and J. M. Rehg, “Automated macular pathology diagnosis in retinal oct images using multiscale spatial pyramid and local binary patterns in texture and shape encoding,” Medical image analysis, vol. 15, no. 5, pp. 748–759, 2011. [15] Lemaıtre, Guillaume, Mojdeh Rastgoo, Joan Massich, Carol Y. Cheungc, Tien Y. Wongc, Ecosse Lamoureuxc, Dan Mileac, Fabrice Mériaudeau, and Désiré Sidibé. "Classification of SD-OCT Volumes using Local Binary Patterns: Experimental Validation for DME Detection." (2016).. [16] K. Dabov, A. Foi, V. Katkovnik, and K. Egiazarian, “Image Denoising by Sparse 3-D Transform-Domain Collaborative Filtering,” IEEE Trans. Image Process. 16(8), 2080–2095 (2007). [17] A. N. Kuo, R. P. McNabb, S. J. Chiu, M. A. El-Dairi, S. Farsiu, C. A. Toth, and J. A. Izatt, “Correction of Ocular Shape in Retinal Optical Coherence Tomography and Effect on Current Clinical Measures,” Am. J. Ophthalmol. 156(2), 304–311 (2013). [18] Ojala, T., M. Pietikainen, and T. Maenpaa. "Multiresolution Gray Scale and Rotation Invariant Texture Classification With Local Binary Patterns." IEEE Transactions on Pattern Analysis and Machine Intelligence. Vol. 24, Issue 7, July 2002, pp. 971-987.
47
International Journal of Computer Applications (0975 – 8887) Volume 148 – No.8, August 2016 [19] P. Doll´ar, V. Rabaud, G. Cottrell, and S. Belongie, ―Be-havior recognition via sparse spatio-temporal features‖, In VS-PETS, 2005.
Diabetic Macular Edema (DME) Images
[20] J. C. Niebles, H. Wang, and L. Fei-Fei, ―Unsupervised learning of human action categories using spatial temporal words‖, In BMVC, 2006
8. APPENDIX Normal OCT Images
IJCATM : www.ijcaonline.org
48