www.nature.com/scientificreports
OPEN
received: 23 January 2015 accepted: 17 June 2015 Published: 15 July 2015
Polymerase/DNA interactions and enzymatic activity: multiparameter analysis with electroswitchable biosurfaces Andreas Langer1,2, Michael Schräml3, Ralf Strasser1, Herwin Daub1,2, Thomas Myers4, Dieter Heindl3 & Ulrich Rant1 The engineering of high-performance enzymes for future sequencing and PCR technologies as well as the development of many anticancer drugs requires a detailed analysis of DNA/RNA synthesis processes. However, due to the complex molecular interplay involved, real-time methodologies have not been available to obtain comprehensive information on both binding parameters and enzymatic activities. Here we introduce a chip-based method to investigate polymerases and their interactions with nucleic acids, which employs an electrical actuation of DNA templates on microelectrodes. Two measurement modes track both the dynamics of the induced switching process and the DNA extension simultaneously to quantitate binding kinetics, dissociation constants and thermodynamic energies. The high sensitivity of the method reveals previously unidentified tight binding states for Taq and Pol I (KF) DNA polymerases. Furthermore, the incorporation of label-free nucleotides can be followed in real-time and changes in the DNA polymerase conformation (finger closing) during enzymatic activity are observable.
The DNA polymerases are the workhorses for replication of genomic information in living cells but more recently also for biotechnology applications such as the polymerase chain reaction (PCR) and DNA sequencing. In particular in the field of sequencing-by-synthesis (e.g. nanopore sequencing), massive efforts are currently being undertaken to develop working principles for faster, more accurate and consequently more cost-effective assays1,2, designed ultimately, to operate at the single molecule level in medical applications. To this end, high-performance polymerases must be carefully engineered3,4, an approach which relies on having precise knowledge about their mode of action5. Figure 1 illustrates a simplified DNA polymerization process (see reviews6–9 for more details): first, the DNA polymerase (P) binds to the junction of an oligonucleotide primer hybridized to a complementary oligonucleotide template DNA with high affinity (1 → 2). Second, the P-DNA complex binds a deoxynucleoside triphosphate (dNTP) with comparably weak affinity (2 → 3), which depends on the type of adjacent base on the opposing single stranded template (base-pairing), so that a complementary dNTP is favored. Third, the polymerase incorporates the nucleotide by catalyzing the formation of a phosphodiester bond to the 3’ end of the primer, thereby extending the strand by one nucleotide and producing pyrophosphate (PPi) waste (3 → 7). In more detail, the catalytic action involves several steps, where the polymerase conformation plays a crucial role: the dNTP binds to the P-DNA complex when the finger domain is in an open state (3); thereafter, the fingers close PO → PC (4) and the dNTP is aligned with the enzymatically active site, where the chemical step takes place and the nucleotide becomes incorporated (5). 1
Dynamic Biosensors GmbH, Lochhamer Str. 15, 82152 Martinsried, Germany. 2Technische Universität München, 85748 Garching, Germany. 3Roche Diagnostics GmbH, Nonnenwald 2, 82377 Penzberg, Germany. 4Roche Molecular Systems Inc., 4300 Hacienda Dr Pleasanton, CA 94588, USA. Correspondence and requests for materials should be addressed to M.S. (email:
[email protected]) or U.R. (email:
[email protected]) Scientific Reports | 5:12066 | DOI: 10.1038/srep12066
1
www.nature.com/scientificreports/
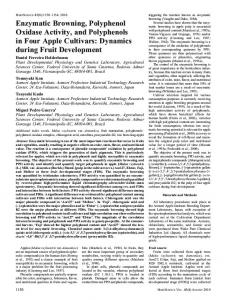
Figure 1. Simplified DNA polymerization reaction pathway: polymerase binding (1 → 2), nucleotide binding (2 → 3), nucleotide incorporation (3 → 7). Changes in the polymerase conformation (fingers closing/ opening) and PPi release are combined in states (4–6) here, see text. Michaelis-Menten-like steps of substrate binding and product catalysis are indicated in blue. Note that the sequential association/dissociation of binary complexes (1 ↔ 2 ↔ 3) is fundamentally different from the association/dissociation of a ternary complex with all reactants present simultaneously (1 ↔ 3, gray pathway). Influences of cofactors, exonuclease activity and other possible transitions are omitted.
After the finger domain has opened again (6), PPi product is released and the polymerase translocates forward to the next nucleotide in the template strand. For mismatched dNTPs, the fingers only partially close PO → PPC (4)10,11, which alters the probabilities of incorporation and dissociation and effectively constitutes a fidelity check that favors the incorporation of correctly paired bases. Despite its very simplified nature, the scheme in Fig. 1 is practical because it represents the elongation process as the two steps of Michaelis-Menten-like enzyme kinetics, which involves a minimal set of interaction and activity parameters for the assessment of the polymerization process. The formation and stability of binary and ternary complexes can be predicted from the kinetic rates (kon, koff) and the dissociation constants (KD) of polymerase, template DNA, and dNTPs, respectively. Together with the enzymatic parameters kcat (turnover number) and the Michaelis constant KM = (koff + kcat)/kon (substrate concentration of half-maximal conversion velocity), the performances of different polymerases can be compared. However, the reaction pathway of Fig. 1 imposes significant challenges on the measurement modalities employed to resolve the individual steps and unravel interdependencies: The involvement of many interactants (P, template DNA, competing DNA, matching/mismatching dNTPs, Mg2+, protein cofactors, PPi), gives rise to a number of combinatorial situations that are difficult to manage experimentally, especially when DNA sequence variations are of interest. Moreover, different interactions take effect at distinct concentrations spanning a wide range from pM (P-DNA) to mM (P-Mg2+), which requires a highly sensitive measurement system with a large dynamic range. In order to assess the functionality and yield of the polymerization process, it must be possible to monitor the DNA elongation in real-time and to detect transient changes in the polymerase conformation. To date, no single assay method has been able to meet all these criteria. Chemical-quench methods with radiolabeled molecules were introduced in the 1970’s and were widely used to provide kinetic data, with methods further improved with the introduction of automated stopped-flow instruments. These instruments enabled the rapid mixing of solutions9,12–16 but the handling of radioactive substances remained difficult and laborious. The use of fluorescence labels is advantageous for many purposes17–24 but does not allow the quantification of high-affinity interactions with pM K D S in solution, because the labelled compound must be present at nM concentrations to enable the detection with fluorescence (anisotropy) spectrometers24–27. Additionally, the label may severely interfere with binding sites and enzymatic activity; for instance, dyes inevitably suppress the incorporation of nucleotides, irrespective of whether the nucleotide is directly labelled19 or DNA intercalating dyes are being used21. Single molecule fluorescence resonance energy transfer (FRET) was successfully used to monitor elongation28, nucleotide selection29, and conformational transitions of the finger domain of the Klenow fragment11,30 that had been predicted from crystallography10. Since FRET studies rely on elaborate strategies for site-specific labelling30, their general applicability remains however limited. Driven by the quest for new sequencing technologies, valuable insight into polymerase activity has also been obtained in single-molecule studies with nanopores31,32. Biosensors, where one interactant is immobilized on a surface, are in many ways better suited than solution methods for the dissection of individual pathways in complex reaction schemes. Interactants can not only be provided but also be withdrawn from the reaction using microfluidic channels for solution exchange with association as well as dissociation phases monitored in real-time. Many combinations of interactants at different concentrations can be tested in one assay which allows for the analysis of more complex reactions, speeds up the workflow and makes interpretations more straightforward. Kinetic Scientific Reports | 5:12066 | DOI: 10.1038/srep12066
2
www.nature.com/scientificreports/ measurements on P-DNA interactions on surfaces have primarily been performed with SPR (surface plasmon resonance) sensors19,33–37 and, less frequently, with fluorescence and fiber optics methods18,38. Some of these methods also have observed the elongation of templates19,33,36,38. However, several influences can lead to artefacts and must be carefully considered in the interpretation of surface assays, among them being mass-transport limitations36, non-specific binding to surface matrix layers33, or crowding and rebinding effects due to high immobilization densities19. Most importantly, it is not possible to draw information about the position of the polymerase along the DNA or its conformation (fingers closing transition) from state-of-the-art measurements. Here we report a method that utilizes a stimuli-responsive molecular interface for the investigation of polymerization processes and does not require the labelling of nucleotides or polymerases. The functional elements are oligonucleotide probes which are assembled at a very low density on gold microelectrodes. By applying alternating electrical potentials these probes are set in motion and perform an oscillatory orientation switching from which two types of measurement variables are obtained in real-time: The switching speed depends on the hydrodynamic friction of the probes and thus indicates the presence of a bound polymerase, its position along the DNA, and its conformation. At the same time, the extension of electrically aligned “standing” DNA molecules is measured, revealing how many base-pairs have formed in the course of polymerization activity. From these two complementary signals a number of parameters characteristic for the interaction (affinities, kinetics, thermodynamic energies) and the enzymatic activity (elongation rate, Michaelis-constant, changes in the polymerase conformation) can be analyzed with unprecedented sensitivity. This is demonstrated for the Taq DNA polymerase from T. Aquaticus and the Klenow fragment of Pol I from E. coli. The described assay is applicable to DNA and RNA polymerases and is performed using commercially available chips and instruments.
Results
Measurement Principles. Figure 2 illustrates the two complementary measurement principles, which derive information about the orientation/extension of surface-tethered oligonucleotides from the quenching of a fluorescent dye in the proximity of a metal film. Experiments are performed with DNA layers comprising app. 106 strands on microelectrodes with diameters of 120 μ m. The optically excited Cy3 dye transfers energy by near-field interaction to the gold film over long distances (>100 nm)39 and by measuring the emitted fluorescence intensity, the height of the top end of the DNA can be determined. The first measurement principle, the dynamic measurement mode, involves an electrical actuation of the DNA by applying alternating voltages of typically ± 0.4 V to the gold microelectrodes (Fig. 2A). The negatively charged DNA is repelled from the negatively charged surface and then attracted to the positively charged surface39, and oscillates (switches) between lying and standing orientations at typically 10 kHz frequency. This movement is monitored in real-time by time-correlated single photon counting, which generates a fluorescence histogram every second to resolve the upward and downward motions as well as the steady state fluorescence levels of lying and standing DNA, respectively (switchSENSE technique)40. Figure 2B compares upward switching traces of 54-mer DNAs before and after binding the Taq polymerase, and before and after the incorporation of dNMPs by the polymerase. Throughout this work a random sequence of a 36 nucleotide (nt) primer hybridized to a complementary 54 nt template, denoted 36/54 or ss-dsDNA, and its fully double stranded analogue, denoted 54/54 or dsDNA, are used. The association of Taq polymerase slows the motion of the DNA strand by increasing its hydrodynamic drag, and thus produces a pronounced shift (tilt) in the time-resolved upward switching curve. Upon addition of dNTPs, the curve tilts even more, which suggests that the polymerase elongates the primer and moves up along the DNA (solutions to the drift-diffusion equation41 imply that a polymerase located at the distal end of a DNA nanolever indeed features a higher rotational friction coefficient than a polymerase located closer to the pivot point). The polymerase can be removed by flowing a strong denaturation agent (5 M urea) above the surface; thereafter, the upward switching trace coincides with the control measurement of a 54/54 layer, which corroborates the notion that the polymerization from 36/54 to 54/54 was successful. For ease of analysis, the time-resolved upward switching curves are converted to a single value, the Dynamic Response parameter (DRup), which is the area under the normalized fluorescence curve: DR up =
4µs
∫0µs
F normdt.
(1)
The DRup represents the switching speed: high DR-values indicate fast switching, low DR-values indicate slow switching. A second signal provides valuable complementary information on the polymerase activity: the absolute fluorescence intensity measured for a standing DNA orientation (Fig. 2C,D). In order to align the DNA upright, it is essential to apply a repulsive (negative) surface potential39,41, since otherwise the DNA orientation is ill-defined and quantitative comparisons cannot be made. Upon addition of dNTPs to complexes of Taq bound to ss-dsDNA, the fluorescence increases significantly. As the polymerase converts the upper DNA part from a floppy single- to a rigid double-strand, the dye effectively moves away from the fluorescence-quenching surface. This is a consequence of the short-ranged electric field that decays rapidly above the surface due to Debye screening39,41. It does Scientific Reports | 5:12066 | DOI: 10.1038/srep12066
3
www.nature.com/scientificreports/
Figure 2. Measurement principles. Both measurement modes utilize the quenching of a fluorescent dye in the proximity of a metal film for evaluation of the distance of the DNA’s top end from the surface in real-time. A Polymerase detection by dynamic DNA switching in alternating electric fields: the binding of a polymerase slows the electrically driven DNA orientation-switching due to an increase in hydrodynamic drag (only the upward motion, induced by the positive-to-negative potential step, is shown). B Upward switching traces: fluorescence intensity measured by time-correlated single-photon counting during the first 10 μ s after switching the electrode potential from attractive (+ 0.4 V) to repulsive (− 0.4 V). C Polymerase activity measurement at static DNA orientation: when holding the DNA in an upright orientation by applying a constant repulsive potential, the incorporation of dNMPs results in a fluorescence enhancement proportional to the length of the DNA extension. D Comparison of switching speed (Dynamic Response upward, DRup) and steady-state fluorescence during polymerase binding, primer extension, polymerase removal by urea, and removal of the extended primer followed by hybridization with a 54-nt oligonucleotide (control).
not significantly affect flexible single-stranded DNA segments which are more than a few nanometers away from the surface and thus they can move about freely. By contrast, for a fully double-stranded helix the repulsion of its surface-proximal segment is effectively transduced to the upper DNA end, because the molecule is rod-like. The fluorescence after removing the Taq by urea from the polymerized strand is comparable to the fluorescence of the same layer after removing the polymerized strand and re-hybridizing it with a full length 54 nt cDNA.
Kinetics of the Taq-DNA interaction. To follow the association of Taq to ss-dsDNA (Fig. 3A) and dsDNA (Fig. 3B) in real-time we monitored the switching speed, i.e. the Dynamic Response signal. It is important to note here that the experiments were conducted in the absence of dNTPs or other DNA in the solution (cf. 1 ↔ 2 in Fig. 1), since this has a profound influence, as will be shown later. The association kinetics can be described well by single exponential fits,
DR up (t ) ∝ exp {− k obs t }.
(2)
Plotting the observed on-rates kobs versus the Taq concentration in Fig. 3C shows the expected linear relationship
k obs (c) = c ⋅ k on + k off
(3)
and enables us to determine the intrinsic association rate kon = k1 → 2 (cf. Fig. 1) by linear regression. The on-rate at 25 °C is slightly higher for ss-dsDNA, k1ss→−2ds = 1.9 ± 0.1 × 10 7M −1s−1 vs. ds k1→ 2 = 1.0 ± 0.1 × 10 7M −1s−1, albeit this difference seems small compared to the substantial dissimiScientific Reports | 5:12066 | DOI: 10.1038/srep12066
4
www.nature.com/scientificreports/
Figure 3. Kinetic and thermodynamic analysis of Taq interacting with ss-dsDNA (36 nt primer hybridized to complementary 54 nt template) and dsDNA (54 bp). A,B: Association of Taq to ss-dsDNA (A) and dsDNA (B) monitored as changes in the Dynamic Response parameter for different Taq concentrations (1, 2, 3, 4, 5, 6 mU/μ l, U = activity units). Lines are exponential fits, DRup = a + b·exp{− kobst}. C: Rate constants kobs from A & B for ss-dsDNA (open symbols) and dsDNA (full symbols) versus Taq concentration; solid lines are linear fits, kobs = c·kon + koff. D, E: Association ([Taq] = 5 mU/μ l) and dissociation curves for ss-dsDNA (D) and dsDNA (E) at 5°, 15°, 25°, 35°, 45°, and 55 °C. F: Map of ds association- and dissociation-rate constants kon and koff from D&E (for dsDNA koff , 1 is shown). G–I: Analysis of thermodynamic energies from van’t Hoff (G) and Eyring plots (H,I) for ss-dsDNA and dsDNA. Lines are linear regression analyses. J, K: Energy diagrams for ss-dsDNA (J) and dsDNA (K) for T = 25 °C, shown are the transition and bound states, respectively. Measurements were conducted at pH 8.3 (10 mM Tris, 40 mM KCl, 1.5 mM MgCl2).
larities observed in the dissociation behavior. The non-zero intercept of the linear fit for dsDNA in Fig. 3C indicates that the off-rate is quite significant for continuous double-strands. This is confirmed by real-time dissociation measurements in running buffer without Taq (Fig. 3D,E), which show that the dissociation from dsDNA proceeds ten times faster than from ss-dsDNA, k 2ds→,11 = 47 ± 3 × 10⁻⁵s−1 vs. k 2ss→−1ds = 5.4 ± 0.1 × 10⁻⁵s−1 (at 25 °C). In addition to the k 2ds→,11-process, the dissociation kinetics from dsDNA exhibit signs of a second dissociation process with an even higher dissociation rate k 2ds→,21 = 3.2 ± 0.2 × 10⁻³s−1, which is not observed for ss-dsDNA. We attribute this to the presence of not only one, but two Taq molecules on the 54 bp dsDNA molecules42, which feature different dissociation rates. In control experiments with dsDNA that was internally labelled mid-strand, k 2ds→,11 was found to be comparable to dsDNA with a terminal Cy3 dye, but the k 2ds→,21-process was not observed (Supporting Information Figure 1). This finding suggests that the k 2ds→,21-rate stems from weakly bound Taq molecules associated to surface-proximal segments of the dsDNA, an interaction which is probably sterically inhibited when an internal Cy3 label is present at the central DNA position. It also confirms that the terminal Cy3 label does not affect the quantitation of the dissociation k 2ds→,11-rate.
Thermodynamics of Taq. Association and dissociation measurements were performed at different
temperatures from 5° to 55 °C (Fig. 3D,E) in order to obtain thermodynamic information about the previously unidentified tight binding state. The corresponding koff vs. kon rate map is depicted in Fig. 3F. Generally, the affinity of Taq for ss-dsDNA is an order of magnitude higher than for dsDNA. Upon elevating the temperature, the on-rates increase for both DNA types, while, the off-rates decrease. As a consequence, the affinities improve by an order of magnitude from 5° to 55 °C and the dissociation constants Scientific Reports | 5:12066 | DOI: 10.1038/srep12066
5
www.nature.com/scientificreports/
Δ H (kJ·mol ) −1
ss-dsDNA
Bound state
13.0 ± 2.1
24.9 ± 2.5
Δ S (J·mol−1·K−1)
− 62.8 ± 6.9
Δ G25°C (kJ·mol−1)
31.7 ± 2.9
− 65.5 ± 3.6
10.0 ± 1.0
31.0 ± 1.7
Δ H (kJ·mol−1) dsDNA
Transition state
Δ S (J·mol−1·K−1)
− 77.4 ± 3.2
Δ G25°C (kJ·mol−1)
32.9 ± 1.4
303 ± 9
302 ± 6 − 59.2 ± 2.3
Table 1. Thermodynamic energies of the Taq-DNA interaction in the absence of dNTPs (1 ↔ 2 in Fig. 1) determined by van’t Hoff and Eyring analyses from 5° to 55 °C.
K D = K A−1 = k off / k on
(4)
ds ds approach very low pM values (KDss,−1↔ 2 ~ 1pM and K D,1 ↔ 2 ~ 10pM at 55 °C). We analyzed the energies of the bound state
ΔG = ΔH − T ⋅ ΔS = − RT ln (K AC 0)
(5)
(C0 = 1 M being the standard concentration) from van’t Hoff plots, which are depicted in Fig. 3G. The relationship between ln(KA) and 1/T is found to be linear within the measurement accuracy, indicating that the enthalpy and entropy are constant over the investigated temperature range. This behavior is generally expected for non-specific protein-DNA binding where the change in heat capacity usually is insignificant43, however, under different experimental conditions heat capacity changes have been observed in calorimetric studies44. The negative slope of the van’t Hoff plot signifies an endothermic reaction (Δ H > 0), which is outweighed by a strong entropic contribution (− TΔ S ≪ 0) to give a negative free energy difference (Δ G Δ Hss−ds). Energies of the transition state could be analyzed from the available kinetic rate constants using the Eyring equation
k on/ off =
∆H * k BT ∆S * ⋅ exp − + , RT h R
(6)
again carrying out linear regression analyses of logarithmic plots, cf. Fig. 3H,I. In this case both, enthalpy and entropy, contribute to the activation energy barrier (Δ H* > 0, − TΔ S* > 0 → Δ G* > 0). Energy diagrams are shown in Fig. 3J,K and Table 1 summarizes the activation and free-state energy values.
Enzymatic Activity of Taq. We investigated the enzymatic activity of the Taq polymerase during
primer elongation by monitoring two signals at the same time, cf. Fig. 4A,B. While the fluorescence intensity emitted by the standing DNA (Fup) reports the primer elongation state (height of the upper, Cy3-labelled DNA end), the switching speed (DRup) indicates the polymerase’s binding state and position on the DNA. Upon addition of dNTPs and commencing primer elongation, Fup increases sharply as the Cy3 dye moves away from the quenching surface (cf. Fig. 4B, the transient decrease before the increase results from the passage of an air bubble that is used to separate liquid compartments in the flow system). Simultaneously, DRup drops because the rotational friction increases as the Taq is approaching the upper DNA end. After having reached the DNA’s top end, the polymerase unbinds from the now fully double-stranded DNA and single-exponential dissociation kinetics are observed in the DRup signal. The elongation activity of Taq was analyzed in real-time as a function of temperature from 5° to 45 °C from the increasing Fup signal in Fig. 4C. The kinetics do not depend on the dNTP concentration, indicating that the activity of the polymerase is the rate-limiting factor (see Supporting Information Figure 2). The elongation curves follow first-order kinetics and can be fitted very well with norm * t }, Fup = 1 − exp {− k cat
(7)
* being the elongation rate constant (or velocity) in normalized fluorescence units per second. with k cat Since the length of the newly synthesized DNA is known (18 nt), we can convert this rate to units of formed base-pairs per second. For the rather short template used here, elongation velocities up to 10 bp/s could be followed, but we believe that the analysis of higher velocities should be straightforward when Scientific Reports | 5:12066 | DOI: 10.1038/srep12066
6
www.nature.com/scientificreports/
Figure 4. Enzymatic activity measurement of Taq. A: Schematic of the ss-dsDNA which is converted to dsDNA during dNMP incorporation. As a result, the polymerase moves outward along the DNA nanolever (which increases the friction and slows the DNA switching) and the dye is being held at a greater distance from the surface by the rigid double helix when the DNA is standing (which increases the fluorescence). B: Taq was bound to ss-dsDNA and baselines are recorded for 1.5 min (no dissociation). The injection of a dNTP-mix (100 μ M) leads to a rapid incorporation of nucleotides (DRup-drop and Fup-rise), followed by the dissociation of polymerase from the dsDNA end (increasing DRup and slightly decreasing Fup). C: Temperature-dependent real-time elongation measurements (cdNTP = 100 μ M). Lines are single exponential * t}. D: Elongation rates from C as a function of temperature, the line is an Arrhenius fit. fits ∝ exp{−k cat
using longer templates. Elongation rates are plotted versus temperature in Fig. 4D and found to triple every 10 °C, in agreement with previous results for Taq45. The line is an Arrhenius fit, max k cat (T ) = k cat ⋅ exp {− E A/ RT },
(8 )
where EA = 90 ± 4 kJ·mol−1 denotes the activation energy for nucleotide incorporation. This analysis, however, pertains to the case of low temperatures only, since the polymerase becomes deactivated at very high temperatures, which effectively reduces the catalytic activity and requires more elaborate modeling46.
Kinetics and affinities of Pol I(KF). Pol I (KF) has been the subject of many studies, but the reported binding kinetics and affinities are often inconsistent due to various experimental conditions and due to method-specific influences. In the following we demonstrate how the introduced method can be used to investigate different combinations of interactants in a single workflow. At the beginning of each run depicted in Fig. 5A–C, Pol I (KF) was flowed over a ss-dsDNA layer (t = 1–2 min), and the association kinetics were analyzed from the DRup-decrease as before, yielding k on = k1ss→−2ds = 1.8 ± 0.2 × 10 7M −1s−1. Next, the dissociation of the binary P-DNA complex was measured over one hour, during which the polymerase unbound from the DNA with a remarkably slow rate, k off = k 2ss→−1ds = 3.0 ± 1.5 × 10⁻⁵s−1. To suppress the 3’-exonuclease activity of the polymerase, the dissociation buffer was Mg2+-free, but contained 1.5 mM Ca2+ instead to keep the ionic strength constant. The corresponding dissociation constant of the binary P-DNA complex in Ca2+-buffer is KD,1↔2 = 1.6 ± 0.8 pM. These first two steps were repeated in A-C to demonstrate the reproducibility of the assay. In a third step, primer elongation was initiated by adding a mix of dNTPs (100 μ M) to the binary KF-DNA complex in Mg2+ buffer. The rapid incorporation of dNTPs is evident by the increasing fluorescence intensity F emitted by the electrically aligned, standing DNA, which saturates within a couple of seconds (Fig. 5A,B). Immediately after the complete double-strand has formed, a fast dissociation process sets in (cf. DRup-increase), suggesting that the polymerase quickly unbinds from the duplex after having reached the end. In the presence of dNTPs and Mg2+, but absence of competing DNA in solution (cf. Fig. 5A, phase “diss. 2”) the off-rate is k off = k 3ds→1 |[dNTP] = 100μM = 0.025 ± 0.005 s−1 and KD,1↔3 = 1.3 ± 0.4 nM (Fig. 5A). The dissociation becomes even faster when competing dsDNA is present in solution (cf. Fig. 5B, phase “diss. 2”), as it is the case for chemical-quench experiments in solution13,47, ] = 100 μ M −1 and KD,1↔3 = 3.2 ± 0.6 nM. k off = k 3ds→ 1 |[[dNTP dsDNA] = 100nM = 0.061 ± 0.005 s These values are in agreement with the seminal results of solution measurements from the labs of Benkovic13 and Joyce47, who used chemical quench methods and radiolabeling to study the KF-DNA interaction in the presence of dNTPs and competing DNA: kon = 1.2 × 10⁷ M−1 s−1 13, koff = 0.06 s−1 13,47, KD = 5− 8 nM13,47. On-rates (1− 3 × 10⁵ M−1 s−1) and off-rates (0.002− 0.007 s−1) found in SPR studies19,34 differ by more than an order of magnitude from solution kinetics and the present results; because the deviations are in opposite directions, however, they compensate in the calculation of KD values, which are reported to be nM, too. The interpretation of SPR data has not been straightforward though and mass transport limitations and rebinding effects due to high DNA densities (cf. 8 × 1012 cm−2 in34 vs.