batch evaluations conJbr the same benefit for real users? We carried out .... was run on a Sun Ultrasparc 140 with 256 megabytes of. RAM running the Solaris ...
Do Batch and User Evaluations Give the Same Results? William Hersh, Andrew Turpin, Susan Price, Benjamin Chan, Dale Kraemer, Lynetta Sacherek, Daniel Olson {hersh; turpina; prices; chanb; kraemerd; sacherek; olsondan}@ohsu.edu Division of Medical Informatics & Outcomes Research Oregon Health Sciences University Portland, OR, USA
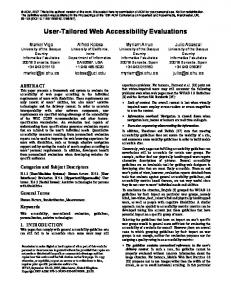
The experimental milieu for assessing the study question was the TREC-8 interactive track. As with its predecessors from the two years previous (TREC-6 and TREC-7 interactive tracks), an "instance recall" task was employed, where users were asked to identify instances of a topic [5]. Instance recall was defined as the fraction of total instances (as determined by the NIST assessor) for the topic that were covered by the documents saved by the user. Figure 1 shows two example TREC-8 interactive track queries.
Do improvements in system performance demonstrated by batch evaluations conJbr the same benefit for real users? We carried out experiments designed to investigate this question. After identi~ing a weighting scheme that gave maximum improvement over the baseline in a noninteractive evaluation, we used it with real users searching on an instance recall task. Our results showed the weighting scheme giving beneficial results in batch studies did not do so with real users. Further analysis did identi~ other factors predictive of instance recall, including number of documents saved by the user, document recall, and number of documents seen by the user.
The overall plan for this study was to transform queries, documents, and relevance judgments from the TREC-6 and TREC-7 interactive tracks into a test collection that could identify highly effective batch performance compared to a baseline. In particular, we focused on the newer weighting schemes that have shown to be effective with TREC data over the standard TF*IDF baseline. This allowed the identification of a weighting approach that could be assessed in interactive user experiments.
1. Introduction A continuing debate in the information retrieval (IR) field is whether the results obtained by "batch" evaluations, consisting of measuring recall and precision in the noninteractive laboratory setting, can be generalized to real searchers. Much evaluation research dating back to the Cranfield studies [2] and continuing through the Text Retrieval Conference (TREC) [3] has been based on entering fixed query statements from a test collection into an IR system in batch mode with measurement of recall and precision of the output. It is assumed that this is an effective and realistic approach to determining the system's performance [9]. Some have argued against this view, maintaining that the real world of searching is more complex than can be captured with such studies. They point out that relevance is not a fixed notion [6], interaction is the key element of successful retrieval system use [10], and relevance-based measures do not capture the complete picture of user performance [4].
This paper reports four experiments: 1. Establishment of the best weighting approach for batch searching experiments using previous TREC interactive track data. 2. User experiments to determine if those measures give comparable results with human searchers with new TREC interactive track data. 3. Verification that the new TREC interactive track data gives comparable batch searching results for the chosen weighting schemes. 4. Analysis of other factors predictive of successful searching from data collected by the user experiments. Each experiment is described in a separate section, with appropriate methods introduced as they were used for each.
If batch searching results cannot be generalized, then system design decisions based on them are potentially misleading. The goal of this study therefore was to assess whether IR approaches achieving better performance in the batch environment could translate that effectiveness to real users. As the study also entailed data collection of other user attributes related to interactive searching, we were also able to assess the association of other factors with successful searching.
2. Finding an effective weighting scheme for experimental system The goal for the first experiment was to find the most effective batch-mode weighting scheme for interactive track data that would subsequently be used in interactive experiments. All batch and user experiments in this study used the MG retrieval system [l 1]. MG allows queries to be entered in either Boolean or ranked mode. If ranking is chosen, the ranking scheme can be varied according to the Q-expression notation introduced by Zobel and Moffat [121.
Permission to make digital or hard copies of all or part of thin work for personal or classroom use is granted without fee provided that copies are not made or distributed for profit or commercial advantage and that copies bear this notice and the full citation on the first page. To COpy otherwise, to repubhsh, to post on servers or to redistribute to lists, requires prior specific permission and/or a fee. SIGIR 2000 7•00 Athens, Greece © 2000 ACM 1-58113-226-310010007...$5.00
17
Number: 414i Title: Cuba, sugar, i m p o r t s Description: W h a t c o u n t r i e s i m p o r t C u b a n sugar? Instances: In t h e t i m e a l l o t e d , p l e a s e f i n d as m a n y D I F F E R E N T c o u n t r i e s of the sort d e s c r i b e d a b o v e as y o u can. P l e a s e save at l e a s t o n e document for EACH such DIFFERENT country. If o n e d o c u m e n t d i s c u s s e s s e v e r a l s u c h c o u n t r i e s , t h e n y o u n e e d n o t save o t h e r d o c u m e n t s t h a t r e p e a t those, s i n c e y o u r g o a l is to i d e n t i f y as m a n y D I F F E R E N T c o u n t r i e s of t h e s o r t d e s c r i b e d a b o v e as p o s s i b l e . Number: 428i Title: declining birth rates Description: W h a t c o u n t r i e s o t h e r t h a n the US a n d C h i n a h a v e or h a v e h a d a declining birth rate? Instances: In t h e t i m e a l l o t e d , p l e a s e f i n d as m a n y D I F F E R E N T c o u n t r i e s of the sort d e s c r i b e d a b o v e as y o u can. P l e a s e save at l e a s t o n e document for EACH such DIFFERENT country. If one d o c u m e n t d i s c u s s e s s e v e r a l s u c h c o u n t r i e s , t h e n y o u n e e d n o t s a v e o t h e r d o c u m e n t s that r e p e a t those, s i n c e y o u r g o a l is to i d e n t i f y as m a n y D I F F E R E N T c o u n t r i e s of the s o r t d e s c r i b e d a b o v e as p o s s i b l e .
Figure 1 - Sample queries from the TREC interactive track.
plus the number of documents divided by term frequency is used as a term's weight, while a D in this position indicates that the natural logarithm of one plus the maximum term frequency divided by term frequency is used. A C in the fourth position indicates a cosine measure based term frequency treatment, while an F in this position indicates Okapi-style usage [7]. Varying the fiRh character alters the document length normalization scheme. Letters greater than H use pivoted normalization [8].
A Q-expression consists of eight letters written in three groups, each group separated by hyphens. For example, 1313-AC13-BCA, is a valid Q-expression. The two triples describe how terms should contribute to the weight of a document and the weight of a query respectively. The first two letters define how a single term contributes to the document/query weight. The final letter of each triple describes the document/query length normalization scheme. The second character of the Q-expression details how term frequency should be treated in both the document and query weight, e.g., as inverse document/query frequencies. Finally, the first character determines how the four quantities (document term weight, query term weight, document normalization, and query normalization) are combined to give a similarity measure between any given document and query. To determine the exact meaning of each character, the five tables appearing in the Zobei and Moffat paper must be consulted [ 12]. Each character provides an index into the appropriate table for the character in that position.
Me~ods In order to determine the best batch-mode weighting scheme, w e needed to convert the priorinteractivedata (from T R E C - 6 and TREC-7) into a testcollectionfor batch-mode studies. This was done by using the descriptionsectionof the interactivequery as the query and designating all documents as relevantto the query where one or more instanceswere identifiedwithin it. The batch experiments set out to determine a baselineperformance and one with m a x i m u m improvement thatcould be used in subsequent user experiments. Each Q-expression was used to retrievedocuments from the 199 I-1994 FinancialTimes collection(used in the InteractiveTrack for the past three years) for the 14 T R E C - 6 and TREC-7 InteractiveTrack topics. Average precisionwas calculatedusing the trec eval program.
Although the Q-expressions permit thousands of possible permutations to be expressed, several generalizations can be made. Q-expressions starting with a 13 use the cosine measure for combining weights, while those starting with an A do not divide the similarity measure through by document or query normalization factors. A B in the second position indicates that the natural logarithm of one
18
paid a modest honorarium for their participation. Graduate students were recruited from the Master of Science in Medical Informaties Program at OHSU. They had a variety ofbackgronnds, from physicians or other health care professionals to having completed non-health undergraduate studies.
Resu~s Table 1 shows the results of our batch experiments using TREC-6 and TREC-7 Interactive Track data. The first column shows average precision, while the next column gives the percent improvement over the baseline, which in this ease was the BB-ACB-BAA (basic vector space TF*IDF) approach. The baseline was improved upon by other approaches shown to be effective in other TREC tasks (e.g., ad hoe), in particular pivoted normalization (second and third rows - with slope of pivot listed in parentheses) and the Okapi weighing function (remaining rows). The best improvement was seen with the AB-BFDBAA measure, a variant of the Okapi weighing function, with an 81% increase in average precision. This measure was designated for use in our user experiments.
The experiments took place in a computer lab. Each session took three and one-half hours, broken into three parts, separated by short breaks: personal data and attributes collection, searching with one system, and searching with the other system. The personal data and attributes collection consisted of the following steps: 1. Orientation to experiment (10 minutes) 2. Collection of Demographic/Experience data listed in Table 2 (10 minutes) 3. Collection of Cognitive data listed in Table 2 (40 minutes) 4. Orientation to searching session and retrieval system, with demonstration of a search (10 minutes) 5. Practice search using a topic from a previous interactive track ( 10 minutes) The cognitive data was obtained by using tests from the Educational Testing Service (ETS) shown in past IR research to be associated with some aspect of successful searching.
3. Interactive searching to assess weighting scheme with real users
Based on the results from Experiment 1, the explicit goal of the interactive experiment was to assess whether the ABBVD-BAA (Okapi) weighting scheme provided benefits to real users in the TREC interactive setting over the TF*IDF baseline. We performed our experiments with the risk that this benefit might not hold for TREC-8 interactive data, though as seen in Experiment 3 below, this was not the
The personal data and attributes collection was followed by a 10 minute break. The searching portion of the experiment consisted of searching on the first three topics assigned, taking a 15-minute break, and searching on the second three topics assigned. Per the consensus protocol, each participant was allowed 20 minutes per query. Participants were instructed to identify as many instances as they could for each query. They were also instructed for each query to write each instance on their worksheet and save any document associated with an instance (either by using the "save" function of the system or writing its document identifier down on the searcher worksheet).
case.
Methods The main performance measure used in the TREC-8 interactive track was instance recall, defined as the proportion of true instances identified by a user searching on the topic. Relevance assessors at NIST defined the instances from pooled searching results from all experimental groups, as described in the past [5]. The experiment was carried out according to the consensus protocol developed by track participants (described in detail at trec.nist.gov). We used all of the instructions, worksheets, and questionnaires developed by consensus, augmented with some additional instruments, such as tests of cognitive abilities and a validated user interface questionnaire. Table 2 lists all of the data collected for each search in the experiment.
Each participant was assigned to search three queries in a block with one system followed by three queries with the other system. A pseudo-random approach was used to insure that all topic and system order effects were nullified. (A series of random orders of topics with subject by treatment blocks were generated (for balance) and used to assign topics.)
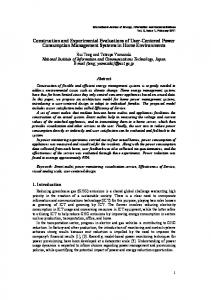
Both the baseline and Okapi systems used the same Webbased, natural language interface shown in Figure 2. MG was run on a Sun Ultrasparc 140 with 256 megabytes of RAM running the Solaris 2.5.1 operating system. The user interface accessed MG via CGI scripts which contained JavaScript code for designating the appropriate weighting scheme and logging search strategies, documents viewed (title displayed to user), and documents seen (all of document displayed by user). Searchers accessed each system with either a Windows 95 PC or an Apple PowerMac, running Netscape Navigator 4.0.
After each search, a briefquestiormaire collectingthe PostTopic data listedin Table 2 was administered. ARcr each search of three topics were searched using one system, the Post-System data from Table 2 was collected. After the experiment was over, the Post-Experiment data from Table 2 was collected. W e also administered the Questionnaire for User InterfaceSatisfaction(QUIS) 5.0 instrument [I]. QUIS provides a score from 0 (poor) to 9 (excellent)on a variety of user factors,with the overall score determined by averaging responses to each item. Q U [ S was given only at the end as a measure of overalluser interfacesatisfaction since the interfaces for the two systems were identical.
Librarians were recruited by advertising over several librarian-oriented listservs in the Pacific Northwest. The advertisement explicitly stated that we sought information professionals with a library degree and that they would be
19
Q-Expression BB-ACB-BAA BD-ACI-BCA (slope = 0.5) BB-ACM-BCB (slope = 0.275) AB-BFC-BAA AB-BFD-BAA AB-BFE-BAA
Weighting Type TFIDF Pivoted Norm. Pivoted Norm. Okapi Okapi Okapi
Average Precision 0.2129 0.2853 0.2821 0.3612 0.3850 0.3517
% Improvement 0% 34% 33% 70% 81% 65%
Table 1 - Average precision and improvement for different Q-expressions (with corresponding weighting type) on batch runs using TREC-6 and TR.EC-7 interactive data.
Variable ] Definition Study Design Type I Librarian vs. medical informatics graduate student Topic [ Topic number System [ Search system used (Okapi vs. TF*IDF) Intermediate Outcomes Documents saved by user Saved Document recall (relevance defined as having one or more instance) DocRec Time in seconds for search Time Number of unique terms used for topic Terms Number of documents viewed for topic Viewed Number of documents seen for topic Seen Number of search cycles for topic Cycles Average of all QUIS scores quIs Demographic/Experience Gender Male vs. female Age In years Years experience of on-line searching (1-1casts 5-most) Years Experience with point and click interface (1- least, 5- most) Point Experience using on-line library catalogs (1- least, 5- most) Catalogs Experience using CD-roms (1- least~ 5- most) CDROM Experience searching commercial on-line systems (1- leastt 5- most) Online Experience searching Web (1- least, 5- most) WWW How often searching done (1- least, 5- most) Frequency How enjoyable searching is (1- least~ 5- most) Enjoy Cognitive I Paper folding test to assess spatial visualization VZ2 I Nonsense syllogisms test to assess logical reasoning RL1 Advanced vocabulary test I to assess verbal reasoning V4 Post-topic User familiar with topic (1-1east~ 5-most) Familiar EasyStart Search was easy to get started (1-least~ 5-most) Search was easy to do (1-1east, 5-most) EasyUse User was satisfied with results (1-1east, 5-most) Satisfied User had confidence that all instances were identified (1-1east~ 5-most) Confident TimeAdequate ] Search time was adequate (1-1east, 5-most) Post-system System was easy to learn to use (l-least~ 5-most) SysEasyLeam System was easy to use (l-least, 5-most) SysEasyUse User understand how to use system (1-1east, 5-most) SysUnderstand Post-experiment User understand nature of experimental task (1-1east, 5-most) Understand Task had similarity to other searching tasks (l-least, 5-most) TaskSim TaskDiff Systems were different from each other (l-least, 5-most) Table 2 - Data collected during interactive searching experiments.
20
ssnam
......11|[~t]T 'I'
i~
Enter your query: [Cuban ~u,~azr ~r~pprt ~. . . . . . . . . . . . . . . . . . . .
TREC Search Results
~;
i ~
~ v e D~umen
Documents 1-50 matching "cuban sugar imports" shown below, sorted in decreasing order of relevance Click on icon to view document I~ FT 24 SEP 921 Commodities and Agriculture: Cuban sugar growers face more problems FT 17 J U N 93 / Commodities and Agriculture: 'End of an era' m sugar market FT 04 JAN" 921 World News in Brier Cubans fly to Florida [~ FT 08 SEP 92 / World Commodi~es Prices: Market Report FT 11 AUG 93 / Cuba raises prices in dollar shops FT 02 N O V 94 / Russia cuts off Cuba's oil supplies I~ F T 14 D E C 93 / Commodities and Agriculture: Russia to tax sugar ax~pon:s FT 13 M A Y 92 / Commodities and Ag'iculmre: Sugar organisation cuts estimate of surplus output [~ FT 23 A_PR 93 / World Trade News: Cuba barters its sugar L~FT 23 DEC 93 / Commodities and Agriculture: Broker forecasts tighter sugar market for 1994 FT 12 MAY 93 / Commodities and Agncul~re: Russia seen mnpomn8 less white sugar "FT 2~ ]TIT. 9q I Can.to to ~nen lm Cuha'~ ailin~
~)*"~ FT932-13q78 *,,t. FT 23 A P R 93 / g o r l d T r a d e News: C u b a b a r t e r s its s u g a r By H A i G S I N O N I A N HILAN I T A L G R A N I , ehe I t a l i a n c e r e a l s a n d f o o d s g r o u p b a s e d in N a p l e s ~ has s i g n e d a L l O O b n (Pounds 42m) a g r e e m e n t w i s h C u b a to s u p p l y s e m i - f l n l s h e d food p r o d u c t s in r e t u r n for sugar, w r i t e s H a i g S i m o n i a n in Hilan. The d e a l is a f u r t h e r s i g n of the c u r r e n u r e v i v a l in c o u n t e r t r a d e for c o u n t r i e s w l t h p r o b l e m s o h E a l n l n g h a r d c u r r e n c i e s or in e c o n o m l c difficultles. T h e C u b a n e c o n o m y has f a c e d a g r o w l n g c r i s i s f o l l o w l n g t h e g r a d u a l w i t h d r a w a l of a i d a n d s u p p l i e s f r o m the f o r m e r S o v i e t Union. It h a s a l s o s u f f e r e d f r o m the fall in p r i c e of s o m e r a w - m a t e r l a l e x p o r t s , n o t a b l y sugar. I t a l g r a n l rill s u p p l y c e r e a l s e v e g e t a b l e o i l s a n d p a s t a p r o d u c t s s ~ o r t h a b o u t LIOObn, in r e t u r n for ~ud~an s u g a r of a s i m i l a r v a l u e . I t a l g r a n 1 ' s deal, d o u b l e the s i z e of a s i m i l a r o n e b e t w e e n J u l y a n d Novez~oer last year, ~ill t a k e e f f e c t in the s e c o n d half of ~ h i s year. Companies:Italgrani.
Countr i e s : COZ
Cuba,
Caribbean.
Figure 2 - Searching interface.
After the experiments were completed, data was organized into a per-question format with all associated attributes. Our initial analysis used instance recall as the dependent variable influenced by the data points in Table 2 as independent variables. To address the question of whether there was a significant difference between the Okapi and TF*IDF systems, an analysis of variance (ANOVA) model was fit to instance recall for study design data. The factors in the model included type of searcher, the individual ID (nested in type), system, and topic. In the analysis, ID and topic were random factors, while type and system were fixed factors. Two-factor interactions (among system, topic, and type) were also included in the analysis. Residuals were examined for deviations from normality. All analyses were run in Version 6.12 of SAS for Windows 95.
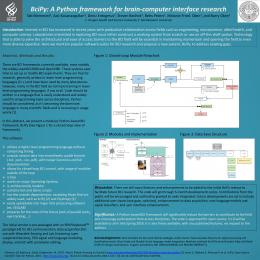
were highly experienced in using a point-and-click interface as well as on-line and Web searching. Table 3 shows instance recall and precision comparing systems and user types. While there was essentially no difference between searcher types, the Okapi system showed an 18.2% improvement in instance recall and an 8.1% improvement in instance precision, both of which were not statistically significant. Table 4 shows the pvalues for the ANOVA model. Of importance was that while the difference between the systems alone was not statistically significant, the interaction between system and topic was. In fact, as shown by Figure 3, all of the difference between the systems occurred in just one query, 414i, which is one of the queries shown in Figure 1.
4. Verifying weighting scheme with current data Results The next experiment was to verify that the improvements in batch evaluation detected with TREC-6 and TREC-7 data held with TREC-8 data. It may have been possible that the benefit of Okapi weighting did not materialize with the latter, thus rendering the result in the second experiment not applicable to determining whether improvements in batch searching results hold up with real users.
A total of 24 searchers consisting of 12 librarians and 12 graduate students completed the experiment. The average age of the librarians was 43.9 years, with seven women and five men. The average age of the graduate students was 36.5 years, with eight women and four men. All searchers
21
Instance Recall
Instance Precision
0.33 0.39
0.74 0.80
0.36 0.36
0.76 0.78
System Baseline Okapi Type Librarian Graduate Student
Table 3 - Instance recall and precision across systems and user types. Source System
P-value 0.226
Topic Type ID(Type) System * Topic System * Type Topic * Type
0.052 0.914 0.052 0.027 0.088 0.108
Table 4 - Summary of analysis of variance model for instance recall.
1.0
Okapi batch benefit
=
TFIDF
=
+38.7%
0.8
+21.3% +318.5%
0.6
+6.8% 0.4
Okapi
-56.6%
++ +
+
0.2
0.0 408i
414i
428i
431i
438i
446i
Figure 3 - Instance recallfor each topic. The point values show the mean and confidence intervalsfor users with Okapi (circular point) and TFIDF (square point) weighting. In italicsare the change in average precision for Okapi over TFIDF weighting. Me~ods
Okapi AB-BFD-BAA still outperformed the baseline system, BB-ACB-BAA, but by the lesser amount of 17.6%. This happened to be very similar to the difference in instance recall noted in the second experiment.
The batch runs for the baseline and Okapi systems from the firstexperiment were repeated using the same approach of developing a testcollectionby designating all documents as relevantto the query where one or more instanceswere identifiedwithin it.
One possible reason for the smaller gains on the TREC-8 vs. TREC-6 and TREC-7 queries was that the average number of relevant documents for a TREC-8 query was three times higher than a query in the TREC-6 or TREC-7 sets. On average, TREC-6 interactive queries had 36 relevant documents, TREC-7 had queries 30 relevant documents, and TREC-8 queries had 92 relevant
Resu~s Table 5 liststhe average precision for both systems used in the user studies along with percent improvement. The
22
documents. The higher number of relevant documents may have given the baseline TF*IDF system a better chance of performing well, narrowing the gap between the different ranking schemes.
While none of the Demographic/Experience, Cognitive, Post-Searching, or Post-Experiment variables were associated with higher instance recall, three of the PostSearching variables were. We found that the higher familiarity the user expressed with a topic, the lower instance recall they obtained (p < .001). The meaning of the inverse relationship between familiarity with the topic and instance recall is unclear, though perhaps suggests that users knowledgeable about the topic were less likely to search comprehensively. Ease of doing the search (p = .003) and confidence that all instances were identified (p = .01) were, however, associated with successful searching.
Also noteworthy in these results is that while query 414i achieved the second-best improvement of the six in average precision, it was far less than the improvement for 428i, which showed no improvement in the user studies. In fact, two queries showed a decrease in performance for Okapi with no difference in the user studies.
5. Assessment of other factors predictive of searching success
6. Discussion
Since the IR system used was not predictive of instance recall, we next looked at all of the variables listed in Table 2 to see if any of them was associated with successful searching.
Our experiments show that batch and user searching experiments do not give the same results. This outcome is limited by the fact that we only assessed one type of user searching with only six queries. Nonetheless, it calls into question whether results from batch studies should be interpreted as a definitive assessment of system performance. The ultimate answer to the question of whether these two approaches to evaluation give the same results must ultimately be answered by filrther experiments that use a larger number of queries and more diverse user tasks.
Methods All of the variables in Table 2 for each search were treated as covariates in the base ANOVA model, including subject demographic characteristics, cognitive test results, postsearching questionnaire responses, and exit questionnaire responses. Each individual covafiate was added one at a time to examine its contribution to the model. Each was treated as a scale variable, even if it was ordinal or eategorieal. We also focused explicitly on the intermediate outcomes of documents saved, document recall, number of documents viewed, and number of documents seen by developing a separate ANOVA model to assess their association with instance recall.
Another observation from this work is that simple statistical analyses may obscure more complex situations. In particular, just performing a simple t-test on the overall means in Table 4 could lead one to conclude that retrieval systems which perform better in hatch studies also do so in user studies. However, our more statistically proper ANOVA model showed that the difference was not statistically significant and occurred solely due to one query, 414i. The mason for this query being an outlier is not clear, as the subject matter for this query was not markedly different from the others. The only difference was that it had far fewer relevant documents than the rest, making it more likely to amplify random differences in user search strategies.
Resu~ A number of variables were associated with instance recall in a statistically significant manner. Intermediate outcome measures that were associated in a statistieaUy significant manner included: 1. Saved - the number of docurnents saved by the user as containing an instance (p < .001) 2. DoeRec - document recall (with document relevance defined as one containing one or more instances) (p < .001) 3. Seen - the number of documents seen by the user (p = .002)
Additional analysis of the data also presents a more complex picture of real-user searching. For example, user familiarity with a topic was shown to vary inversely with searching performance. While this may be an artifact of the laboratory-based study design, it could also indicate that users may be lulled into a false sense of security about topics for which they have underlying knowledge. Further study of this outcome is indicated to address user performance under varying baseline familiarity with a topic.
Figures 4a-4c show the linear fit of the intermediate outcome variables. The first result raises the possibility that an intermediate measure, number of documents saved by the user, could be used to measure searching outcome without the labor-intensive relevance judgments to measure instance recall. Our findings also indicate that the quantity of relevant (containing an instance) documents retrieved is associated with ability to perform the instance recall task. They also indicate that success at the instance recall task is related to the number of doeurnents that the user pulls up the full text to read, adding credence to the (unpublished) observation that the ability to succeed at the instance recall task is related to reading speed.
The results of this paper reinforcethe need for more user studies and caution against over-relianceon results obtained in batch studies. They also show thatthe T R E C evaluation milieu can be used for such studies. The advantage of T R E C is that is provides a standardized data set and experimental methodology for experimentation. In addition to participatingin futureT R E C interactivetracks, we also plan additionalexperiments with existingdata to verify the resultsof this study.
23
J. Chin, V. Diehl, and K. Norman, Development of an instrument measuring user satisfaction of the human-computer interface, Proceedings of CHI '88 - Human Factors in Computing Systems, New York, 213-218, 1988. C. Cleverdon and E. Keen, Factors determining the performance of indexin~ systems, Cranfield UK: Aslib Cranfield Research Project 1966. D. Harman, Overview of the first Text REtrieval Conference, Proceedings of the 16th Annual International ACM Special Interest Group in Information Retrieval, Pittsburgh, 36..47, 1993. W. Hersh, Relevance and retrieval evaluation: perspectives from medicine, Journal of the American Societyfor Information Science, 45: 201-206, 1994. E. Lagergren and P. Over, Comparing interactive information retrieval systems across sites: the TREC-6 interactive track matrix experiment, Proceedings of the 21st Annual International ACM SIGIR Conference on Research And Development in Information Retrieval, Melbroune, Australia, 162-172, 1998.
[1]
[2] [3]
[4]
[5]
C. Meadow, Relevance?, Journal of the American Societyfor Information Science, 36: 354-355, 1985. S. Robertson and S. Walker, Some simple effective approximations to the 2-Poisson model for probabilistic weighted retrieval, Proceedings of the 17th Annual International ACM Special Interest Group in Information Retrieval, Dublin, 232-241, 1994. A. Singhal, C. Buckley, and M. Mitra, Pivoted document length normalization, Proceedings of the 19th Annual International A CM Special Interest Group in Information Retrieval, Zurich, Switzerland, 21-29, 1996. K. Sparck-Jones, Information Retrieval Experiment. London: Butterworths, 1981. D. Swanson, Information retrieval as a trial-anderror process, Library Quarterly, 47: 128-148, 1977. I. Witten, A. Moffat, and T. Bell, Managing Gigabytes - Compressing and lndexing Documents and Images. New York: Van Nostrand Reinhold, 1994. J. Zobel and A. Moffat, Exploring the similarity space, SIGIR Forum, 32: 18-34, 1998.
[6]
References
[7]
[8]
[91 [10]
[11]
[12]
Query 408i 414i 428i 43 li
Instances 24 12 26 40
Rel. Documents 71 16 40 161
Baseline 0.5873 0.2053 0.0546 0.4689
Okapi 0.6272 0.2848 0.2285 0.5688
% Improvement 6.8% 38.7% 318.5% 21.3%
438i 446i Average
56 16 29
206 58 92
0.2862 0.0495 0.2753
0.2124 0.0215 0.3239
-25.8% -56.6% 17.6%
Table 5 - Average precision and improvement for each query in the batch runs with TREC-8 data.
1.0-
1.0-1
0.9-
""
•
1.0 -1
0.9-1
0.3-
0.9 - t
0.0-1
•
0.7-
=
0.8 .,t
•
0.7
0.6-
,~ o.~.
'
'
"i
:; ; "
'
:
''"
"
~
0.6-1
13~ 0.6 .-I
0.5,-I
0.4-
0.4-I
0.3-
o.~.~
o~.
":'":'!:
0,1.
".:1 =~,
0.0
.v 0
! 5
,:-
.
| 10
.
i 15
Saved
(a)
-
i 20
-
i 25
0.0
• 30
.
0.5 .-~ O.4 - t
,.:~.- I'--~. .,
0.1 ,-I
:|
; -
.
,
. J : ...';
o.2-1
.
- --
|.
°°1
.oo .~ .,'o .,~ go ~..~'o .I~ .,o DocRec
(b)
,
i
0.0
I 0
,
• , :" .
O.I ..4
I =
- i
:~:;.-'.
0.2 '-I
l.o"
"1'111 ~ :. i oo"
0.3 - I
5
10
15
20
2
30
35
40
45
Seen
(c)
Figures 4a-4c - Linear fit of relationship between instance recall and (a) number of documents saved, (b) document-level recall, and (c) number of documents seen.
24