Do computer tools improve statistical literacy? Arthur Bakker Instutute of Education
[email protected]
In this article Arthur Bakker describes some research he has conducted into the use of educational computer tools for improving statistical literacy. Further details may be found in Bakker, A. (2004). Design research in statistics education; On symbolizing and computer tools. Utrecht, the Netherlands: CD Beta Press. This can be ordered by emailing
[email protected] (17,50 euro excluding postage) or it can be downloaded from http://www.library.uu.nl/digiarchief/dip/diss/2004-0513-153943/inhoud.htm both as one large pdf-file (4 Mb) or as separate chapters. We would welcome comments/more extended articles on the issues raised in Arthur’s research – in particular on difficulties that specialist or non-specialist HE students have with coming to grips with distributions.
Design research in statistics education: On symbolizing and computer tools
T
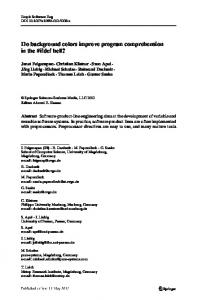
he present knowledge society requires statistical literacy, the ability to interpret, critically evaluate, and communicate about statistical information and messages [5]. However, research shows that students generally do not gain satisfactory statistical understanding (e.g. [9]). The research presented in this paper is a sequel to design research carried out by Cobb, McClain, and Gravemeijer [2] and aims to contribute to an empirically grounded instruction theory for statistics education in which educational computer tools are used. Computer software allows users to dynamically interact with large data sets and to explore different representations in ways that are impossible by hand. The computer tools used were the Statistical Minitools [1], which have been designed for middle school students (aged 10-14), but could be used with older students without a statistical background. One important end goal of instruction was that students would gain understanding of sampling and learn to use ‘shape’ to reason about distributions. In line with the theory of Realistic Mathematics Education [4], a central tenet was that learning mathematics should be a meaningful activity. The research questions were:
1. How can students with little statistical background develop a notion of distribution? 2. How does the process of symbolizing evolve when students learn to reason about distribution? In the latter question, ‘symbolizing’ refers to the reflexive process of making symbols and mentally constructing the objects which they represent. The design research consisted of five cycles of three phases: a design phase, a teaching experiment, and a retrospective analysis. Prior to these cycles, historical and didactical phenomenological analyses [3] were carried out as well as exploratory interviews. The historical study gave rise to hypotheses that were partially tested in the teaching experiments carried out in grades 7 and 8 (12 to 14 years old). In the design phase, a so-called hypothetical learning trajectory [7] was formulated, which was tested and revised in the subsequent cycles of design research. The recurring activity of discussing 1
MSOR Connections Feb 2005 Vol 5 No 1
Do computer tools improve statistical literacy?
Arthur Bakker
growing samples proved useful to support reasoning about distribution and sampling. For the analyses of students’ learning, a method was used similar to the constant comparative method [8]. It turned out that students conceived distributions as ‘bumps’ consisting of a small group of low values, a large group of ‘average’ values, and a small group of high values.
References [1] Cobb, P., Gravemeijer, K.P.E., Bowers, J., & Doorman, M. (1997). Statistical Minitools [applets and applications]. Nashville & Utrecht: Vanderbilt University, TN & Freudenthal Institute, Utrecht University. [2] Cobb, P., McClain, K., & Gravemeijer, K.P.E. (2003). Learning about statistical covariation. Cognition and Instruction, 21, 1-78. [3] Freudenthal, H. (1983). Didactical phenomenology of mathematical structures. Dordrecht, the Netherlands: Reidel. [4] Freudenthal, H. (1991). Revisiting mathematics education: China lectures. Dordrecht, the Netherlands: Kluwer Academic Publishers. [5] Gal, I. (2002). Adult’s statistical literacy: meanings, components, responsibilities. International Statistical Review, 70(1), 1-51. [6] Peirce. (1976). The New Elements of Mathematics by Charles S. Peirce (Vol. I-IV). The Hague-Paris/Atlantic Highlands, N.J., 1976: Mouton/Humanities Press. [7] Simon, M. A. (1995). Reconstructing mathematics pedagogy from a constructivist perspective. Journal for Research in Mathematics Education, 26, 114-145. [8] Strauss, A., & Corbin, J. (1988). Basics of qualitative research. Techniques and procedures for developing grounded theory. Thousand Oaks, CA: SAGE Publications. [9] Zawojewski, J.S., & Shaughnessy, J.M. (1999). Data and chance. In E.A. Silver & P.A. Kenney (Eds.), Results from the seventh mathematics assessment of the National Assessment of Educational Progress (pp. 235-268). Reston, VA: National Council of Teachers of Mathematics.
Peirce’s semiotics [6] proved useful for analyzing students’ process of symbolizing, in particular, his notions of hypostatic abstraction and diagrammatic reasoning. Hypostatic abstraction refers to the transition from a predicate to a new abstract object (“the dots are spread out” to “the spread is large”). Diagrammatic reasoning consists of three steps: making a diagram, experimenting with it and reflecting on the results. The research shows the importance of letting students make their own diagrams and discussing these. The computer tools seemed most useful during the experimentation phase. Remarkably, the best diagrammatic reasoning occurred only during class discussions without computers around. One recommendation is: only invest in using computer tools if all educational factors such as teaching, end goals, instructional activities, tools and assessment are tuned to each other. Though the research was carried out with middle school students, many of its results are likely to be equally important for older students or employees with little statistical background.
2
MSOR Connections Feb 2005 Vol 5 No 1