such as keys on a messy desk or one's car in a parking lot, one is performing a visual ..... Stimuli were displayed on a Mitsubishi Diamond. Pro monitor running at ...
Journal of Experimental Psychology: Human Perception and Performance 2005, Vol. 31, No. 4, 643– 667
Copyright 2005 by the American Psychological Association 0096-1523/05/$12.00 DOI: 10.1037/0096-1523.31.4.643
Do Multielement Visual Tracking and Visual Search Draw Continuously on the Same Visual Attention Resources? George A. Alvarez
Todd S. Horowitz
Harvard University
Harvard Medical School and Brigham and Women’s Hospital
Helga C. Arsenio
Jennifer S. DiMase
Massachusetts General Hospital
Yale University
Jeremy M. Wolfe Harvard Medical School and Brigham and Women’s Hospital Multielement visual tracking and visual search are 2 tasks that are held to require visual–spatial attention. The authors used the attentional operating characteristic (AOC) method to determine whether both tasks draw continuously on the same attentional resource (i.e., whether the 2 tasks are mutually exclusive). The authors found that observers can search and track within the same trial significantly better than would be predicted if the 2 tasks were mutually exclusive. In fact, the AOC for tracking and search is similar to that for tracking and auditory monitoring. The results of additional experiments support an attentionswitching account for this high level of dual-task performance in which a single attentional resource is efficiently switched between the tracking and search. The results provide important constraints for architectures of visual selective attention and the mechanisms of multielement tracking. Keywords: tracking, search, attention, dual task, attention operating characteristic
ms per item (Wolfe, 1998). This cost of each additional item is evidence that the deployment of spatial attention in visual search is capacity limited. The multielement visual tracking task is illustrated in Figure 1. In the tracking task, a number of disks move around the display. A subset of these disks is cued, and the observer is instructed to keep track of that subset, typically for several seconds. At the end of the trial, the observer is asked to identify the tracked set or to categorize individual items as tracked or untracked. This task has also been shown to be capacity limited, as observers can only track about four or five objects in this task (Pylyshyn & Storm, 1988). Both tracking and search tasks require observers to select spatially localized items and to continue selection over some period of time. In search, the selection either moves from item to item or is distributed over some set of items. In tracking, items are selected for the duration of a trial. What happens if one tries to do both tasks at the same time? Can one search while one tracks? As reported here, the answer will turn out to be yes. Specifically, we have found that it is possible to suspend tracking for as much as 300 ms at a time, perform visual search, and then recover tracked items that have continued to move while the search task was performed. This is evidence of very flexible control of visual– spatial attention by a central executive. This need not have been the answer. In order to explain tracking performance, Pylyshyn (1989; Pylyshyn & Storm, 1988) introduced the idea of a limited number of spatial indexes (or fingers of instantiation; FINSTs) that can travel with a limited number of tracked objects. Other views envision multielement visual tracking as the attentional tracking of a single moving and deforming object
In this world, many tasks compete for humans’ attention often over the same extended period of time. In this article, we consider how humans handle the simultaneous demands of two tasks that utilize seemingly similar resources of visual–spatial attention. The tasks are visual search and multielement visual tracking. When one looks for something and is not sure where to find it, such as keys on a messy desk or one’s car in a parking lot, one is performing a visual search task. Even when the object one is searching for is clearly visible, time is required to inspect the scene and locate the item of interest. This indicates that humans cannot simultaneously identify all of the objects in a scene and that attention must be directed to areas or objects of interest to locate the target. A limited set of attributes can guide the deployment of attention to the relevant items (e.g., blue cars if one’s car is blue; Egeth, Virzi, & Garbart, 1984; Wolfe, Cave, & Franzel, 1989). However, guidance merely limits the set of candidate targets. Within that set, items are processed at a rate equivalent to 25–50
George A. Alvarez, Department of Psychology, Harvard University; Todd S. Horowitz and Jeremy M. Wolfe, Department of Ophthalmology, Harvard Medical School, and Department of Ophthalmology, Brigham and Women’s Hospital, Boston, Massachusetts; Helga C. Arsenio, Center for Women’s Mental Health, Massachusetts General Hospital, Boston, Massachusetts; Jennifer S. DiMase, Department of Psychology, Yale University. Correspondence concerning this article should be addressed to George A. Alvarez, Department of Psychology, Harvard University, 33 Kirkland Street, 7th floor, Cambridge, MA 02138. E-mail: geoalvarez@wjh .harvard.edu 643
644
ALVAREZ, HOROWITZ, ARSENIO, DIMASE, AND WOLFE
tracking and visual search within a trial appears to enable the high degree of dual-task performance.
AOC Methods
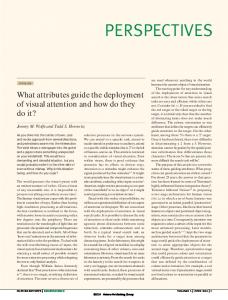
Figure 1. A typical multielement visual tracking task. a: On each trial, a subset of objects are briefly identified for tracking. The lines around the circles signify the circles blinking off and on to identify them as targets b: The objects move at a constant rate colliding with other objects and bouncing off the edges of the display. The arrows connected to the circles indicate the direction in which each object is moving. c: Observers select the targets by clicking on them with the mouse pointer (as shown by the small arrow pointing toward an object). The gray circle indicates that the item has been selected.
with its vertices marked by the positions of the tracked disks (Yantis, 1992). Both classes of model assume continuous use of resources throughout a tracking epoch. Withdrawing resources from the tracking task should result in a loss of the tracked targets. Of course, it could be that visual indexes are unrelated to the resources used in visual search. Because it turns out to be possible to perform a demanding tracking task and a difficult search task in the same trial, we report several experiments that seek to distinguish the hypothesis that tracking and search use entirely different resources from the hypothesis that they cleverly share a common and limited ability to select visual stimuli.
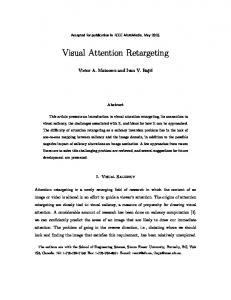
Sperling and his colleagues (Sperling & Dosher, 1986; Sperling & Melchner, 1978) derived the AOC method from the receiver operating characteristic analysis of classical signal detection theory. The AOC is a method for assessing the extent to which two tasks use the same resources. In receiver operating characteristic analyses, hits are plotted against false alarms, and the observer’s bias toward responding yes or no is allowed to vary. In AOC analysis (see Figure 2), two tasks, X and Y, are performed both separately and under dual-task conditions. Single-task performance is plotted on the axes and then projected into the dual-task plane as horizontal (Task Y) and vertical (Task X) lines. Thus, the space for dual-task performance is defined by the single-task performance on each task. Dual-task performance on Task Y is then plotted as a function of dual-task performance on Task X. If Task X and Task Y are completely independent, then dual-task performance on both tasks will be equal to single-task performance. The resulting data point would fall at the point where the two single-task lines meet. This point, called the independence point, is labeled a on Figure 2. Occasionally, two tasks will
Plan of This Article The bulk of the experiments in this article use the attention operating characteristic (AOC) methodology pioneered by George Sperling and his colleagues (Sperling & Dosher, 1986; Sperling & Melchner, 1978). The AOC is a method for assessing the extent to which two tasks use the same resources. The first section of this article reviews AOC methods as they apply to the present studies. In Experiment 1, we examine AOC functions obtained when each type of task is pitted against a similar version of the same task (e.g., two tracking tasks or two search tasks). These results allow us to establish what the AOC function would look like for tracking and visual search if they were mutually exclusive. With this context established, we can interpret the data from Experiments 2– 4, in which observers performed tracking and visual search in the dual-task paradigm. To anticipate our results, performance on concurrent tracking and search tasks is consistently better than would be predicted by a trade-off between two mutually exclusive tasks. In Experiment 5, we asked observers to perform a tracking task concurrently with an auditory task that should demand no visual attention resources whatsoever. The AOC analysis of dualtask performance for tracking and this auditory task is qualitatively similar to that observed for tracking and visual search. Why is performing a visual search task while tracking no worse than performing an auditory monitoring task? One possibility is that tracking and visual search do not draw on the same visual attention resource. Alternatively, the two tasks might draw on the same attentional resource but might use that resource in alternation during the course of a trial. Experiments 6 –9 provide evidence supporting this second hypothesis: Attention switching between
Figure 2. The attentional operating characteristic. Dual-task performance on Task X is plotted against performance on Task Y. The vertical and horizontal lines mark single-task performance on Tasks X and Y, respectively. The diagonal line indicates the trade-off line assuming that X and Y are mutually exclusive and have linear performance-resource functions (see text). The dotted line indicates the trade-off line assuming mutual exclusivity and negatively accelerated performance-resource functions. Point a is the independence point, indicating that X and Y can be performed jointly with no loss of performance relative to single-task performance. Point b illustrates dual-task performance, which is superior to single-task performance for both X and Y. Point c is a point on the linear trade-off line. Assuming a linear trade-off line, Point d then indicates that the two tasks are not purely independent but far from mutually exclusive. However, Point d would indicate mutual exclusivity assuming the dotted trade-off line.
TRACKING AND SEARCH
actually complement each other in such a way that performance on one or both tasks improves, relative to single-task performance, when they are performed together. In this case, the data will fall outside of the space defined by the axes and the single-task performance lines, as represented by Point b. More commonly, performance on one or both tasks suffers under dual-task conditions and falls somewhere inside the space defined by the singletask lines, illustrated by Points c and d. To interpret such results, we need to know where the data would fall if X and Y were mutually exclusive, that is, if they both demanded continuous allocation of the same resources. One intuitively appealing solution is shown by the solid diagonal line, representing a linear trade-off between X and Y. If this represents the line of mutual exclusivity, then dual-task data represented by Point c would indicate that X and Y required the exact same resources, whereas Point d would be consistent with the two tasks calling on separate or at least only partially overlapping resources. However, the diagonal line is not the only possible form of a trade-off between two tasks. Suppose performance on a task does
645
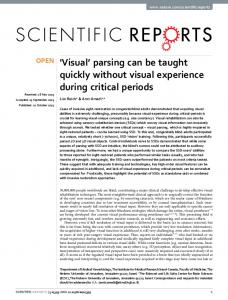
not improve linearly with the amount of resource devoted to the task. The performance-resource function relates the amount of attention devoted to a given task to performance on that task (Norman & Bobrow, 1975). The solid and dotted lines in Figure 2 differ in the shape of these assumed underlying performanceresource functions. A range of plausible performance-resource functions is shown in the top row of Figure 3. In Figure 3A, for example, performance is a linear function of attention; every additional arbitrary unit of attention devoted to the task yields an equal improvement in performance. Figure 3B shows a negatively accelerated function; allocating attention to the task initially yields large improvements in performance, but once a reasonable amount of attention is allocated, subsequent increments of attention yield diminishing returns. Figure 3C shows a positively accelerated function. More complicated performance-resource functions can be imagined but are not considered likely (Navon & Gopher, 1979). If two tasks require the same resources, then the AOC can be obtained directly from the two performance-resource functions
Figure 3. Different performance-resource functions and the attentional operating characteristics (AOCs) derived from them. The top row depicts linear (A), negatively accelerated (B), and positively accelerated (C) performance-resource functions (performance as a function of attentional resource) The second row illustrates the AOCs generated when two tasks (X and Y) with the same performance-resource function are performed concurrently and priority is varied from one task to the other (D: linear; E: negatively accelerated; F: positively accelerated). The third row illustrates what happens when tasks with differently shaped performance-resource functions are combined (G: Linear ⫻ Negatively Accelerated; H: Linear ⫻ Positively Accelerated; I: Negatively Accelerated ⫻ Positively Accelerated).
646
ALVAREZ, HOROWITZ, ARSENIO, DIMASE, AND WOLFE
(Braun & Julesz, 1998). The remaining two rows of Figure 3 show a variety of possible AOCs derived from the component performance-resource functions in the top row. Each AOC is generated by taking the performance on Task X at a given proportion of Attentional Resource A and plotting that against the performance for Task Y at 1 – A. The middle row of Figure 3 depicts AOCs for two tasks that share the same performance-resource function, corresponding to the performance-resource functions in the top row. So Figure 3D shows the AOC generated by two linear performance-resource functions and so on. The bottom row depicts performance-resource functions from two tasks that have different performance-resource functions. In Figure 3G, Task X has a linear performance-resource function and Task Y has a negatively accelerated performance-resource function, whereas Figure 3H plots a linear performance-resource function against a positively accelerated performance-resource function. Figure 3I shows the AOC derived from a negatively accelerated Task X and a positively accelerated Task Y. One point that these plots make quite obvious is that if two tasks have the same performance-resource function, the shape of the AOC is diagnostic of the underlying performance-resource functions. Another thing to notice is that if the underlying performanceresource functions are of a substantially different shape, the AOC tends to be asymmetrical, a pattern that Braun and Julesz (1998) remarked has never been observed. Within this theoretical framework, then, interpreting dual-task performance requires us to first define the space bounded by single-task performance and the line of mutual exclusivity. Measuring single-task performance is easy. These data define the independence point, and we can then test dual-task performance against the independence point. Determining the line of mutual exclusivity is somewhat trickier because there is no a priori way to know the underlying performance-resource functions. Here we exploited the properties of the AOCs depicted in Figure 3D, Figure 3E, and Figure 3F. We pitted one version of the task against a similar version of the same task and measured the resulting performance-resource functions and AOCs (e.g., in the case of tracking, displays consisted of white and black disks). In single-task conditions, observers were asked to track either a subset of the white disks or a subset of the black disks, ignoring disks of the other color. In dual-task conditions, observers tracked a subset of each color; which color has priority is varied across blocks. Because the two tasks are identical and demanding (we adjusted difficulty so that performance is below ceiling for either task alone), we assumed that they will be mutually exclusive. We then plotted the data for each task (track black or track white) as a function of priority to derive the performanceresource function. Of course, we did not know precisely how much attention was devoted to each task for a given observer in a given dual-task condition. However, because the tasks are identical, the shape of the AOC will be diagnostic of the underlying performance-resource functions: We hypothesized we should observe one of the shapes in the middle row of Figure 3. A similar procedure was used to derive the underlying performance-resource functions for visual search. Having plotted the performance-resource functions for tracking and for search, we estimated the AOC curve representing mutual exclusivity (i.e., what dualtask tracking and search performance would look like if the two tasks required continuous allocation of the exact same resources).
Finally, recall that we are interested principally in whether tracking and visual search share visual attention resources. We knew that two tasks can interfere with one another at many stages between the stimulus processing and response. As noted earlier, dual-task impairments are often attributed to a central or response selection stage. Indeed, interference between two tasks is often ascribed to a central bottleneck (Pashler, 1994). Therefore, in this article we also provide data illustrating the dual-task deficits produced by performing tracking and a tone discrimination task simultaneously. These data should be viewed as a qualitative, rather than quantitative, contribution to the map of AOC space, because of course we cannot guarantee that the downstream demands of visual search and tone discrimination are equal. Nevertheless they provide a useful benchmark against which dual-task tracking and search performance can be compared. How do we interpret the possible outcomes for dual-task performance of visual search and tracking? The simplest outcome would be independence, which would lead us to conclude that separate visual attention resources were involved. Mutual exclusivity (or worse) would indicate that the two tasks shared resources at some level; additional work would be required to pin down the locus of incompatibility. An intermediate degree of compatibility, such as that illustrated by Point d in Figure 2 (assuming a linear line of mutual exclusivity), would suggest that search and tracking called on some independent visual attention resources, though they also might share some resources. The locus of the residual shared resources could not be pinned down with certainty. However, if the compatibility of tracking and visual search is comparable with the compatibility of tracking and an auditory task, then we would be reasonably confident that the locus of interference was at a more central level than the level of visual attentional selection.
General Methods Participants All observers were between the ages of 18 and 55, gave informed consent, and were paid $10 per hour for their participation. Each observer passed Ishihara’s Tests for Color-Blindness and had 20/25 corrected vision or better. Participants were naive as to the purpose of the experiment. Unless stated otherwise, 10 observers participated in each experiment.
Apparatus All experiments reported in this article were run on Apple Power Macintosh computers. Stimuli were displayed on a Mitsubishi Diamond Pro monitor running at a frame rate of 100 Hz and viewed from a distance of 57 cm. Tracking responses were recorded via the mouse, and search responses were recorded via the ADB keyboard. Experiments 1–3 were programmed in C using the VisionShell libraries created by Raynald Comtois (2004). The remaining experiments were programmed in MATLAB using the Psychophysics Toolbox (Brainard, 1997; Pelli, 1997).
Stimuli Unless specified otherwise, the tracking stimuli consisted of 10 white disks (radius ⫽ 1.5° visual angle) presented on a gray background subtending 32° ⫻ 24°.
TRACKING AND SEARCH
Procedures Staircase Procedures In several experiments, we adjusted task or stimulus durations using a staircase procedure to equate performance across observers. In all such cases, we used a variant of the two-up, one-down staircase in which the duration is decreased by a single step following a correct response and increased by a double step following an incorrect response. Asymptotic duration using this method will yield 66.7% correct responses (Kaernbach, 1991). The staircase ran until 20 reversals were obtained. The staircase asymptote value was estimated by taking the average of the last 10 reversals.
Tracking Procedures At the beginning of a trial, the disks were located in pseudorandom positions within a 6 ⫻ 5 grid subtending 32° ⫻ 24°. The disks remained stationary for an initial 2 s. In tracking conditions, a subset of five disks flashed off and on during this initial period to identify them as targets for tracking. In other conditions, the disks were presented constantly during this initial period. In all conditions, all disks then began to move, each in a random initial direction and at a constant rate of 9° per second. Disks bounced off of the edges of the display and exchanged direction with other disks following a collision. After several seconds (duration was fixed within each experiment but varied slightly across experiments), the disks stopped moving and observers gave their responses. After the disks stopped moving, observers were asked to identify the five disks they had tracked. They had to click on five disks before the next trial was initiated. Figure 4 shows schematic diagrams of the dual-task displays in each experiment.
Data Analysis Tracking accuracy was analyzed two ways. First, we analyzed the percentage of correct responses. For example, if a subject correctly iden-
647
tified an average of 3.5 out of 5.0 disks on each trial, this would represent 70% correct performance. However, we also analyzed the data in terms of the percentage of trials on which all disks were correctly identified. This criterion, although draconian, has two virtues. First, in Experiment 6 we needed to staircase tracking difficulty. A staircase requires a binary classification of trials. We classified trials as correct for these purposes only when the observer accurately identified all of the cued disks (though of course we recorded the precise number of missed targets). Second, requiring observers to correctly identify all of the tracked disks is a very conservative measure. If a concurrent visual search task reduced tracking capacity by a single item, this might not seem dramatic in terms of percentage of correctly identified items, but it would have a more noticeable effect in terms of the number of trials on which all items were correctly identified.
Normalization To present all tasks on a common scale, we normalized accuracies using a rescaling procedure. We set single-task accuracy to 100, chance accuracy to 0, and then scaled dual-task accuracy to maintain a constant ratio between single-task accuracy and chance [normalized score ⫽ (dual-task accuracy – chance) / (single task accuracy – chance) ⫻ 100]. For example, say single-task accuracy is 70% correct, chance accuracy is 50% correct, and dual-task accuracy is 60% correct. Note that dual-task performance is halfway between chance and single-task accuracy in this example. The normalized scores would be 100 for the single task, 0 for chance, and 50 for the dual task. Thus, the normalization procedure preserves the relative level of performance, scaling dual-task accuracy to keep it halfway between chance and single-task performance in this example. Some readers may wish to refer to the raw percentage correct scores, which are supplied along with the corresponding normalized scores for each experiment and each condition reported in this article (see Tables 1, 2, and 3). Chance accuracy in all visual search tasks was 50%, as was chance accuracy in the tracking task when the percentage of targets tracked was used as the measure of tracking accuracy. When the measure of tracking accuracy was the percentage of trials in which all targets were accurately tracked, chance was the probability of correctly identifying all of the targets by randomly guessing (e.g., guessing all 5 target disks out of 10 disks ⫽ 5⁄10 ⫻ 4⁄9 ⫻ 3⁄8 ⫻ 2⁄7 ⫻ 1⁄6 ⫽ 0.4%, nearly 0%).
Hypotheses
Figure 4. Schematic depictions of the dual-task conditions in Experiments 1– 4. 1a: Observers tracked 5 of 10 white disks and 5 of 10 black disks. 1b: Observers reported the presence of a black E or N among black distractor letters and the orientation of a white T among white Ls. 2: Observers tracked 5 of 10 white disks while simultaneously searching for an E or N among four distractor letters (positioned randomly on disks). 3: Observers tracked 5 of 10 white disks while simultaneously searching for a T among Ls. All letters appeared on tracked items or on untracked items. 4: Observers tracked 5 of 10 white disks while simultaneously searching a spatially separate set of letters for an E or an N. The arrows connected to the circles indicate the direction in which each object is moving. The small arrow pointing toward an object indicates the mouse pointer.
The analysis of the normalized results concentrated on tests of two null hypotheses: mutual exclusivity and complete independence. These two hypotheses were derived from AOC theory as described above. The mutual exclusivity hypothesis predicts that dual-task accuracy will fall somewhere along the trade-off line connecting the two single-task data points in AOC space (see Figure 2). The plausibility of this trade-off function is established in Experiment 1. This hypothesis states that the average distance between the dual-task point and the trade-off line will be zero (as for Point c in Figure 2, assuming a linear trade-off function). If performance is significantly above the trade-off line, we can reject the mutual exclusivity hypothesis. Note that if dual-task performance fell below the trade-off line, this would not be evidence against mutual exclusivity. Therefore, points below the trade-off line were assigned negative distances. We also tested dual-task accuracy against the complete independence hypothesis, which predicts that dual-task accuracy will be as high for each task in the dual-task condition as in the corresponding single-task condition. This hypothesis states that the average distance between the dual-task point and the independence point will be 0 (as for Point a in Figure 2). If dual-task performance falls below single-task performance on either task (less than 100), the distance between the dual-task data point and the independence point is assigned a positive value. Note that if dual-task
ALVAREZ, HOROWITZ, ARSENIO, DIMASE, AND WOLFE
648
Table 1 Percentage Correct and Normalized Accuracy for Tracking Performance Based on the Percentage of Targets Accurately Tracked
Condition
Percentage correct
Normalized score
M
M
SE
100.0 82.4 16.0 ⫺18.8
13.2 10.5 8.0
SE
Experiment 1a: Black targets Black alone Dual task—Priority black Dual task—Priority equal Dual task—Priority white
76.8 71.5 54.6 45.4
3.1 4.1 3.1 1.4
Experiment 1a: White targets White alone Dual task—Priority black Dual task—Priority equal Dual task—Priority white
82.3 51.7 62.2 78.8
3.4 1.2 2.9 2.8
100.0 5.7 40.9 91.5
3.8 9.9 6.1
tasks combined. We devised displays consisting of two sets of stimuli, one black and one white, supporting tracking (Experiment 1a) or visual search (Experiment 1b). Observers could be asked to perform the task on stimuli of one color, ignoring stimuli of the other color, or to allocate attention to both sets in varying degrees. We assumed that the two tasks of the same type are mutually exclusive. Thus, for example, when observers allocate 90% of their attention to the black stimuli, this would be equivalent to allocating 10% of their attention to the white stimuli. Therefore, we can measure the performance-resource functions by plotting performance on each color as a function of the priority allocated to that color. We can also plot the white-versus-black AOC. The shape of the AOC serves as a check on the shape of the performanceTable 2 Percentage Correct and Normalized Accuracy for Tracking Performance Based on the Percentage of Trials With All Targets Accurately Tracked Percentage correct
Experiment 2 Track alone Dual task
90.8 89.2
3.6 3.9
100.0 93.5
Condition
M
SE
Normalized score M
SE
100.0 105.2 19.1 3.0
46.6 13.7 6.4
9.2 0.5 3.9 7.5
100.0 1.4 24.9 93.0
2.6 7.6 20.5
9.3 8.7
100.0 88.8
9.6
3.5 2.0 5.8 6.7 8.4
100.0 100.0 81.2 75.7 78.0
4.4 6.3 8.4
6.7 6.5
100.0 76.0
5.8
8.5 7.4 7.9 9.1
100.0 93.9 101.0 81.9
11.0 6.7 13.4
5.3 5.7
100.0 81.2
9.1
4.5 Experiment 1a: Black targets
Experiment 3 Tracking alone (letters in) Tracking alone (letters out) Dual task mixed (letters in) Dual task mixed (letters out) Dual task blocked (letters out)
97.6 98.0 93.7 92.9 92.3
0.8 0.5 1.5 1.8 2.9
100.0 100.0 91.5 89.1 87.8
2.1 3.1 5.6
Experiment 4 Track alone Dual task
94.1 88.0
1.9 2.1
100.0 86.5
3.8
Black alone Dual task—Priority black Dual task—Priority equal Dual task—Priority white
87.0 86.7 87.2 84.6
White alone Dual task—Priority black Dual task—Priority equal Dual task—Priority white
91.9 87.3
40.0 0.8 8.8 30.8 Experiment 2
2.5 2.2 2.5 3.1
100.0 99.8 100.8 93.3
2.9 3.9 6.4
Experiment 7 Track alone Dual task
7.3 6.8 3.7 0.4
Experiment 1a: White targets
Experiment 5 Track alone Dual task—Priority track Dual task—Priority equal Dual task—Priority tone
28.8 20.8 5.4 0.4
1.6 1.9
100.0 89.4
4.5
Track alone Dual task
68.9 64.0 Experiment 3
Track alone (letters in) Track alone (letters out) Dual task—Mixed in Dual task—Mixed out Dual task—Blocked out
89.2 91.0 73.5 69.8 72.3 Experiment 4
performance on both tasks is above the independence point (greater than 100 on both tasks), this would not be evidence against complete independence, and such points would be assigned negative distances. If the distance between the dual-task data point and the independence point is significantly greater than zero, we can reject the complete independence hypothesis.
Experiment 1—Tracking Versus Tracking and Search Versus Search The purpose of Experiment 1 is to measure the performanceresource functions for tracking and visual search, which will allow us to predict what mutual exclusivity would look like for these two
Track alone Dual task
76.1 56.9 Experiment 5
Track alone Dual task—Priority track Dual task—Priority equal Dual task—Priority tone
53.8 48.8 52.8 45.6 Experiment 7
Track alone Dual task
61.8 49.6
TRACKING AND SEARCH
Table 3 Percentage Correct and Normalized Accuracy for Search and Tone Monitoring Percentage correct Condition
M
SE
Experiment 1a—Tracking Versus Tracking Method
Normalized score M
SE
100.0 82.3 50.2 11.0
11.2 13.5 10.1
100.0 16.6 54.9 78.2
13.1 10.6 11.7
100.0 48.4
10.4
100.0 86.7 67.6 69.1
17.7 20.3 10.6
100.0 53.3
7.1
100.0 48.9 53.0 62.6
8.8 9.4 8.7
100.0 66.6
7.6
Experiment 1b: Search (black target) Black alone Dual task—Priority black Dual task—Priority equal Dual task—Priority white
74.1 69.5 61.9 52.3
2.4 3.2 3.8 2.2
Experiment 1b: Search (white target) White alone Dual task—Priority black Dual task—Priority equal Dual task—Priority white
73.8 54.5 62.6 69.1
2.1 2.6 2.5 3.5
Experiment 2: Search Search alone Dual task
79.3 64.0
1.5 3.0
Experiment 3: Search Search alone Dual task—Mixed in Dual task—Mixed out Dual task—Blocked out
75.1 70.2 63.5 66.2
2.4 3.1 2.8 1.7
Experiment 4: Search Search alone Dual task
82.6 67.2
2.6 2.7
Experiment 5: Tone Tone alone Dual task—Priority track Dual task—Priority equal Dual task—Priority tone
85.3 67.2 68.4 71.6
2.6 3.4 3.1 2.9
Experiment 7: Search Search alone Dual task
69.4 56.8
5.4 6.5
649
Stimuli. Ten white disks and 10 black disks (diameter ⫽ 2°) were presented on a gray background. At the beginning of a trial, the disks were located in pseudorandom positions within an 8 ⫻ 6 grid. The disks remained stationary for an initial 2 s in single-task conditions and for 4 s in dual-task conditions. Disks bounced off of the edges of the display and other disks of the same color. Thus, black disks bounced off of black disks, and white disks bounced off of white disks. When a black disk and a white disk occupied the same spatial location, the white disk occluded the black disk. Procedure. Observers first practiced tracking 5 of the 10 black targets without white distractors and then practiced tracking 5 of 10 white disks without black distractors. Then observers practiced tracking 5 of 10 black disks with 10 white distractors present followed by a set tracking 5 of 10 white targets with 10 black distractors present. Observers completed 10 trials in each practice condition (40 practice trials total) followed by 30 trials in each of five test conditions: single task black, single task white, dual task priority black, dual task priority white, and dual task priority equal. The order of conditions was counterbalanced across observers as follows: ABCDE, EDCBA, with the letters A, B, C, D, and E corresponding to one of the five conditions determined randomly for each individual observer. In the single-task black condition, the task was to keep track of 5 of the 10 black disks. In the single-task white condition, the task was to keep track of 5 of the 10 white disks. In each of the dual-task conditions, observers were required to perform both tasks. In the dual-task priority black condition, observers were instructed to prioritize tracking the black targets and if possible to keep track of the white targets as well. In the dual-task priority white condition, observers were instructed to prioritize tracking the white targets and if possible to keep track of the black targets as well. Finally, in the dual-task priority equal condition, the observers were instructed to give equal priority to tracking each subset. In conditions in which black targets were tracked, a subset of five black disks flashed off and on during the initial stationary period to identify them for tracking. In conditions in which white targets were tracked, a subset of five white disks flashed off and on during the initial stationary period to identify them for tracking. If both black targets and white targets were tracked, a subset of five black disks flashed off and on for 2 s and then a subset of five white disks flashed off and on for an additional 2 s. After 5 s, the disks stopped moving and then observers clicked on all of the targets (five disks in single-task conditions and 10 disks in dual-task conditions). Observers could click on the targets in any order, but they were restricted to selecting 5 of the 10 black disks and 5 of the 10 white disks. See Figure 4 for a schematic depiction of the display.
Results resource functions. For example, if the performance-resource functions were linear, then the AOC should be linear (see Figure 3A and Figure 3D). In Experiment 1a, we asked observers to perform two tracking tasks. On each trial, 10 white disks and 10 black disks were presented. Observers were required to track 5 of the 10 black disks, 5 of the 10 white disks, or 5 of 10 disks from both the white set and black set of disks. Because these two tracking tasks most likely draw on the same spatial attentional resources, they are likely to trade off. In Experiment 1b, 10 white letters and 10 black letters were briefly presented. Observers were required to find a white T among white Ls, a black E or N among black distractor letters, or both targets. Again, we expected performance on the two tasks to trade off.
Data for 2 observers were discarded because they failed to track all targets on even one trial in the single-task condition. Although observers were not given exact probabilities for resource allocation in the priority white, priority equal, and priority black conditions, we plotted their performance as though the percentage resource allocation to white and black targets was 90/10, 50/50, and 10/90 in the three conditions, respectively. The 50/50 allocation is a reasonable assumption for the priority equal condition, and it is not critical that the actual resource allocation to white and black targets in the priority white and priority black conditions was 90/10 and 10/90. The assumption here is that whatever rule observers used to divide their resources, they applied this rule equally regardless of which task was prioritized. For
650
ALVAREZ, HOROWITZ, ARSENIO, DIMASE, AND WOLFE
example, if a particular observer interpreted the instructions as requiring 60% resources to the prioritized task and 40% to the other task, then we assume they used the same resource allocation regardless of whether the white or black targets were prioritized (i.e., for white and black targets, the resource allocation for this observer would be 60/40 vs. 40/60 for the priority white and priority black conditions, respectively). Given these two assumptions (50/50 allocation for the priority equal condition and symmetrical resource allocation for the priority white and priority black conditions), we plotted tracking accuracy versus the proportion of resources allocated to each task (see Figure 5). The left panel shows tracking accuracy based on the average percentage of targets correctly tracked, and the right panel shows tracking accuracy based on the percentage of trials in which all targets were accurately tracked. The left panel illustrates that tracking accuracy based on the average percentage of targets accurately tracked appears to be a roughly linear function of the amount of resource allocated to each task, similar to the function shown in Figure 3A. Combining two tasks with such linear performance-resource functions would predict performance falling on a linear trade-off function as shown in Figure 3D. In contrast, the right panel shows that tracking accuracy based on the percentage of trials in which all black targets or all white targets were accurately tracked is a positively accelerated function, similar to that shown in Figure 3C. Combining two tasks with such positively accelerated resource functions predicts a curved tradeoff function that bends below the level of performance predicted by a linear trade-off function (similar to that shown in Figure 3F). These results indicate that the linear trade-off function is expected for two tracking tasks when the average percentage of targets accurately tracked is the performance measure, whereas a curved trade-off function is a more appropriate prediction when the percentage of trials with all targets accurately tracked is used as the measure. Normalized single-task and dual-task performance are illustrated in the AOC plot shown in Figure 6. The left panel shows tracking accuracy based on the percentage correctly tracked, and the right panel shows tracking accuracy based on the percentage of trials in which all targets were accurately tracked. There is a data
point for each of the three dual-task conditions. The black circle represents dual-task priority black performance, whereas the gray circle represents dual-task priority equal performance, and the white circle represents dual-task priority white performance. Is the trade-off between two tracking tasks linear in AOC space? When tracking accuracy was measured by the average percentage of targets accurately tracked, the average distance between the dual-task accuracy point and the trade-off line was not significantly greater than zero when priority was given to the black targets, t(7) ⬍ 1, p ⬎ .05, but was significantly below the trade-off line when priority was given to white targets, t(7) ⫽ 4.51, p ⬍ .01, or equal priority was given to black and white targets, t(7) ⫽ 5.64, p ⬍ .01. Note that this roughly linear trade-off is very similar to the trade-off predicted from the performance-resource functions plotted in the left panel of Figure 5. When tracking accuracy is measured by the percentage of trials in which all targets are accurately tracked, the average distance between the dual-task accuracy point and the trade-off line was not significantly greater than zero when priority was given to either the black targets or the white targets (priority black, t[7] ⬍ 1, p ⬎ .05; priority white, t[7] ⬍ 1, p ⬎ .05) but was significantly below the trade-off line when equal priority was given to black and white targets (priority equal, t[7] ⫽ 3.45, p ⬍ .05). Note that this trade-off function is what would be predicted given the positively accelerated performance-resource functions illustrated in the right panel of Figure 5. The shape of this trade-off also makes intuitive sense. Recall that the measure of accuracy in this case is the percentage of trials on which all targets of a subset are accurately tracked. When equal priority is given to the black and white targets, it is unlikely that either subset would be accurately tracked by this criterion. Imagine an observer who can track only five objects but always successfully tracks those five. If she tracks two white targets and three black targets, she will likely generate an incorrect response on both tasks, whereas if she chooses to track five black targets, she will generate a correct response for the black targets and an incorrect response for white targets. It is important to emphasize that this is a conservative measure; even a heroic observer who correctly tracked four of five disks of each color would likely produce an incorrect response on both tasks.
Figure 5. Performance-resource functions for tracking tasks in Experiment 1a. The y-axis represents normalized tracking accuracy (based on the percentage of targets tracked in the left panel and based on the percentage of trials with all targets tracked in the right panel). The x-axis represents the proportion of resources allocated to each task.
TRACKING AND SEARCH
651
Figure 6. Attentional operating characteristic results for Experiment 1a. The left panel shows tracking accuracy based on the average percentage of targets correctly tracked, and the right panel shows tracking accuracy based on the percentage of trials in which all targets were accurately tracked. The y-axis represents normalized tracking accuracy for black targets, and the x-axis represents normalized tracking accuracy for white targets. Each circle represents performance in one of the dual-task conditions. Error bars denote the standard error of the mean. The dashed line represents the linear trade-off line. The horizontal line represents single-task accuracy for black targets (normalized to 100), and the vertical line represents single-task accuracy for white targets (normalized to 100).
Experiment 1b—Search Versus Search Method Stimuli. Ten black letters subtending approximately 1.5° ⫻ 1.5° and 10 white letters subtending 2° ⫻ 2° visual angle were presented on a gray background. The black target was either an E or an N, and the black distractors were letters drawn from the rest of the alphabet, except for T and L, which were used in the white letter search task. The white target was a T (randomly rotated ⫾ 90° from vertical), and the white distractors were Ls (each randomly rotated 0°, 90°, 180°, or 270° from vertical). Each letter was located in a pseudorandom position within a 5 ⫻ 4 grid subtending 32° ⫻ 24°. Each letter was jittered randomly between ⫾ 1° horizontally and vertically from the center of the cell in which it was drawn. Procedure. At the beginning of each trial, a fixation point was presented for 500 ms, followed by a brief presentation of the search display, and then the search items were masked for 400 ms. Observers gave their responses after the mask presentation. In dual-task conditions, observers first indicated whether the black E or N was present and then whether the top of the white T was to the left or right. See Figure 4 for a schematic depiction of the display. Observers first practiced searching for the black E or N without white letters present and then practiced searching for the white T without black letters present. Observers completed 16 trials in each practice condition, with the duration of the search display fixed at 2 s. Then there were two additional practice sets in which both black and white letters were presented and the duration of the search display was staircased to estimate the duration at which performance was approximately 66.7% correct (see General Methods). The staircase asymptote was estimated separately for the two search tasks, and the two values were then averaged to obtain the experimental presentation duration for each observer. This procedure ensured that performance would be above chance but below ceiling for both search tasks in the single-task conditions. Observers then completed five test conditions with the fixed presentation duration: single task black, single task white, dual task priority black, dual task priority white, and dual task priority equal defined in a manner analogous
to that for the track-versus-track experiment. Observers completed 80 trials in each test condition, with the order of conditions counterbalanced as in Experiment 1a.
Results Search stimulus duration. The average staircase asymptote was 331 ms (SEM ⫽ 27 ms) for black targets and 293 ms for white targets (SEM ⫽ 29 ms). The average fixed presentation duration in test conditions, based on the average of each individual observer’s black target and white target asymptote, was 312 ms (SEM ⫽ 25 ms). Performance-resource functions. As in Experiment 1a, we assumed 50/50 allocation for the priority equal condition and symmetrical resource allocation for the priority white and priority black conditions, and we plotted search accuracy versus the proportion of resources allocated to each task (see Figure 7). Search accuracy appears to be a roughly linear function of the amount of resource allocated to each task, similar to the function shown in Figure 3A. Combining two tasks with such linear performanceresource functions would predict performance falling on a linear trade-off function as shown in Figure 3D. Normalized single-task and dual-task performance are illustrated in Figure 8. There is a data point for each of the three dual-task conditions. The black circle represents dual-task priority black performance, whereas the gray circle represents dual-task priority equal performance, and the white circle represents dualtask priority white performance. The average distance between the dual-task accuracy point and the trade-off line was not significantly greater than zero in any of the dual-task conditions: priority black, t(9) ⬍ 1, p ⬎ .05; priority equal, t(9) ⬍ 1, p ⬎ .05; priority white, t(9) ⬍ 1, p ⬎ .05. As expected, we cannot reject the hypothesis that these two visual search tasks are mutually exclusive. Each dual-task data point lies
652
ALVAREZ, HOROWITZ, ARSENIO, DIMASE, AND WOLFE
off line of mutual exclusivity. If the two tasks do not share attentional resources, then performance should be above this line.
Experiment 2—Concurrent Multielement Tracking and Visual Search
Figure 7. Observed performance-resource functions for visual search tasks in Experiment 1b. The y-axis represents normalized search accuracy (based on percentage correct). The x-axis represents the proportion of resources allocated to each task.
on or close to the trade-off line as would be expected for two mutually exclusive tasks. Note that the linear trade-off observed matches the linear trade-off predicted from the performanceresource functions plotted in Figure 7.
Discussion Experiment 1 clearly demonstrates that two tasks that, by definition, share the same visual attention resources will produce data that fall along or below the theoretical line of mutual exclusivity. The performance-resource functions for the tracking tasks appeared to be linear (or positively accelerated, if we use the percentage of perfect trials as the dependent measure). As expected for two mutually exclusive tasks with linear (or positively accelerated) performance-resource functions, performing the two tracking tasks concurrently produced results that fell on or below the linear trade-off function. The performance-resource functions for the two visual search tasks appeared to be linear, and as expected for two mutually exclusive tasks with linear performance-resource functions, performing the two search tasks produced results that fell almost perfectly along the linear trade-off line of mutual exclusivity. These results provide a framework for interpreting performance in subsequent experiments in which we required observers to perform tracking and a visual search task concurrently. If tracking (linear or positively accelerated performance-resource function) and search (linear performance-resource function) require continuous use of the same attentional resources and are mutually exclusive, then concurrent performance will produce either a linear trade-off function or one that is concave relative to the independence point (as in Figure 3D and Figure 3H). Critically, the concave function always lies at or below and to the left of the linear function, making the linear trade-off line the conservative estimate for mutual exclusivity. Additionally, the exact form of the linear function is known. Therefore, in all subsequent tests of mutual exclusivity, we tested performance against the linear trade-
In Experiment 2, we compared concurrent multielement visual tracking and visual search performance with performance on each task alone. Here we introduce a method that allows us to test tracking and search either concurrently or in isolation with the same visual stimulus. Each search item was superimposed on a tracking item and followed that tracking item’s motion. Figure 4 illustrates the method schematically. Observers viewed 10 white disks moving against a gray background. After 2 s of motion, five letters were briefly presented in a random subset of the disks and then all of the disks were masked and continued to move. In the visual search task, observers determined whether there was an E or N present among distractor letters. In the tracking alone condition, observers tracked a subset of 5 out of the 10 moving disks. In the dual-task condition, the task was to perform the tracking task and the search task concurrently. Conditions were arranged so that performance was well below 100% on both tasks. If either task was too easy, it could be argued that performance in the dual-task condition was drawing on reserve capacity that was not used in the single-task condition. For example, most observers can track up to four or five items, so a typical observer asked to track only one item might have excess capacity available for a second task (e.g., search). Thus, it is important to set the single-task difficulty level so that performing
Figure 8. Attentional operating characteristic results for Experiment 1b. The y-axis represents normalized search accuracy for the black target (based on percentage correct), and the x-axis represents normalized search accuracy for the white target (based on percentage correct). Each circle represents performance in one of the dual-task conditions. Error bars denote the standard error of the mean. The dashed line represents the linear trade-off line. The horizontal line represents single-task accuracy for black targets (normalized to 100), and the vertical line represents single-task accuracy for white targets (normalized to 100).
TRACKING AND SEARCH
either task alone is taxing and there is no reserve capacity available to enable performing a secondary task. Although experimenters are often exhorted to collect several points in order to measure the full AOC (Sperling & Melchner, 1978), in this case, a single dual-task point will suffice, as long as performance on both tasks is better than chance. Because we have already mapped out the AOC space, we do not need to plot the full AOC function for these two tasks; we only need to know where the data fall relative to the independence point and the line of mutual exclusivity.
Method Stimuli The stimuli for the tracking task were as specified in the General Methods. Search stimuli consisted of five black letters (1.25° ⫻ 1.75°) drawn in Helvetica font. Each letter was presented within one of the tracking disks and moved along with that disk. Masks consisted of a black rectangle with a vertical line, a horizontal line, and two diagonal lines drawn through the center of the rectangle.
653
In the search alone condition, the task was to determine whether an E or an N was present among the briefly presented letters. Distractor letters were selected without replacement from the rest of the alphabet, except Q and W. There was always a target present, and the two targets were equally likely. After the disks stopped moving, observers made an unspeeded response, pressing either the E or the N key to indicate which target had been present. In the tracking alone condition, observers were told to keep track of the cued disks. Letters were presented in the disks and then masked, but they were all task irrelevant and observers were instructed to ignore them. In the dual-task condition, observers had two tasks: (a) to keep track of the disks that were cued and (b) to determine whether there was an E or an N present among the letters that were briefly presented. After the disks stopped moving, the observer clicked on the tracked disks and then pressed either the E or N key to indicate which target had been present. All responses were unspeeded, and instructions gave equal priority to each task. Observers completed 50 trials in each test condition (order counterbalanced across observers).
Results Data for 1 observer were discarded because single-task search accuracy was near chance.
Procedure Tracking procedures were as specified in the General Methods. Tracking duration was set to 5 s. Observers first completed 20 practice trials tracking 5 of 10 disks. Then observers performed a set of search trials in which the duration of the search display was staircased to estimate the duration at which search performance was approximately 66.7% correct (see General Methods). The initial search display duration was 500 ms. The search stimuli were presented in a random subset of five disks 2 s after the start of motion. The search display was terminated by presenting masks on all 10 disks. Each observer’s staircase asymptote value was used as the presentation duration for the search display in three test conditions: tracking alone, search alone, and dual task. The order of the test conditions was counterbalanced across observers.
Search Stimulus Duration The average staircase asymptote for the presentation duration of the search stimuli was 156 ms (SEM ⫽ 26 ms). Normalized single-task and dual-task performance from the remaining 9 observers are illustrated in Figure 9. The left panel shows performance with tracking accuracy based on the average percentage of targets correctly tracked, and the right panel shows performance with tracking accuracy based on the percentage of trials in which all targets were accurately tracked. The black circle represents dual-task performance. In both AOC analyses, the dualtask point lies well above the linear trade-off diagonal.
Figure 9. Attentional operating characteristic results for Experiment 2. The y-axis represents normalized tracking accuracy (based on the percentage of targets tracked in the left panel and based on the percentage of trials with all targets tracked in the right panel), and the x-axis represents normalized search accuracy (based on percentage correct). Error bars denote the standard error of the mean. The dashed line represents the linear trade-off line. The horizontal line represents single-task accuracy (normalized to 100), and the vertical line represents single-task search accuracy (normalized to 100).
ALVAREZ, HOROWITZ, ARSENIO, DIMASE, AND WOLFE
654 Test for Mutual Exclusivity
The average distance between the dual-task accuracy point and the trade-off line (black diagonal line) was significantly greater than zero whether tracking accuracy was measured by the average percentage of targets accurately tracked, t(8) ⫽ 4.18, p ⬍ .01, or the percentage of trials in which all targets were accurately tracked, t(8) ⫽ 3.60, p ⬍ .01. Thus, we can reject the hypothesis that multielement tracking and visual search are mutually exclusive.
Test for Complete Independence Although dual-task performance is above the trade-off line in each condition, it appears that there is a cost to performing both tasks together, at least for the visual search task. The average distance between the dual-task accuracy point and the independence point was significantly greater than zero whether tracking accuracy was measured by the average percentage of targets accurately tracked, t(8) ⫽ 5.24, p ⬍ .01, or the percentage of trials in which all targets were accurately tracked, t(8) ⫽ 5.58, p ⬍ .01. Performance was significantly below single-task performance in each of the three dual-task conditions and therefore we must reject the hypothesis that multielement visual tracking and visual search are completely independent. We can further investigate this surprisingly high capacity to track and search concurrently by comparing performance when the search target is inside the tracked set with performance when the search target is outside the tracked set (see Figure 10). Normalized dual-task tracking accuracy was not dependent on search target location (inside vs. outside), t(8) ⬍ 1, p ⬎ .05. Thus, we can conclude that the need to search outside the tracked set did not significantly disrupt tracking. There was a trend for normalized
search accuracy to be lower when the search target was outside of the tracked set than when it was inside the tracked set (39% vs. 57%, chance ⫽ 0% for normalized scores), but this difference was not significant (outside vs. inside), t(8) ⬍ 1, p ⬎ .05. Finally, Figure 11 shows search performance when the search target was outside of the tracked set as a function of the number of search distractors inside the tracked set. Visual search accuracy for targets outside of the tracked set is greater the fewer distractors there are inside the tracked set. Although this trend is not significant (linear trend, F[1, 8] ⫽ 2.05, p ⫽ .19), these results are consistent with the hypothesis that search can proceed outside of the tracked set but is biased toward items within the tracked set. For example, say observers had time to search through three letters and always searched tracked objects first. If there were three distractors inside the tracked set, observers would not have a chance to examine items outside of the tracked set, including the target. Moreover, if they prioritized search items within the tracked disks, the targets inside the tracked set would be found more frequently when the search displays are divided between the tracked and untracked disks (for a similar finding, see Sears & Pylyshyn, 2000).
Discussion The critical observation is that concurrent performance of tracking and search tasks is significantly better than would be expected for two mutually exclusive tasks. Thus, we can reject the hypothesis that multielement visual tracking and visual search are each drawing continuously on the same spatial attention resource for the duration of the trial. Performance is also significantly different from the independence point, indicating that some resource is shared between the two tasks.
Figure 10. Attentional operating characteristic results for targets inside versus outside of the tracked set in Experiment 2. The y-axis represents normalized tracking accuracy (based on the percentage of targets tracked in the left panel and based on the percentage of trials with all targets tracked in the right panel), and the x-axis represents normalized search accuracy (based on percentage correct). Error bars denote the standard error of the mean. The dashed line represents the linear trade-off line. The horizontal line represents single-task tracking accuracy (normalized to 100), and the vertical line represents single-task search accuracy (normalized to 100).
TRACKING AND SEARCH
655
and on for 2 s to identify them for tracking. In the search alone conditions, the disks were presented constantly for 1 s. Then, all of the disks began moving, each in a random initial direction and at a constant rate of 9° per second.
Procedure
Figure 11. Dual-task search accuracy for targets outside of the tracked set as a function of the number of distractors inside the tracked set in Experiment 2. The y-axis represents normalized search accuracy (based on percentage correct) for targets outside of the tracked set, and the x-axis represents the number of distractors that appeared inside the tracked set. Error bars denote the standard error of the mean.
There was some evidence that the two tasks interacted, with higher search accuracy when the target is inside the tracked set than when the search target is outside the tracked set. However, tracking performance is unaltered by the location of the search target, suggesting that the variation in search performance does not reflect a trade-off between tracking and search. Instead, it seems to reflect a bias to begin search with the items inside the tracked disks. One could argue that this result reflects an inability or limited ability to search outside of the tracked set. Experiment 3 tests this possibility.
Experiment 3—Track and Search With Search Items Inside or Outside the Tracked Set The method for Experiment 3 was similar to that of Experiment 2, except that the search stimuli were not placed in locations at random. On each trial, all of the search stimuli appeared on disks outside of the tracked set or all of the search stimuli appeared on disks inside the tracked set. A new search task (search for a T among Ls) was used to ensure that the ability to perform tracking and search concurrently is not confined to the E or N search task of Experiment 2. Our principle interest was in whether tracking or search performance is altered by the location of the search stimuli.
Method Stimuli Ten white disks (diameter ⫽ 3°) were presented on a gray background. Each disk contained a black asterisk (1.75° ⫻ 1.75°), which served as a premask. The premasks were intended to make the onset of the search stimuli less disrupting. The target for the search task was a black T rotated at either 90° or 270° from vertical. Distractors were black Ls rotated 0°, 90°, 180°, or 270° from vertical. All search stimuli subtended 1.75° ⫻ 1.75° visual angle. In tracking conditions, a subset of the disks flashed off
One second after motion started, all the masks were removed and three distractors and one target were presented in disks either inside the tracked set or outside the tracked set. After a variable exposure duration (see below), all 10 disks were masked. After 3 s more of motion, the disks stopped and observers gave their responses. See Figure 4 for a schematic depiction of the display. Each observer completed a practice block consisting of 10 trials in each of four conditions: search alone, tracking alone, dual task mixed, and dual task blocked (see below). During training, the exposure duration for the search stimuli was 930 ms on Trial 1 and decreased by 100 ms on each trial such that the exposure duration was 30 ms on Trial 10. This was intended to illustrate the range of exposure durations that could be expected in the experiment. After completing the practice trials, each observer completed 100 search trials in which the exposure duration of the search stimuli was staircased to estimate the duration that allowed 66.7% correct performance (see General Methods). Each observer then completed 100 search alone, 100 tracking alone, 200 dual-task mixed, and 100 dual-task blocked trials, with order counterbalanced across observers. In the search alone condition, the task was to find the T and to determine whether the stem of the T was pointing to the left or to the right. In the tracking alone condition, the task was to keep track of 5 of the 10 moving disks. Letters were flashed for the exposure duration obtained in the staircase condition, but they were irrelevant to the tracking task, and observers were asked to ignore them. In the dual-task mixed condition, the task was to keep track of 5 of the 10 moving disks and to determine whether the stem of the T was pointing to the left or to the right. In this condition, all of the search stimuli appeared inside the set of disks being tracked on half the trials and outside the set of disks being tracked on the other half of the trials. Thus, observers did not know whether the target and distractors would appear inside or outside of the tracked set. The dual-task blocked condition was identical to the dual-task mixed condition except that, in this condition, all of the search stimuli always appeared outside the set of disks being tracked. Observers were informed that the target and distractors would appear outside of the tracked set for each trial of the entire session. All responses were unspeeded. In the tracking conditions, observers indicated which disks they had been tracking by clicking each disk with the mouse. In search conditions, observers were prompted to indicate whether the stem of the T was pointing to the left or to the right by pressing the R key for right and the L key for left. In dual-task conditions, tracking responses were given first, followed by search responses.
Results Normalized single-task and dual-task performance are illustrated in Figure 12. The left panel shows performance with tracking accuracy based on the average percentage of targets correctly tracked, and the right panel shows performance with tracking accuracy based on the percentage of trials in which all targets were accurately tracked. There is a data point for each of the three dual-task conditions. The black circle represents dual-task blocked performance, whereas the gray circle represents dual-task mixed performance with the letters inside the tracked set, and the white circle represents dual-task mixed performance with the letters outside the tracked set.
ALVAREZ, HOROWITZ, ARSENIO, DIMASE, AND WOLFE
656
Figure 12. Attentional operating characteristic results for Experiment 3. The y-axis represents normalized tracking accuracy (based on the percentage of targets tracked in the left panel and based on the percentage of trials with all targets tracked in the right panel), and the x-axis represents normalized search accuracy (based on percentage correct). Error bars denote the standard error of the mean. The dashed line represents the linear trade-off line. The horizontal line represents single-task tracking accuracy (normalized to 100), and the vertical line represents single-task search accuracy (normalized to 100).
Search Stimulus Duration The average staircase asymptote for the presentation duration of the search stimuli was 218 ms (SEM ⫽ 58 ms).
Letter Location Of principal interest in this experiment was whether the location of the search target had an effect on dual-task performance. The results of a one-way analysis of variance (ANOVA) on the dualtask data indicate that there is no effect of search stimulus location (blocked letters out, mixed letters in, or mixed letters out) on normalized dual-task tracking accuracy whether tracking accuracy was measured by the average percentage of targets accurately tracked or by the percentage of trials in which all targets were accurately tracked, F(2, 18) ⬍ 1, p ⬎ .05, and none of the pairwise comparisons of tracking accuracy between conditions were significant for either measure: all Fs(1, 9) ⬍ 1, except for dual-task mixed; letters in versus letters out, F(1, 9) ⫽ 2.2, p ⬎ .05, for percentage tracked; and F(1, 9) ⫽ 1.21, p ⬎ .05, for all tracked. Similarly, a one-way ANOVA indicates that there is no effect of search stimulus location on normalized dual-task search accuracy, F(2, 18) ⫽ 1.49, p ⬎ .05, and none of the pairwise comparisons of search accuracy between conditions were significant: blocked letters out versus mixed letters in, F(1, 9) ⫽ 3.30, p ⬎ .05; blocked letters out versus mixed letters out, F(1, 9) ⬍ 1, p ⬎ .05; mixed letters in versus mixed letters out, F(1, 9) ⫽ 1.92, p ⬎ .05. Thus, the ability to track and search concurrently does not depend critically on the location of the search stimuli as long as all of the search items are either inside or outside of the tracked set.
Test for Mutual Exclusivity The average distance between the dual-task accuracy point and the trade-off line was significantly greater than zero in each of the
dual-task conditions whether tracking performance was measured by the percentage of targets accurately tracked (blocked letters out, t[9] ⫽ 4.89, p ⬍ .01; mixed letters in, t[9] ⫽ 4.66, p ⬍ .01; mixed letters out, t[9] ⫽ 2.87, p ⬍ .05) or by the percentage of trials in which all targets were accurately tracked (blocked letters out, t[9] ⫽ 3.69, p ⬍ .01; mixed letters in, t[9] ⫽ 4.19, p ⬍ .01; mixed letters out, t[9] ⫽ 2.27, p ⬍ .05). Again, we can reject the hypothesis that multielement tracking and visual search are mutually exclusive.
Test for Complete Independence The average distance between the dual-task accuracy point and the independence point was significantly greater than zero in each of the dual-task conditions whether tracking performance was measured by the percentage of targets accurately tracked (blocked letters out, t[9] ⫽ 7.64, p ⬍ .01; mixed letters in, t[9] ⫽ 3.79, p ⬍ .01; mixed letters out, t[9] ⫽ 4.85, p ⬍ .01), or by the percentage of trials in which all targets were accurately tracked (blocked letters out, t[9] ⫽ 6.99, p ⬍ .01; mixed letters in, t[9] ⫽ 4.57, p ⬍ .01; mixed letters out, t[9] ⫽ 5.50, p ⬍ .01). Therefore we must reject the hypothesis that multielement visual tracking and visual search are completely independent.
Discussion Experiment 3 replicates the primary findings of Experiment 2. The results violate the predictions of mutual exclusivity: Dual-task accuracy was significantly above the trade-off line in each dualtask condition. Although not falling near the theoretical independence point, data from all three dual-task conditions were significantly better than expected if tracking and search draw continuously on the same resources.
TRACKING AND SEARCH
The main purpose of this experiment was to determine whether it was possible to search outside of the tracked set while concurrently tracking. Here the answer is clear. When the search stimuli were presented outside of the tracked set, dual-task performance was better than predicted by mutual exclusivity. Moreover, although it seems to be a little harder to search outside of the tracked set, this effect was small and not significant. This effect may have been larger in Experiment 2 because, with search items spread over the tracked and untracked sets, observers gave priority to the tracked items. Recall that we can reject exclusivity even when we use the conservative measure of tracking accuracy in which we measure the percentage of trials in which all target disks are accurately tracked. If the concurrent search task caused a loss of one tracked disk, performance would plummet to percentage correct ⫽ 1 / [T – (N – 1)], where T is the total number of moving disks and N is the number of tracked disks. It is important to remember that even in the dual-task mixed out condition, observers get all disks correct on more than 66% (in raw percentage correct) of the trials while concurrently performing a visual search. Thus, there is a surprisingly high capacity to perform tracking and search concurrently when both tasks overlap spatially. Experiment 4 tests whether it is possible to perform tracking and search when the tasks involve objects that do not overlap spatially.
Experiment 4 —Tracking and Searching Over Spatially Separate Sets of Objects Method The method is shown in cartoon form in Figure 4.
Stimuli Ten black disks and five black masks (1.5° ⫻ 2°) were presented on a white background in pseudorandom positions within a 6 ⫻ 5 grid (34° ⫻
657
23°). Five black letters drawn in Helvetica font (1.5° ⫻ 2°) served as the search stimuli. The disks moved at a constant rate of 4° per second. The letters did not move.
Procedure There were three conditions: search alone, track alone, and dual task. Observers completed 20 practice trials and 100 test trials in each condition. The order of the conditions was counterbalanced across observers. In each condition, the disks began moving, and 2 s later the masks were removed to reveal letters for 200 ms and then each of the letters was masked again. After a total of 5 s, the disks stopped moving. In the search alone condition, either an E or an N was presented among the briefly presented letters and the task was to determine which target was present. At the end of the trial, a message appeared on screen prompting observers to press one key if they saw an E and another key if they saw an N. In the track alone condition, five disks blinked on and off at 2 Hz for the initial 2 s of the trial to identify them for tracking. Five letters were presented, but they were all Xs and observers were instructed to ignore the letters. At the end of the trial, the cursor appeared and observers clicked on the disks they were tracking. In the dual-task condition, five disks blinked off and on and either an E or an N was presented among the briefly presented letters. The task was to keep track of the five disks that had blinked and to determine which target was present. At the end of the trial, all of the objects stopped moving, and observers clicked on the tracked disks and then indicated whether there was an E or an N present. All responses were unspeeded.
Results Normalized single-task and dual-task performance are illustrated in Figure 13. The left panel shows performance with tracking accuracy based on the average percentage of targets correctly tracked, and the right panel shows performance with tracking accuracy based on the percentage of trials in which all targets were accurately tracked. The black circle represents dual-task performance.
Figure 13. Attentional operating characteristic results for Experiment 4. The y-axis represents normalized tracking accuracy (based on the percentage of targets tracked in the left panel and based on the percentage of trials with all targets tracked in the right panel), and the x-axis represents normalized search accuracy (based on percentage correct). Error bars denote the standard error of the mean. The dashed line represents the linear trade-off line. The horizontal line represents single-task tracking accuracy (normalized to 100), and the vertical line represents single-task search accuracy (normalized to 100).
ALVAREZ, HOROWITZ, ARSENIO, DIMASE, AND WOLFE
658
The average distance between the dual-task accuracy point and the trade-off line was significantly greater than zero whether tracking performance was measured by the percentage of targets accurately tracked, t(9) ⫽ 4.11, p ⬍ .01, or by the percentage of trials in which all targets were accurately tracked, t(9) ⫽ 2.77, p ⬍ .05. Thus, we can again reject the hypothesis that multielement tracking and visual search are mutually exclusive, even when the stimuli for the two tasks occupy spatially separate locations. Although dual-task performance is above the trade-off line in each condition, there is a cost to performing both tasks together. The average distance between the dual-task accuracy point and the independence point was significantly greater than zero whether tracking performance was measured by the percentage of targets accurately tracked, t(9) ⫽ 6.96, p ⬍ .01, or by the percentage of trials in which all targets were accurately tracked, t(9) ⫽ 7.89, p ⬍ .01. Therefore, we must reject the hypothesis that multielement visual tracking and visual search are completely independent.
Discussion The results of the current experiment replicate and extend those of Experiments 2 and 3. Even when the tasks involve different sets of objects, tracking and searching are not mutually exclusive. Note also that, in this experiment, there are more task-relevant items in the dual-task condition than in the single-task conditions. For example, in the search alone condition, only the 5 search stimuli are relevant to the task, whereas, in the dual-task condition, 15 objects are relevant (the 5 search stimuli and 10 tracking stimuli).
continued until 20 reversals in the staircase were obtained. The staircase asymptote value was estimated by taking the average of the last 10 reversals in the staircase. This value was used during the main experiment.
Procedure Tracking procedures were as specified in the General Methods. Tracking duration was 6 s. The tone sequence began 1 s after the start of motion. In tone monitoring conditions, the task was to determine whether the target tone was presented for a longer or a shorter duration than the other tones. See Figure 14 for a schematic depiction of the display. Each observer completed one set of 30 practice trials in the tracking task and then completed the run through the tone staircase procedure. Then the difference in tone duration was fixed according to individual performance on the staircase trials, and each observer completed 32 trials in five conditions: tracking alone, tone alone, dual task prioritize tracking, dual task prioritize tone, and dual task equal priority. The order of conditions was counterbalanced as in Experiment 1. In the tracking alone condition, the task was to keep track of 5 of the 10 moving disks. In the tone alone condition, the task was to determine whether the target tone was of a shorter duration or a longer duration than the other tones. In each of the dual-task conditions, observers were required to perform both tasks. In the dual-task priority tracking condition, observers were instructed to prioritize performance of the tracking task and if possible to determine whether the target tone was longer or shorter than the other tones. In the dual-task priority tone condition, observers were instructed to prioritize determining whether the target tone was longer or shorter than the other tones and if possible to keep track of the targets. Finally, in the dual-task priority equal condition, the observers were instructed to give both tasks equal priority.
Experiment 5—Tracking Versus an Auditory Task Although not mutually exclusive, tracking and searching appear to interfere in some manner. In this article, our primary aim is to test the hypothesis that multielement visual tracking and visual search require continuous use of the same visual attention mechanism. Therefore, in Experiment 5, we asked observers to perform the multielement visual tracking task in conjunction with an auditory tone monitoring task. Because the auditory task is not visual, these two tasks cannot be using the same visual attention resources, though they might share executive and response resources. The results of this study establish a gold standard for the degree of independence one would expect from two tasks that do not draw continuously on the same visual attention resources and thus provide a benchmark against which the track versus search results of Experiments 2– 4 can be compared, at least qualitatively.
Method Stimuli The stimuli for the tracking task were as specified in the General Methods. Stimuli for the tone monitoring task consisted of a sequence of ten 600-Hz tones (nine distractor tones and one target tone, which was presented randomly between the third and eighth position in the sequence). The intertone interval was 400 ms. Each distractor tone played for 200 ms. The duration of the target tone was either shorter or longer than the distractor duration. The difference in duration was determined separately for each observer using a staircase procedure. The initial difference was set at ⫾ 50 ms. If the observer correctly indicated whether the target tone was shorter or longer than the distractors, the difference was reduced by 1 ms. An error resulted in a 2-ms increase in the difference. This procedure
Figure 14. Schematic depictions of the dual-task conditions in Experiments 5– 8. 5: Observers tracked 5 of 10 white disks while simultaneously monitoring a series of beeps for a target tone. 6: Observers tracked 5 of 10 white disks that simultaneously disappeared for a period of time during tracking. 7: Observers tracked 5 of 10 white disks that simultaneously disappeared for a variable interval. During the blank interval, eight letters (seven Ls and one T) were presented, and observers searched for the T. At the end of the interval, the letters disappeared, the disks reappeared, and the tracking task continued. 8: Observers tracked 5 of 10 white disk and searched for the vertical line. The vertical line appeared at a random time during tracking on half of the trials. Observers pressed the space bar as soon as the vertical line was located, terminating the trial. If no vertical line appeared, observers had to click on the tracked disks at the end of the trial. Thus, observers were required to track and search concurrently for the entire trial on target-absent trials. The arrows connected to the circles indicate the direction in which each object is moving. The small arrow pointing toward an object indicates the mouse pointer.
TRACKING AND SEARCH After the disks stopped moving, the observers clicked on all five disks. Then observers gave their response to the tone monitoring task, pressing one key if the target tone was longer and a different key if the target tone was shorter.
Results Normalized single-task and dual-task performance are illustrated in Figure 15. The left panel shows performance with tracking accuracy based on the average percentage of targets correctly tracked, and the right panel shows performance with tracking accuracy based on the percentage of trials in which all targets were accurately tracked. There is a data point for each of the three dual-task conditions. The black circle represents dual-task priority tone performance, whereas the gray circle represents dual-task priority equal performance, and the white circle represents dualtask priority track performance.
659
.05). Thus, we can reject the hypothesis that multielement tracking and the auditory tone monitoring task are mutually exclusive.
Test for Complete Independence Although dual-task performance is above the trade-off line in each condition, it appears that there is a cost to performing both tasks together. The average distance between the dual-task accuracy point and the independence point was significantly greater than zero in each of the dual-task conditions whether tracking performance was measured by the percentage of targets that were accurately tracked (priority tone, t[9] ⫽ 5.80, p ⬍ .01; priority equal, t[9] ⫽ 4.98, p ⬍ .01; priority track, t[9] ⫽ 5.86, p ⬍ .01) or by the percentage of trials in which all targets were accurately tracked (priority tone, t[9] ⫽ 7.30, p ⬍ .01; priority equal, t[9] ⫽ 5.01, p ⬍ .01; priority track, t[9] ⫽ 5.39, p ⬍ .01). Therefore, we must reject the hypothesis that multielement visual tracking and auditory tone monitoring are completely independent.
Target Tone Duration The average duration difference between distractor and target tones was ⫾ 31 ms (SEM ⫽ 3 ms).
Test for Mutual Exclusivity The average distance between the dual-task accuracy point and the trade-off line was significantly greater than zero in each of the dual-task conditions whether tracking performance measured by the percentage of targets accurately tracked (priority tone, t[9] ⫽ 4.93, p ⬍ .01; priority equal, t[9] ⫽ 7.01, p ⬍ .01; priority track, t[9] ⫽ 5.18, p ⬍ .01) or by the percentage of trials in which all targets were accurately tracked (priority tone, t[9] ⫽ 2.67, p ⬍ .05; priority equal, t[9] ⫽ 5.79, p ⬍ .01; priority track, t[9] ⫽ 3.10, p ⬍
Discussion Although visual tracking and auditory tone monitoring presumably do not share visual attention resources, there was a significant dual-task cost, suggesting that tracking and tone monitoring share more central attentional resources (e.g., executive functions; Baddeley & Hitch, 1974). Because each task requires goals in memory, monitoring task performance, and so on, it is not surprising that there would be costs to performing them concurrently. We can compare dual-task costs for track-versus-tone and trackversus-search experiments. This is shown for Experiments 2–5 in Figure 16. Although dual-task performance in all dual-task conditions shown in this figure are reduced from complete independence, all of these points are also significantly above the mutual
Figure 15. Dual-task performance in Experiment 5. The y-axis represents normalized tracking accuracy (based on the percentage of targets tracked in the left panel and based on the percentage of trials with all targets tracked in the right panel), and the x-axis represents normalized tone accuracy (based on percentage correct). Each circle represents performance in one of the dual-task conditions. Error bars denote the standard error of the mean. The dashed line represents the linear trade-off line. The horizontal line represents single-task tracking accuracy (normalized to 100), and the vertical line represents single-task tone accuracy (normalized to 100).
660
ALVAREZ, HOROWITZ, ARSENIO, DIMASE, AND WOLFE
Figure 16. Comparison of track versus tone performance with track versus search. The y-axis represents normalized tracking accuracy (based on the percentage of targets tracked in the left panel and based on the percentage of trials with all targets tracked in the right panel), and the x-axis represents normalized tone or search accuracy (based on percentage correct). Each circle represents performance in one of the dual-task conditions. Note that the cloud of track versus search data points overlaps with the track versus tone data points, indicating that the amount of interference seen for track versus search is qualitatively similar to that observed for tracking and a nonvisual task. The dashed line represents the linear trade-off line. The horizontal line represents single-task tracking accuracy (normalized to 100), and the vertical line represents single-task accuracy on the tracking or tone task (normalized to 100). Exp ⫽ Experiment.
exclusivity line. Most important, the cloud of data points for the search task overlaps with that for the tone task. This comparison suggests that the degree of interference for concurrent track and search is at least qualitatively similar to the interference observed for two tasks that do not share visual attention resources (the track and tone tasks). It is tempting to conclude that, like tracking and tone monitoring, tracking and searching draw on independent attentional resources. However, the track and search dual-task results of Experiments 2– 4 could be accounted for by at least two different models. It is possible that the two tasks actually use independent visual attentional resources, such that the aspects of spatial attention that enable tracking are independent of the spotlight of visual search. Alternatively, it is possible that tracking and search share a single attentional resource and that both tasks are accomplished within a trial by efficiently switching between the two tasks. An attention-switching hypothesis that proposes an ability to switch attention away from the tracking task to perform search must also propose some sort of memory for the tracked objects in order to allow attention to be directed back to those objects after the search. How can we test the attention-switching hypothesis? The attention-switching hypothesis assumes that it is possible to remove attention from the tracked set for some period. For instance, if an observer were to briefly close her eyes, the attentionswitching hypothesis predicts that she would be able to recover the tracked objects and still successfully complete the trial if the gap were not too long. Instead of asking observers to close their eyes, in the next two experiments we rendered the tracking stimuli invisible for some period and determined how long this duration could be while still yielding 66.7% correct performance on the task.
Experiment 6 —Tracking With a Brief Disappearance of Targets In Experiment 6, we used a staircase procedure to estimate the length of the gap duration for which observers could accurately track all 5 out of 10 identical objects on 66.7% of the trials. During the gap, attention cannot not be focused on visible tracked objects because they are not visible.
Method Stimuli Stimuli were as specified in the General Methods, except that the rate of motion was 6° per second.
Procedure On each trial, five disks were flashed on and off at 2 Hz for 2 s to cue them for tracking. The task was to keep track of the cued disks. After 2 s of tracking, all disks vanished for a brief period and a blank display was presented, then all disks reappeared with their positions updated as if they had continued to move according to the same rules during the blank interval. After 5 s from the start of tracking, all 10 disks stopped moving and observers clicked on the tracked disks using a mouse. The duration of the blank interval was governed by the staircase rule (see General Methods). The initial blank duration was 250 ms. For purposes of the staircase, a correct response required all tracked disks to be correctly identified. The staircase continued until there were 14 reversals. The last 10 reversals in the staircase were averaged to estimate the staircase asymptote value. Each observer completed two runs of the staircase. See Figure 14 for a schematic depiction of the display.
TRACKING AND SEARCH
Results The average staircase asymptote value was 261 ms (SEM ⫽ 50 ms) for the first run through the staircase and 328 ms (SEM ⫽ 61 ms) for the second run. The difference between runs did not quite reach significance, t(9) ⫽ 2.18, p ⫽ .057, although 8 of 10 observers had higher asymptote values on the second run.
Discussion Experiment 6 demonstrates that it is possible for observers to recover tracked objects following intervals of nearly one third of a second during which attention could not be focused on the physical tracked objects. Scholl and Pylyshyn (1999) have shown that observers can track disks that disappear behind occluders for fairly long periods of time. However, their experiments clearly indicated that occlusion cues (such as accretion along the leading edge of the object when it reappears) were necessary to support this ability; when objects simply disappeared and reappeared, tracking was impaired. An important difference between our display and that of Scholl and Pylyshyn is that all of the items in our display disappeared and reappeared at the same time, whereas the items in Scholl and Pylyshyn’s display disappeared and reappeared independently and randomly. We can speculate that occlusion cues may be less critical under conditions of simultaneous disappearance and reappearance. For the purposes of this article, the important point is that it is possible to track multiple targets even when they are not visible for extended periods of time. However, we do not know whether it is possible to perform another attention-demanding task in that interval. It may be the case that anticipating the reappearance of the tracked items requires the same attentional resources demanded by the search task. The next experiment tests whether observers can perform a challenging visual search during the gap in the tracking task.
Experiment 7—Track Versus Search During a Brief Disappearance of Targets In Experiment 7, the gap was not blank. Instead, eight letters were presented during the gap (seven Ls and one T, each randomly rotated 0°, 90°, 180°, or 270° from vertical). Here, we returned to the dual-task AOC method. In separate blocks, observers tracked 5 out of 10 disks, searched for a T among Ls, or performed both tasks in the same trial. We used a staircase procedure to estimate how long each observer could maintain the identity of the tracked disks when the letter-filled gap interrupted the tracking task. During this condition, observers were instructed to ignore the letters and to keep track of the target disks. With this fixed gap duration, each observer performed the tracking task only, the search task only, and a dual-task condition. Of principal interest was whether it would be possible to perform these two tasks concurrently better than expected for two mutually exclusive tasks (whether dual-task accuracy would be significantly above the trade-off line).
Method Stimuli Tracking stimuli were as described in General Methods. Search stimuli consisted of seven Ls and one T (randomly rotated 0°, 90°, 180°, or 270°
661
from vertical) subtending 2° ⫻ 2°. Letters were black and presented on a gray background in pseudorandom positions as in previous experiments. Each letter was jittered randomly between ⫾ 1° horizontally and vertically from the center of the cell in which it was drawn.
Procedure A staircase procedure, as described in Experiment 6, was used to determine the gap duration that allowed 66.7% accuracy for each individual observer. Stimulus presentation and the staircase procedure were identical to those of Experiment 6, except that the gap always contained eight letters (seven Ls and one T) in the current experiment. Each observer completed one run through a staircase procedure. The duration of the gap was then fixed according to individual performance on the staircase trials, and each observer completed 40 practice and 100 test trials in three conditions: tracking alone, search alone, and dual task (order counterbalanced across observers). In the tracking alone condition, observers tracked 5 of 10 identical disks and ignored the letters presented during the gap. In the search alone condition, observers ignored the moving disks and searched for a T among Ls during the gap. The task was to indicate whether the stem of the T was pointing up, down, left, or right. After the disks stopped moving, observers gave their search response by pressing the corresponding arrow key on the keyboard. In the dual-task condition, observers performed both tasks. At the end of each trial, observers clicked on the tracked targets and then pressed an arrow key to indicate the orientation of the T. See Figure 14 for a schematic depiction of the display.
Results Data for 2 observers were discarded because single-task search accuracy was near chance. Figure 17 presents normalized singletask and dual-task performance from the remaining 8 observers. The left panel shows performance with tracking accuracy based on the average percentage of targets correctly tracked, and the right panel shows performance with tracking accuracy based on the percentage of trials in which all targets were accurately tracked.
Staircase The average staircase asymptote for the duration of the gap in the tracking task was 326 ms (SEM ⫽ 86 ms).
Test for Mutual Exclusivity The black circle represents dual-task performance. The average distance between the dual-task accuracy point and the trade-off line was significantly greater than zero whether tracking performance was measured by the percentage of targets accurately tracked, t(7) ⫽ 5.06, p ⬍ .01, or by the percentage of trials in which all targets were accurately tracked, t(7) ⫽ 5.56, p ⬍ .01. Thus, we reject the hypothesis that multielement tracking and visual search are mutually exclusive, even when the two tasks are temporally interleaved.
Test for Complete Independence Dual-task performance is above the trade-off line, but there is a cost to performing both tasks together in the same trial. The average distance between the dual-task accuracy point and the independence point was significantly greater than zero whether tracking performance was measured by the percentage of targets
ALVAREZ, HOROWITZ, ARSENIO, DIMASE, AND WOLFE
662
Figure 17. Attentional operating characteristic results for Experiment 7. The y-axis represents normalized tracking accuracy (based on the percentage of targets tracked in the left panel and based on the percentage of trials with all targets tracked in the right panel), and the x-axis represents normalized search accuracy (based on percentage correct). Error bars denote the standard error of the mean. The dashed line represents the linear trade-off line. The horizontal line represents single-task tracking accuracy (normalized to 100), and the vertical line represents single-task search accuracy (normalized to 100).
accurately tracked, t(9) ⫽ 4.22, p ⬍ .01, or by the percentage of trials in which all targets were accurately tracked, t(9) ⫽ 5.23, p ⬍ .01. Therefore, we must reject the hypothesis that multielement visual tracking and visual search are completely independent.
Discussion The results of the current experiment show that, although there is a significant cost to performing both tasks within the same trial, observers are able to recover all five tracked objects even after performing a difficult visual search task during a gap in the visibility of the disks. This finding suggests that the two tasks can be performed with a single attentional resource that is efficiently switched between the tracking task and the search task, with the tracked objects stored in a form of spatial memory while attention is focused on search. According to this hypothesis, even when the stimuli for both tasks are simultaneously present, there is a form of spatial memory that can store the locations (and perhaps trajectories) of the tracked targets while attention is turned to the visual search task. This spatial memory enables the tracking targets to be recovered following brief intervals of searching. Although it may not be possible to firmly eliminate either the independent mechanisms or the attention-switching explanations for the partial independence of search and tracking, it is important to emphasize that the results of these experiments are theoretically interesting under either hypothesis. Regardless of whether tracking and search draw on the same spatial attentional resources, it is clear that tracking and search do not draw on the same visual attention resources all of the time. If tracking and search both relied on exactly the same set of resources, one would expect to observe a trade-off between the two tasks, with dual-task performance falling on or below the mutual exclusivity trade-off line, as observed in Experiments 1a and 1b. Instead, the observed trade-off between tracking and search is not qualitatively different from the
trade-off between tracking and auditory tone monitoring observed in Experiment 5. This finding holds up across several experiments. Thus, our data strongly suggest that tracking and visual search use independent resources. The results of Experiments 6 and 7 bring up a new question: Are these independent resources attentional resources or some other form of limited capacity resource such as spatial memory? To limit the class of models that can account for the ability to track and search in the same trial, we must move beyond the AOC method, which can demonstrate the degree to which two tasks require continuous use of the same resources but cannot demonstrate the level at which two tasks are independent. Thus, in the final experiment we measured reaction time (RT) in the search task in order to constrain models of concurrent track and search performance.
Experiment 8 —Track Versus Search Beyond the AOC Method To this point, all search tasks have used briefly presented stimuli. In Experiment 8, observers performed a tracking task concurrently with a visual search task that was sustained through the bulk of the tracking period. We measured both accuracy and RT as a function of the number of search items (the set size, 4 or 10). Different models make different predictions about the effect that tracking will have on the search task, both in terms of overall RT and the search rate (the slope of the line relating RT to set size). Thus, this method can be used to constrain the space of possible models. Here we outline the predictions of two possible attentionswitching mechanisms for concurrent tracking and search: fixedinterval switching and variable-interval switching. Both of these models assume that attention alternates between the two tasks on dual-task trials. A trial is thus divided up into intervals of tracking separated by intervals of searching. The
TRACKING AND SEARCH
duration of the tracking intervals is assumed to be fixed at T ms. The two models differ in the assumed duration of the search intervals. According to the fixed-interval switching model, each tracking interval lasts for T ms, regardless of set size (T is assumed to be less than the time required to search the entire display). Therefore, the more search items there are, the more searching intervals are required. As each search interval is followed by T ms of tracking, RT in the dual-task condition will increase proportionally to set size, resulting in an increase in the slope of the RT ⫻ Set Size function. Monte Carlo simulations show that fixed-interval switching models change the slope while leaving the intercept roughly unchanged over a range of variants (e.g., whether search during the search interval proceeds with or without memory for rejected distractors; Horowitz & Wolfe, 1998). According to the variable-interval switching model, observers adjust their search behavior to the set size so that search intervals last longer at higher set sizes. As a result, the number of intervals remains constant across set size and the amount of time spent tracking is also constant. This leads to an increase in the intercept of the RT ⫻ Set Size function in the dual-task condition, rather than a slope effect. Figure 18 summarizes the predictions of the two models. It is important to emphasize that these two models are not intended to be an exhaustive list of the models that can account for concurrent tracking and search. The purpose here was only to illustrate how different models make qualitatively different predictions about the effect of dual-task performance on RT in the search task. The results of Experiment 8 can eliminate specific classes of model.
Method Participants Twelve observers participated in this experiment.
663
Stimuli Ten white disks (diameter ⫽ 3°) were presented on a gray background. At the beginning of a trial, disks were located in pseudorandom positions as in previous experiments. Within a random subset of disks, 4 or 10 black lines (0.5° ⫻ 2.0°) were presented randomly jittered ⫾ 0.5° left or right of the center of the disk in which they were drawn. Distractors were lines rotated 30° clockwise or counterclockwise. The target was a vertical line. The search for vertical among ⫾ 30° is known to be quite inefficient (Wolfe, Friedman-Hill, Stewart, & O’Connell, 1992).
Procedure Each observer completed three conditions—track alone, search alone, and dual task—with the order of conditions counterbalanced across observers. At the beginning of each trial in tracking conditions, a subset of disks flashed off and on twice a second for 2 s to cue them for tracking. Disks then moved for 6 s. In search alone conditions, disks did not flash. In all conditions, at the start of the trial, search stimuli consisted entirely of distractors, half tilted clockwise and half counterclockwise. The target appeared in the place of one of the tilted lines after 1, 2, or 3 s of disk motion. Every 500 ms, the lines shifted 0.5° to the left or right to mask the onset of the search target. After a total of 5 s, all of the oriented lines were removed and the blank white disks continued to move for an additional second. In the search alone condition, the task was to determine whether there was a vertical line present among lines oriented ⫾ 30° from vertical. The task was to hit the space bar as soon as the vertical target was presented. If the target was never presented, observers were instructed not to respond. The trial terminated upon the observer’s response or after a total of 6 s. RT and accuracy were recorded. Each observer completed 24 practice trials and 204 test trials in this condition. In the tracking alone condition, the task was to keep track of the cued disks and to ignore the oriented lines. After the disks stopped moving, the observer clicked on all five of the tracked disks. Observers completed 24 practice trials and 204 test trials. In the dual-task condition, observers were instructed (a) to keep track of the five disks that were cued and (b) to determine whether there was a
Figure 18. Predictions for the effect of concurrent tracking on reaction time in visual search. The fixed-interval switching hypothesis predicts that there will be an increase in reaction time at each set size but that the increase will be greater for larger set sizes, resulting in a slope increase. The variable-interval switching hypothesis predicts a fixed increase in reaction time for each set size. Squares represent single-task performance, and circles represent dual-task performance.
ALVAREZ, HOROWITZ, ARSENIO, DIMASE, AND WOLFE
664
vertical line present. If there was a vertical line present, observers were instructed to hit the space bar on the keyboard as soon as the vertical target was presented. This key press terminated the trial and no tracking response was given. If the vertical line was never presented, no search response was given, and after all of the disks stopped moving observers clicked on the tracked disks. Note that this means that search RT data are entirely derived from search target-present trials, and tracking accuracy is derived from search target-absent trials. Furthermore, on search target-absent trials, observers are forced to search for the entire duration of the tracking task, except in the final second when the search items disappeared. Observers completed 24 practice trials and 204 test trials in this condition.
Results Tracking accuracy was significantly lower in the dual-task condition than in the single-task condition, respectively: percentage tracked, 84% vs. 94%, F(1, 11) ⫽ 12.66, p ⬍ .01; all tracked, 52% vs. 77% correct, F(1, 11) ⫽ 23.96, p ⬍ .01. Tracking performance in the dual-task condition was also compared with a conservative estimate of chance given the strict error criterion. Thus, chance performance in the tracking task if observers lost just one disk was equal to 1 / [10 – (5 – 1)] ⫽ 16.67%, where 10 is the total number of disks presented and 5 is the number of disks tracked. The percentage of trials in which all targets were accurately tracked in the dual-task condition was far above the 16.67% chance level, t(11) ⫽ 3.75, p ⬍ .01. Finally, dual-task accuracy was unaffected by set size in the search task: percentage tracked, 85% vs. 84% for Set Size 4 vs. Set Size 10, respectively, F(1, 11) ⬍ 1, p ⬎ .05; percentage all tracked, 52% vs. 52% for Set Size 4 vs. Set Size 10, respectively, F(1, 11) ⬍ 1, p ⬎ .05. Figure 19 illustrates the mean RT ⫻ Set Size functions for the single- and dual-task conditions. A 2 ⫻ 2 ANOVA was performed to determine the effects of set size (4 vs. 10) and condition (single task vs. dual task). RTs less than 200 ms or greater than 5.5 s accounted for less than 4% of the trials and were not included in the analysis. Dual-task RTs were slowed by around 400 ms relative to single-task search RTs, F(1, 11) ⫽ 15.62, p ⬍ .01, and RT increased with set size, F(1, 11) ⫽ 76.59, p ⬍ .01. The Set Size ⫻
Figure 19. Reaction time versus set size in Experiment 8. The y-axis represents reaction time, and the x-axis represents the number of search items presented. Error bars denote the standard error of the mean.
Condition interaction was not significant, F(1, 11) ⬍ 1, p ⬎ .05. There was no significant difference between the mean slope in the dual-task (69 ms per item) and single-task (82 ms per item) conditions, F(1, 11) ⬍ 1, p ⬎ .05. Search accuracy was greater than 99% in both conditions. If the trials that were removed as RT outliers are counted as errors, then the miss rate was 5.00% in the dual-task condition and 1.30% in the single-task condition, t(11) ⫽ 3.74, p ⬍ .01. False alarm rates were less than 1.00% in each condition (0.25% in the dual task and 0.98% in the single task), t(11) ⫽ 2.14, p ⫽ .06. Figure 19 also illustrates the effect of the location of the search target relative to the tracked set. Dual-task data were analyzed using a 2 ⫻ 2 ANOVA, with set size (4 vs. 10) and target location (inside vs. outside) as factors. RTs were 140 ms longer when the target was outside of the tracked set than when the target was inside the tracked set, though this difference was only marginally significant, F(1, 11) ⫽ 3.90, p ⫽ .07. RTs increased significantly with set size, F(1, 11) ⫽ 24.21, p ⬍ .01. The Set Size ⫻ Target Location interaction was not significant, F(1, 11) ⬍ 1, p ⬎ .05. The mean slopes for inside (69 ms per item) and outside (68 ms per item) targets did not differ, F(1, 11) ⬍ 1, p ⬎ .05.
Discussion The present experiment shows that tracking increases RT in a visual search task by approximately the same amount for each set size, yielding roughly equal search slopes in the single-task and dual-task conditions. If anything, there was a trend for slopes to be shallower in the dual-task condition than in the single-task condition. This result constrains models of concurrent track and search performance. Specifically, we can rule out the fixed-interval switching model, which specifies that attention is switched back and forth between tracking and search at fixed intervals (e.g., search for 100 ms, track for 100 ms, repeat until done). In that case, the number of track and search cycles increases with set size, and consequently going from search only to the track and search dual task increases the slope. This prediction was clearly violated in the current experiment. There is an alternative attention-switching model that could account for an RT cost without a slope increase. For instance, if it were possible to search 10 items within a single bout of search, then only a single bout of search would be required to complete the search task at both Set Size 4 and Set Size 10. Thus, a maximum of one bout of tracking would be added to RT in the search task (on those trials in which the search target happened to appear during a bout of tracking). However, this seems unlikely. It would take approximately 700 – 800 ms to search through 10 items at the observed rate of 70 – 80 ms per item, an interval well beyond the limit for recovering all of the tracking targets (see Experiments 6 and 7). The results instead support the variable-interval switching model. If the duration of the search interval is proportional to set size (i.e., search longer if there is more to search through), then the slope remains roughly constant and the intercept increases. This captures the pattern of the data, making it likely that, if observers are switching, search interval durations vary with the set size. It is possible to propose other models. As in the visual search literature, one can propose various limited, shared capacity ac-
TRACKING AND SEARCH
counts that will produce results similar to those produced by alternation models. For the present, we can reject several classes of models, including any model that holds that tracking requires continuous use of the same attentional resource as visual search or any model that predicts a decrease in search efficiency (i.e., an increase in search slope).
General Discussion Together, the current experiments demonstrate that it is possible to track and search within the same trial across a variety of conditions. It is possible to search through and track spatially overlapping sets of stimuli (Experiments 2, 3, and 8), even when the search stimuli are presented in the distractors for the tracking task (Experiment 3). It is also possible to search through one set of items while tracking a nonoverlapping set of items (Experiment 4). Finally, it is possible to perform a search task during a temporal gap in the tracking task after which the tracked objects are recovered and continue to be tracked (Experiment 7). Although there were significant dual-task costs in all of these conditions, the costs evaluated in an AOC analysis were consistent with a central executive cost (as with tracking and tone monitoring in Experiment 5), and performance was consistently better than would be predicted for two mutually exclusive tasks (such as the two tracking tasks in Experiment 1a or the two search tasks in Experiment 1b). It is important to emphasize that the data clearly establish that tracking and search do not continuously draw on the same attentional resources and that the two tasks must rely on some independent resources. The theoretically interesting question is, what resources do tracking and search share and what resources are independent? We have focused on two possible explanations for the ability to track and search concurrently: attention-switching and independent attentional resources. The attention-switching hypothesis holds that attention can switch back and forth between the tracking task and search task within a trial. Experiments 6 and 7 provide evidence that it is possible to recover objects following a gap of approximately one third of a second based on memory for the location and perhaps trajectory of objects, even when an attention-demanding visual search was performed during the gap. These results seem to support the hypothesis that it is possible to perform two attention-demanding tasks within a trial by switching attentional resources back and forth between them throughout the trial, relying on memory to recover the objects. Experiment 8 restricts the class of models that could account for concurrent tracking and search. If an attention-switching mechanism enables concurrent tracking and search, the switching must occur in a way that does not increase the slope of the line relating RT to set size (e.g., search intervals proportional to set size). In the original demonstration that it is possible to track multiple independent objects, Pylyshyn and Storm (1988) hypothesized that tracking was accomplished by a FINST mechanism that can maintain the identity of an object. The hypothesized FINST is a preattentive index that points to an object and continues to point to that object as it moves. Thus, FINSTs are sticky pointers that are capable of tracking objects. Pylyshyn and Storm also developed a model to test whether tracking was accomplished by a serialscanning mechanism or by a continuous parallel mechanism. The serial-scanning mechanism requires the position of objects to be
665
stored in a location table as attention scans serially from stored location to stored location, updating the location table after each scan. This mechanism will fail if the information in the location table becomes outdated faster than attention can update the table. Even with conservative assumptions of the rate at which attention can scan a display (e.g., 20 ms per degree), Pylyshyn and Storm found that the serial-scanning mechanism predicts performance levels far below the observed levels. Thus, they rejected the serial scanning account of tracking and concluded that performance was consistent with a parallel mechanism that continuously tracks objects. Here the term continuously refers to the hypothesis that FINSTs move with the retinal image of an object and thus update the location to which they point as the incoming information is updated (i.e., continuously). Although Pylyshyn and Storm (1988) rejected a serial-scanning mechanism that relies on memory in favor of a parallel mechanism that tracks objects continuously, the ability to track objects that disappear for an extended period of time revives the possibility that some type of spatial memory might play a role in object tracking. On this view, the positions of multiple objects are stored in a two-dimensional spatial memory rather than in a onedimensional list of target locations. Attention then selects multiple positions within the two-dimensional spatial memory in parallel, in a manner similar to the simultaneous attentional selection of items during tracking except that the selection occurs in memory. Attention then updates the location of each object in memory and the cycle continues. Thus, the present experiments suggest that tracking may be a process of repeatedly sampling and updating memory rather than a process of continuously updating the locations of objects based on incoming information. Note that the proposed spatial memory store would have to be different than Pylyshyn’s (2000) FINSTs. According to Pylyshyn (2000), directing attention to an object requires some form of index or pointer to the location of the object prior to the deployment of attention. For example, in the current experiments, Pylyshyn’s (2000) FINSTs would be required to index the search items so that attention can be directed to them during search and therefore the FINSTs would not be available to serve as a spatial memory enabling recovery of the tracking targets. If even a single index was devoted to the search task, one of the tracked objects would be lost and tracking accuracy (given the strict all or none criterion) would fall to 16.67% correct (chance assuming accurate tracking of four targets and randomly guessing on the lost fifth target among five distractors). Such a low level of tracking accuracy was never observed in the dual-task tracking and search conditions of the present experiments. Thus, the FINST mechanism would be unable to switch between tracking and search without some other form of spatial memory to enable the recovery of the target objects. The parallel memory access model, however, proposes that when attention is occupied by a secondary task the locations of the tracked objects can be maintained in memory while attention is turned to the secondary task. During that time, the locations of the tracked objects in memory are not updated, and tracking performance is limited by the amount of time before this memory is outdated (i.e., when the stored positions of the targets are no longer sufficient to distinguish targets from distractors in their current positions). In other words, the process of tracking is the same in the single-task and dual-task conditions except that the time between memory updates is delayed by time spent performing the
ALVAREZ, HOROWITZ, ARSENIO, DIMASE, AND WOLFE
666
secondary search task. Thus, the parallel memory access mechanism has the advantage of enabling attention to be directed to other objects or features for brief intervals without losing track of the target objects. The ability to turn attention to features other than spatiotemporal properties (speed, location, and direction) is essential if the goal is not only to keep track of objects but to identify those objects as well. Many views of attention assume that attending to an object automatically entails encoding all properties of that object (e.g., Kahneman & Henik, 1981), but recent research suggests that knowing where something is does not necessarily accompany knowing what that thing is. Scholl, Pylyshyn, and Franconeri (1999) have shown that the location and motion direction of tracked objects are encoded better than the color and shape. This research suggests that it might be necessary to switch the focus of attention from spatiotemporal properties to featural properties to determine, say, the color or shape of a tracked object. Moreover, it appears that the individual identities of targets cannot be maintained on the basis of spatiotemporal information alone (Pylyshyn, 2002). For example, if five targets are initially numbered 1 through 5 at the beginning of a trial (and then appear identical to the distractors), observers can track the five targets, but they are unable to indicate which target corresponds to a particular number. In other words, observers can keep track of the target set on the basis of spatiotemporal information, but they cannot keep track of the individual identities of the tracked items on the basis of this information. Thus, the ability to focus attention on and encode the featural properties of objects is necessary to maintain (or reacquire) the individual identities of multiple targets. Of course, this ability would only be useful when there are differences in the featural properties of the targets, which is more likely to be the case outside of controlled laboratory settings. The spatial memory mechanism suggested by the current experiments would enable attention to be shifted to the featural properties of objects, even objects other than the tracked objects, with minimal loss of accuracy in the tracking task as long as attention returns to update memory before the memory is outdated. Finally, as discussed above, it is possible that tracking and search are performed continuously by separate spatiotemporal attention and featural attention mechanisms. Future research will be aimed at teasing apart which of these two theories enables concurrent tracking and search. Is the hypothetical ability to switch between searching and tracking of purely basic scientific interest? Perhaps it is not. Tasks like driving or playing soccer may require tracking multiple moving items. During such a task, it may be necessary to abandon the tracking for some period of time (e.g., to check the speedometer). It would be helpful to have memory systems that allowed for rapid and accurate resumption of the interrupted task. It may be that process that we are studying here.
Conclusion Multielement visual tracking and visual search draw on partially independent sets of resources. The current findings support two possible conclusions: (a) that the visual–spatial attention required by multielement visual tracking is different than the visual–spatial attention required by visual search or (b) that there is limitedcapacity spatial memory (possibly accessed in parallel) that stores
the location and the trajectory of tracked objects and enables recovery of the tracked objects after attention has been devoted to other tasks for brief intervals. Our results, showing that tracking tasks can be interrupted without being disrupted, lend credence to the second option, but a clear choice between these two classes of model awaits further research.
References Baddeley, A. D., & Hitch, G. (1974). Working memory. In G. H. Bower (Ed.), The psychology of learning and motivation (Vol. 8, pp. 47– 89). New York: Academic Press. Brainard, D. H. (1997). The psychophysics toolbox. Spatial Vision, 10, 433– 436. Braun, J., & Julesz, B. (1998). Withdrawing attention at little or no cost: Detection and discrimination tasks. Perception & Psychophysics, 60, 1–23. Comtois, R. (2004). VisionShell PPC [Computer software]. Cambridge, MA: Author. Egeth, H. E., Virzi, R. A., & Garbart, H. (1984). Searching for conjunctively defined targets. Journal of Experimental Psychology: Human Perception and Performance, 10, 32–39. Horowitz, T. S., & Wolfe, J. M. (1998, August 6). Visual search has no memory. Nature, 394, 575–577. Kaernbach, C. (1991). Simple adaptive testing with the weighted up– down method. Perception & Psychophysics, 49, 227–229. Kahneman, D., & Henik, A. (1981). Perceptual organization and attention. In M. Kubovy & J. R. Pomerantz (Eds.), Perceptual organization (pp. 181–212). Hillsdale, NJ: Erlbaum. Navon, D., & Gopher, D. (1979). On the economy of the human-processing system. Psychological Review, 86, 214 –255. Norman, D. A., & Bobrow, D. G. (1975). On data-limited and resourcelimited processes. Cognitive Psychology, 7, 44 – 64. Pashler, H. (1994). Dual-task interference in simple tasks: Data and theory. Psychological Bulletin, 116, 220 –244. Pelli, D. G. (1997). The VideoToolbox software for visual psychophysics: Transforming numbers into movies. Spatial Vision, 10, 437– 442. Pylyshyn, Z. W. (1989). The role of location indexes in spatial perception: A sketch of the FINST spatial-index model. Cognition, 32, 65–97. Pylyshyn, Z. W. (2000). Visual indexes, preconceptual objects, and situated vision. Cognition, 80, 127–158. Pylyshyn, Z. W. (2002). Tracking multiple identical moving objects: Analysis of recent findings [Abstract]. Journal of Vision, 2, 249a. Pylyshyn, Z. W., & Storm, R. W. (1988). Tracking multiple independent targets: Evidence for a parallel tracking mechanism. Spatial Vision, 3, 179 –197. Scholl, B. J., & Pylyshyn, Z. W. (1999). Tracking multiple items through occlusion: Clues to visual objecthood. Cognitive Psychology, 38, 259 – 290. Scholl, B. J., Pylyshyn, Z. W., & Franconeri, S. (1999, May). When are spatiotemporal and featural properties encoded as a result of attentional allocation? Paper presented at the Annual Meeting of the Association for Research in Vision and Ophthalmology, Ft. Lauderdale, FL. Abstract obtained from Investigative Ophthalmology and Visual Science, 1999, 40, Abstract no. S797. Sears, C. R., & Pylyshyn, Z. W. (2000). Multiple object tracking and attentional processing. Canadian Journal of Experimental Psychology, 54, 1–14. Sperling, G., & Dosher, B. A. (1986). Strategy and optimization in human information processing. In K. Boff, L. Kaufman, & J. Thomas (Eds.), Handbook of perception and performance (pp. 1– 65). New York: Wiley.
TRACKING AND SEARCH Sperling, G., & Melchner, M. J. (1978, October 20). The attention operating characteristic: Examples from visual search. Science, 202, 315– 318. Wolfe, J. M. (1998). What do 1,000,000 trials tell us about visual search? Psychological Science, 9, 33–39. Wolfe, J. M., Cave, K. R., & Franzel, S. L. (1989). Guided search: An alternative to the feature integration model for visual search. Journal of Experimental Psychology: Human Perception and Performance, 15, 419 – 433. Wolfe, J. M., Friedman-Hill, S. R., Stewart, M. I., & O’Connell, K. M.
667
(1992). The role of categorization in visual search for orientation. Journal of Experimental Psychology: Human Perception and Performance, 18, 34 – 49. Yantis, S. (1992). Multielement visual tracking: Attention and perceptual organization. Cognitive Psychology, 24, 295–340.
Received March 20, 2002 Revision received July 13, 2004 Accepted October 28, 2004 䡲
New Editors Appointed, 2007–2012 The Publications and Communications (P&C) Board of the American Psychological Association announces the appointment of three new editors for 6-year terms beginning in 2007. As of January 1, 2006, manuscripts should be directed as follows: • Journal of Experimental Psychology: Learning, Memory, and Cognition (www.apa.org/journals/ xlm.html), Randi C. Martin, PhD, Department of Psychology, MS-25, Rice University, P.O. Box 1892, Houston, TX 77251. • Professional Psychology: Research and Practice (www.apa.org/journals/pro.html), Michael C. Roberts, PhD, 2009 Dole Human Development Center, Clinical Child Psychology Program, Department of Applied Behavioral Science, Department of Psychology, 1000 Sunnyside Avenue, The University of Kansas, Lawrence, KS 66045. • Psychology, Public Policy, and Law (www.apa.org/journals/law.html), Steven Penrod, PhD, John Jay College of Criminal Justice, 445 West 59th Street N2131, New York, NY 10019-1199. Electronic manuscript submission. As of January 1, 2006, manuscripts should be submitted electronically through the journal’s Manuscript Submission Portal (see the Web site listed above with each journal title). Manuscript submission patterns make the precise date of completion of the 2006 volumes uncertain. Current editors, Michael E. J. Masson, PhD, Mary Beth Kenkel, PhD, and Jane GoodmanDelahunty, PhD, JD, respectively, will receive and consider manuscripts through December 31, 2005. Should 2006 volumes be completed before that date, manuscripts will be redirected to the new editors for consideration in 2007 volumes. In addition, the P&C Board announces the appointment of Thomas E. Joiner, PhD (Department of Psychology, Florida State University, One University Way, Tallahassee, FL 32306-1270), as editor of the Clinician’s Research Digest newsletter for 2007–2012.