Document Clustering Evaluation: Divergence from a Random Baseline Christopher M. De Vries 1 and Shlomo Geva 1 and Andrew Trotman 2 School of Electrical Engineering and Computer Science Queensland University of Technology, Brisbane, Australia 1 Department of Computer Science, University of Otago, Dunedin, New Zealand 2
[email protected]
[email protected]
Abstract Divergence from a random baseline is a technique for the evaluation of document clustering. It ensures cluster quality measures are performing work that prevents ineffective clusterings from giving high scores to clusterings that provide no useful result. These concepts are defined and analysed using intrinsic and extrinsic approaches to the evaluation of document cluster quality. This includes the classical clusters to categories approach and a novel approach that uses ad hoc information retrieval. The divergence from a random baseline approach is able to differentiate ineffective clusterings encountered in the INEX XML Mining track. It also appears to perform a normalisation similar to the Normalised Mutual Information (NMI) measure but it can be applied to any measure of cluster quality. When it is applied to the intrinsic measure of distortion as measured by RMSE, subtraction from a random baseline provides a clear optimum that is not apparent otherwise. This approach can be applied to any clustering evaluation. This paper describes its use in the context of document clustering evaluation.
1
Introduction
This paper extends, motivates and analyses a document clustering evaluation approach that compensates for ineffective document clusterings during evaluation. An ineffective clustering is one that achieves a high score according to a measure of document cluster quality but provides no value as a clustering solution. Divergence from a random baseline is introduced and formally defined to address ineffective clusterings in evaluation. A notion of work performed by a clustering is introduced where ineffective cases appear to perform no useful learning. The paper is concluded with a detailed analysis of the results from the INEX 2010 XML Mining track. This paper clearly defines and motivates this approach with theoretical and experimental analysis. Ineffective document clusterings have been investigated using two extrinsic evaluations. The first is the standard clusters to categories approach where document clusters are compared to a ground truth set of category labels. The second approach evaluates document clustering using ad hoc information retrieval that has a use case for collection selection where a document collection is distributed across many machines. A broker needs to direct a search
[email protected]
query to machines containing relevant documents. If the documents are allocated to machines by document cluster, it is expected that only a few topical clusters need to be searched. This is motivated by the cluster hypothesis [20] that states relevant documents tend to be more similar to each other than non-relevant documents. The Normalised Cumulative Cluster Gain (NCCG) measure evaluates document clustering with respect to this use case for ad hoc information retrieval. The paper proceeds as follows. Section 2 introduces the collaborative XML document mining evaluation forum at INEX. Section 3 introduces document clustering in an information retrieval context and discusses different approaches. Evaluation of document clustering using the clusters to categories approach and ad hoc relevance judgements is discussed in Section 4. Sections 5, 6 and 7 introduce and define ineffective clusterings that perform no useful learning and can be adjusted for by applying divergence from a random baseline. Section 8 analyses the application of divergence from a random baseline using the INEX 2010 XML mining track. The paper is concluded in Section 9.
2
INEX XML Mining Track
The XML document mining track was run for six years at INEX, the Initiative for the Evaluation of XML Information Retrieval 1 [12; 10; 11; 26; 8]. It explored the emerging field of classification and clustering of semi-structured documents. Document clustering has been evaluated at INEX using the standard clusters to categories approach, where categories extracted from the Wikipedia were used as a ground truth. Clusterings produced by different systems were evaluated using measures such as Purity, Entropy, F1 and NMI, indicating how well the clusters match the categories. A novel approach to document clustering evaluation was introduced at INEX in 2009 [26] and 2010 [8]. It used ad hoc information retrieval to evaluate document clustering by using relevance judgments from retrieval systems in the ad hoc track [34]. Ad hoc information retrieval evaluation is a system based approach that evaluates how different systems rank relevant documents. For systems to be compared, the same set of information needs and documents have to be used. A test collection consists of documents, statements of information need, and relevance judgments [36]. Relevance judgments are often binary and any document is considered relevant if any of its contents can contribute to the satisfaction of the specified information need. 1 http://inex.otago.ac.nz/tracks/ wiki-mine/wiki-mine.asp
However, the ad hoc track at INEX provides additional relevance information where assessors highlight the relevant text in the documents. Information needs are also referred to as topics and contain a textual description of the information need, including guidelines as to what may or may not be considered relevant. Typically, only the keyword based query of a topic is given to a retrieval system. The ad hoc information retrieval based evaluation of document clustering is motivated by the cluster hypothesis that suggests relevant documents are more similar to each other than non-relevant documents; relevant documents tend to cluster together. The spread of relevant documents over a clustering solution was measured using the Normalised Cumulative Cluster Gain (NCCG) measure in the INEX XML mining track in 2009 and 2010 [26; 8]. This evaluation approach also has a specific use case in information retrieval. It evaluates clustering of a document collection for collection selection. Collection selection involves selecting a subset of a collection given a query. Typically, these subsets are distributed on different machines. The goal is to cluster documents such that only a small fraction of clusters, and therefore machines, need to be searched to find most of the relevant documents for a given query. This leads to improved run time performance as only a fraction of the collection needs to be searched. The total load over a distributed system is decreased as only a few machines need to be searched per query instead of every machine. It also provides a clear use case for document clustering evaluation. By contrast, comparing document clusters to predefined categories only evaluates clustering as a match against a particular classification. This paper uses the INEX 2010 XML Mining track dataset [8]. It is a 146,225 document subset of the INEX XML Wikipedia collection determined by the reference run used for the ad hoc track [2]. The reference run contains the 1500 highest ranked documents for each of the queries in the ad hoc track. The queries were searched using an implementation of Okapi BM25 in the ATIRE [35] search engine. Topical categories for documents are one of many views of extrinsic cluster quality. They are derived from what humans perceive as topics in a document collection. When categories are used for evaluation, a document clustering system is given a score indicating how well the clusters match the predefined categories. This is the most prevalent approach to evaluation of document clustering in the research literature. The categories for the INEX 2010 XML Mining collection were extracted from the Wikipedia category graph which is noisy and nonsensical at times. Therefore, an approach using shortest paths in the graph was used to extract 36 categories [8].
3
Document Clustering
Document clustering is used in many different contexts, such as exploration of structure in a document collection for knowledge discovery [33], dimensionality reduction for other tasks such as classification [22], clustering of search results for an alternative presentation to the ranked list [19] and pseudo-relevance feedback in retrieval systems [23]. Recently there has been a trend towards exploiting semistructured documents [27; 11]. This uses features such as the XML tree structure and hyper-link graphs to derive data from documents to improve the quality of clustering.
Document clustering groups documents into topics without any knowledge of the category structure that exists in a document collection. All semantic information is derived from the documents themselves. It is often referred to as unsupervised clustering. In contrast, document classification is concerned with the allocation of documents to predefined categories where there are labeled examples to learn from. Clustering for classification is referred to as supervised learning where a classifier is learned from labeled examples and used to predict the classes of unseen documents. The goal of clustering is to find structure in data to form groups. As a result, there are many different models, learning algorithms, encoding of documents and similarity measures. Many of these choices lead to different induction principles [14] which result in discovery of different clusters. An induction principle is an intuitive notion as to what constitutes groups in data. For example, algorithms such as k-means [24] and Expectation Maximisation [9] use a representative based approach to clustering where a prototype is found for each cluster. These prototypes are referred to as means, centers, centroids, medians and medoids [14]. A similarity measure is used to compare the representatives to examples being clustered. These choices determine the clusters discovered by a particular approach. A popular model for learning with documents is the Vector Space Model (VSM) [30]. Each dimension in the vector space is associated with one term in the collection. Term frequency statistics are collected by parsing the document collection and counting how many times each term appears in each document. This is supported by the distributional hypothesis [18] from linguistics that theorises that words that occur in the same context tend to have similar meanings. If two documents use a similar vocabulary and have similar term frequency statistics then they are likely to be topically related. The end result is a high dimensional, sparse document-by-term matrix who’s properties can be explained by Zipf distributions [41] in term occurrence. The matrix represents a document collection where each row is a document and each column is a term in the vocabulary. In the clustering process, document vectors are often compared using the cosine similarity measure. The cosine similarity measure has two properties that make it useful for comparing documents. Document vectors are normalised to unit length when they are compared. This normalisation is important since it accounts for the higher term frequencies that are expected in longer documents. The inner product that is used in computing the cosine similarity has non-zero contributions only from words that occur in both documents. Furthermore, sparse document representation allows for efficient computation. Different approaches exist to weight the term frequency statistics contained in the document-by-term matrix. The goal of this weighting is to take into account the relative importance of different terms, and thereby facilitate improved performance in common tasks such as classification, clustering and ad hoc retrieval. Two popular approaches are TF-IDF [29] and BM25 [28; 38]. Clustering algorithms can be characterized by two properties. The first determines if cluster membership is discrete. Hard clustering algorithms only assign each document to one cluster. Soft clustering algorithms assign documents to one or more clusters in varying degree of membership. The second determines the structure of the clusters found as being either flat or hierarchical. Flat clustering
algorithms produce a fixed number of clusters with no relationships between the clusters. Hierarchical approaches produce a tree of clusters, starting with the broadest level clusters at the root and the narrowest at the leaves. K-means [24] is one of the most popular learning algorithms for use with document clustering and other clustering problems. It has been reported as one of the top 10 algorithms in data mining [39]. Despite research into many other clustering algorithms it is often the primary choice for practitioners due to its simplicity [17] and quick convergence [1]. Other hierarchical clustering approaches such as repeated bisecting k-means [32], K-tree [7] and agglomerative hierarchical clustering [32] have also been used. Further methods such as graph partitioning algorithms [21], matrix factorisation [40], topic modeling [5] and Gaussian mixture models [9] have also been used. The k-means algorithm [24] uses the vector space model by iteratively optimising k centroid vectors which represent clusters. These clusters are updated by taking the mean of the nearest neighbours of the centroid. The algorithm proceeds to iteratively optimise the sum of squared distances between the centroids and the set of vectors that they are nearest neighbours to (clusters). This is achieved by iteratively updating the centroids to the cluster means and reassigning nearest neighbours to form new clusters, until convergence. The centroids are initialized by selecting k vectors from the document collection uniformly at random. It is well known that k-means is a special case of Expectation Maximisation [9] with hard cluster membership and isotropic Gaussian distributions. The k-means algorithm has been shown to converge in a finite amount of time [31] as each iteration of the algorithm visits a possible permutation without revisiting the same permutation twice, leading to a worst case analysis of exponential time. Arthur et. al. [1] have performed a smoothed analysis to explain the quick convergence of kmeans theoretically. This is the same analysis that has been applied to the simplex algorithm, which has a n2 worst case complexity but usually converges in linear time on real data. While there are point sets that can force k-means to visit every permutation, they rarely appear in practical data. Furthermore, most practitioners limit the number of iterations k-means can run for, which results in linear time complexity for the algorithm. While the original proof of convergence applies to k-means using squared Euclidean distance [31], newer results show that other similarity measures from the Bregman divergence class of measures can be used with the same complexity guarantees [3]. This includes similarity measures such as KL-divergence, logistic loss, Mahalanobis distance and Itakura-Saito distance. Ding and He [13] demonstrate the relationship between kmeans and Principle Component Analysis. PCA is usually thought of as a matrix factorisation approach for dimensionality reduction where as k-means is considered a clustering algorithm. It is shown that PCA provides a solution to the relaxed k-means problem, thus formally creating a link between k-means and matrix facortisation methods.
4
Document Clustering Evaluation
Evaluating document clustering is a difficult task. Intrinsic or internal measures of quality such as distortion or log likelihood only indicate how well an algorithm optimised a particular representation. Intrinsic comparisons are inherently limited by the given representation and are not comparable between different representations. Extrinsic or ex-
ternal measures of quality compare a clustering to an external knowledge source such as a ground truth labeling of the collection or ad hoc relevance judgments. This allows comparison between different approaches. Extrinsic views of truth are created by humans and suffer from the tendency for humans to interpret document topics differently. Whether a document belongs to a particular topic or not can be subjective. To further complicate the problem there are many valid ways to cluster a document collection. It has been noted that clustering is ultimately in the eye of the beholder [14]. When comparing a cluster solution to a labeled ground truth, the standard measures of Purity, Entropy, NMI and F1 are often used to determine the quality of clusters with regard to the categories. Let ω = {w1 , w2 , . . . , wK } be the set of clusters for the document collection D and ξ = {c1 , c2 , . . . , cJ } be the set of categories. Each cluster and category is a subset of the document collection, ∀c ∈ ξ, w ∈ ω : c, w ⊂ D. Purity assigns a score based on the fraction of a cluster that is the majority category label, argmax c∈ξ
|c ∩ wk | , |wk |
(1)
in the interval [0, 1] where 0 is absence of purity and 1 is total purity. Entropy defines a probability for each category and combines them to represent order within a cluster, −
J |cj ∩ wk | 1 X |cj ∩ wk | log , log J j=1 |wk | |wk |
(2)
which falls in the interval [0, 1] where 0 is total order and 1 is complete disorder. F1 identifies a true positive (tp) as two documents of the same category in the same cluster, a true negative (tn) as two documents of different categories in different clusters and a false negative (f n) as two documents of the same category in different clusters where the score combines these classification judgements using the harmonic mean, 2 × tp . 2 × tp + f n + f p
(3)
The Purity, Entropy and F1 scores assign a score to each cluster which can be micro or macro averaged across all the clusters. The micro average weights each cluster by its size, giving each document in the collection equal importance in the final score. The macro average is simply the arithmetic mean, ignoring the size of the clusters. NMI makes a tradeoff between the number of clusters and quality in an information theoretic sense. For a detailed explanation of these measures please consult Manning et. al. [25].
4.1
NCCG
The NCCG evaluation measure has been used for the evaluation of document clustering at INEX [26; 8]. It is motivated by van Rijsbergen’s cluster hypothesis [20]. If the hypothesis holds true, then relevant documents will appear in a small number of clusters. A document clustering solution can be evaluated by measuring the spread of relevant documents for the given set of queries. NCCG is calculated using manual result assessments from ad hoc retrieval evaluation. Evaluations of ad hoc retrieval occur in forums such as INEX [2], CLEF [15] and TREC [6]. The manual query assessments are called the relevance judgments and have been used to evaluate ad hoc retrieval of documents. The process involves defining
a query based on the information need, a retrieval system returning results for the query and humans judging whether the results returned by a system are relevant to the information need. The NCCG measure tests a clustering solution to determine the quality of clusters relative to the optimal collection selection. Collection selection involves splitting a collection into subsets and recommending which subsets need to be searched for a given query. This allows a retrieval system to search fewer documents, resulting in improved runtime performance over searching the entire collection. The NCCG measure has complete knowledge of which documents are relevant to queries and orders clusters in descending order by the number of relevant documents it contains. We call this measure an “oracle” because it has complete knowledge of relevant documents. A working retrieval system does not have this property, so this measure represents an upper bound on collection selection performance. Better clustering solutions in this context will tend to group together relevant results for previously unseen ad hoc queries. Real ad hoc retrieval queries and their manual assessment results are utilised in this evaluation. This approach evaluates the clustering solutions relative to a very specific objective – clustering a large document collection in an optimal manner in order to satisfy queries while minimising the search space. The measure used for evaluating the collection selection is called Normalised Cumulative Cluster Gain (NCCG) [26]. The Cumulative Gain of a Cluster (CCG) is defined by the Pnnumber of relevant documents in a cluster, CCG(c, t) = i=1 Reli . A sorted vector CG is created for a clustering solution, c, and a topic, t, where each element represents the CCG of a cluster. It is normalised by the ideal gain vector, |CG|
SplitScore(t, c) =
X cumsum(CG) n2r
,
(4)
where nr is total number of relevant documents for the topic, t. The worst possible split places one relevant document in each cluster represented by the vector CG1, |CG1|
MinSplitScore(t, c) =
X cumsum(CG1) . n2r
(5)
NCCG is calculated using the previous functions, SplitScore(t, c) − MinSplitScore(t, c) NCCG(t, c) = . 1 − MinSplitScore(t, c) (6) It is then averaged across all topics.
4.2
Single and Multi Label Evaluation
Both the clustering approaches and the ground truth can be single or multi label. Examples of algorithms that produce multi label clusterings are soft or fuzzy approaches such as fuzzy c-means [4], Latent Dirichlet Allocation [5] or Expectiation Maximisation [9]. A ground truth is multi label if it allows more than one category label for each document. Any combination of single or multi label clusterings or ground truths are able to be used for evaluation. However, it is only reasonable to compare approaches using the same combination of single or multi label clustering and ground truths. Multi label approaches are less restrictive than single label approaches as documents can exist in more than one category. There is redundancy in the data
whether it is clustering or a ground truth. This redundancy has a real and physical costs when clustering is used for collection selection. More storage and compute resources are required with a multi label clustering as one document has to be stored and processed on more than one computer. A ground truth can be considered a clustering and compared to another ground truth to measure how well the ground truths fit each other. Furthermore, a ground truth can be used as a clustering solution and used for collection selection. The evaluation of document clustering using ad hoc information retrieval can be viewed as being similar to an evaluation using a multi label category based ground truth. A document can be relevant to more than one query. However, unlike a category based approach, each query is evaluated separately and then averaged across all queries. In contrast, all categories are evaluated at once and the score is not averaged across categories.
5
Ineffective Clustering
In this paper we introduce the concept of an ineffective clustering. An ineffective clustering produces a high score according to an evaluation measure but does not represent any inherent value as a clustering solution. The Purity evaluation measure has an obvious ineffective case. If each cluster contains one document then it is 100% pure with respect to the ground truth. A single document is the majority of the cluster. As the goal of clustering is to produce groups of documents or to summarise the collection, this is obviously flawed as it does neither. The same applies to the Entropy measure as the probability of a label for a cluster is 100%, resulting in the highest possible Entropy score. The NCCG measure is ineffective when one cluster contains all the documents except for every other cluster containing one document. The NCCG measure orders clusters by the number of relevant documents they contain. A large cluster containing most documents will almost always be ranked first. Therefore, almost all relevant documents will exist in one cluster, achieving almost the highest score possible.
6
Work Performed by a Clustering
To overcome ineffective clusterings in the previous section, we introduce the concept of work performed by a clustering approach. Work is defined as an increase in quality of a clustering over a simple approach that ignores the documents being clustered. A useful clustering performs work beyond an approach that is purely random and ignores document content. If a random approach that performs no useful learning performs equally to an approach that attempts to learn from that data, it would appear that nothing has been achieved by analysing the data. We suggest that an ineffective clustering performs no useful learning. This is supported by a theoretical and experimental analysis in the following sections. Figures 1 and 2 illustrate an approach using a clustering algorithm and a random approach that ignores document content. The difference in cluster quality between these two approaches represents work completed by a clustering algorithm.
BOT
Figure 1: A Clustering Produced by a Clustering Algorithm
Figure 2: A Random Baseline Distributing Documents into Buckets the Same Size as a Clustering
7
Divergence from a Random Baseline
Many measures of cluster quality can give high quality scores for particular clustering solutions that are not of high quality by changing the number of clusters or number of documents in each cluster. Measures that can be misled by creating an ineffective clustering can be adjusted by subtraction from a randomly generated clustering with the same number of clusters with the same number of documents in each cluster. Figures 1 and 2 highlight this example where the random baseline distributes documents into buckets the same size as the clusters found by the clustering algorithm. Apart from the random assignment of documents to clusters, the random baseline appears the same as the real solution. Therefore, each clustering evaluated requires a random baseline that is specific to that clustering. The baseline is created by shuffling the documents uniformly randomly and splitting them into clusters the same size as the clustering being measured. The score for the random baseline clustering is subtracted from the matching clustering being measured. The divergence from a random baseline approach can be applied to any measure of cluster quality whether it is intrinsic of extrinsic. However, it does require an existing measure of cluster quality. It is not a measure by itself but an approach to ensure a clustering is doing something sensible. Although we have highlighted its use for document clustering evaluation, it can be used for any clustering eval-
uation. There are two issues at play here. Firstly, different distributions of cluster sizes can lead to arbitrarily high scores. The second issue is determining if the clustering algorithm is effectively learning with respect to a measure of quality. The divergence from a random baseline takes care of ineffective solutions in either case. If the internal ordering of clusters is no better than random noise then it achieves a score of zero. A negative score could be achieved as the random baseline scores a positive value using most measures on most data sets. It is possible for a clustering to have a worse score than the baseline. For example, a clustering approach could maximise dissimilarity of documents in clusters. This will create a solution where the most dissimilar documents are placed together, resulting in a worse score than random assignment. The random assignment does not bias the clustering towards or away from the measure of quality. If a clustering approach is in fact learning something with respect to the measure of quality, then it is expected that is will be biased towards it. Alternatively, if we reverse the optimisation process, it should be biased away from it. Let ω = {w1 , w2 , . . . , wK } be the set of clusters for the document collection D and ξ = {c1 , c2 , . . . , cJ } be the set of categories. Each cluster and category is a subset of the document collection, ∀c ∈ ξ, w ∈ ω : c, w ⊂ D. We define the probability of a category in the baseline given |c | a cluster as, Pb (cj |wk ) = P j|ci | . The probability of a i category given a cluster in the baseline only depends on the size of the categories. The baseline is a uniformly randomly shuffled list of documents that has been split into clusters that match the cluster size distribution in the solution being evaluated. Thus, within each cluster in the baseline is random uniform noise. It is not biased by the document representation. So, it is expected categories will occur at a rate proportional to the category’s size. For example, if there are three categories A, B, C containing 10, 20, 30 documents, each cluster in the baseline is expected to con20 30 tain approximately 10 60 A, 60 B, and 60 C. This only reflects the size distribution of the categories. We let any measure of a cluster quality be interpreted as a probability. Although this is not formally the case for all measures, it serves as a reasonable explanation. We define the probability of a category in a cluster given the ground truth as, Ps (cj |wk ) = any measure of cluster quality. The Purity measure assigns an actual probability to each cluster when there is a single label ground truth. All the P |c ∩w | probabilities combined accumulate to one, j j|wk |k = 1, and the category with the largest maximum likelihood estimate is assigned to each cluster, PPurity (cj |wk ) = |c ∩w | argmaxcj j|wk |k . This is the proportion of the cluster that has the majority category label. It also represents the same process of using clustering for classification with labeled data where an unseen sample is labeled based on the majority category label of the cluster it is nearest neighbour to. We define d as a document in D. The ground truth is restricted to being single label where a document, d, only has only one label in one category in the ground truth, ∀d ∈ D, ci ∈ ξ, cj ∈ ξ : d ∈ ci ∧ d ∈ / cj ∧ ci 6= cj . The adjusted measure is the difference between the submission and the baseline. We define the adjusted probability of a category given a cluster as, Pa (cj |wk ) = Ps (cj |wk ) − Pb (cj |wk ). An alternative formal view of divergence from a ran-
8
0.65
0.60
Micro Purity
0.55
0.50
0.45
0.40
0.35 600
800
0.20
0.15
0.10
0.05
0.00 400
600
800
1000
Clusters
Participants were asked to submit multiple clustering solutions containing approximately 50, 100, 200, 500 and 1000 clusters. The categories extracted contained 36 categories due to only using categories with greater than 3000 documents. This choice was arbitrary and the decision for cluster sizes was made based on the number of documents in the collection before the categories were extracted. The number of categories in a document collection is subjective. Therefore, a direct comparison of 36 clusters with 36 categories is not necessary. Measuring how the categories behave over multiple cluster sizes indicates the quality of clusters and the trend can be visualised. A legend for Figures 4 to 9 can be found in Figure 3. The Struck−star tured Linked Vector Random with Uniform Cluster Size Model (SLVM) [37] Structured Linked Vector Model incorporates document TopSig 1024 bit k−means structure, links and content. The k-star [34] Figure 3: Legend is an iterative clustering method for grouping documents. The TopSig approach [16] produces binary strings that represent documents and a modified k-means algorithm that works directly with this representation.
400
0.25
200
Application at the INEX 2010 XML Mining Track
200
0.30
Micro Purity Divergence
dom baseline can be defined by a quality function, m : PP(Z × Z) → R, that takes a set of clusters as a set of set of (document, category label) pairs, s, and returns a real number indicating the quality of the clustering. Examples of these cluster quality functions are Entropy, F1, NCCG, Negentropy, NMI and Purity. There exists a function, r : PP(Z × Z) → PP(Z × Z), that generates a random baseline, b, given a clustering solution, s. The baseline has the same number of clusters as the clustering solution, |b| = |s|. For every cluster in each of the original clustering, s, and the baseline, b, the corresponding clusters contain the same number of documents, ∀k : |sk | = |bk |. The adjusted measure, ma : PP(Z × Z) → R, becomes, ma (s) = m(s) − m(r(s)).
1000
Clusters
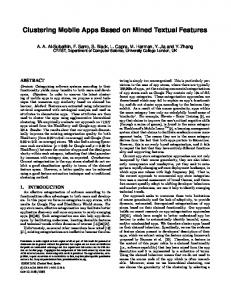
Figure 4: Purity Submissions using the k-star method at INEX 2010 [34] contained several large clusters and many other small clus-
Figure 5: Purity Subtracted from a Random Baseline ters. This exposed weakness in the NCCG measure, which resulted in inappropriately high scores. When the scores are subtracted from a random baseline with the same properties they performed no better than a randomly generated solution. This can be clearly seen in Figures 6 and 7 where the k-star method changes drastically between the original score and the score when subtracted from a random baseline. The NMI measure is almost unaffected by subtraction from a random baseline where as other measures have a larger difference. Figures 8 and 9 highlight this property on submissions from INEX 2010. This suggests that the normalisation we have proposed is similar to that of NMI but is applicable to any measure of cluster quality whether it is intrinsic or extrinsic. Figures 4 and 5 demonstrate how the difference between the adjusted and unadjusted measures is larger for measures that are not normalised. Each line represents a different document clustering system. The bottom most line in each graph is a randomly generated clustering submission where a category for a document is selected uniformly at random from the set of categories. Note that this random clustering in the figures differs from the random baseline. The cluster size distribution is also uniform. A random baseline has a cluster size distribution that is specific to the clustering being evaluated. When compared to the random baseline the expected results are achieved, with a score of zero for all cluster sizes. Note that without adjusting the cluster size distribution, it is not able to differentiate ineffective clusterings as per the NCCG metric in Figure 7. Subtracting the random submission with uniform cluster sizes from the NCCG submission does not reduce its score to zero as can be seen in Figure 6. Figures 10 and 11 demonstrate the application of the divergence from random baseline approach on an intrinsic measure. RMSE is the Root Mean Squared Error of the clustering using the cosine similarity measure. The higher value the better the clustering. A cosine similarity of 1 indicates the document and the cluster centre are identical. A score of 0 indicates they are orthogonal and therefore have no overlap in vocabulary. This experiment was run on a 10,000 document randomly selected sample. The kmeans algorithm was used to produce k clusters between 1 and 10,000. Subtraction from a random baseline assigns a score of zero to these ineffective cases. Furthermore, it provides a clear maximum for RMSE.
0.15
NMI Divergence
0.8
NCCG
0.6
0.4
0.10
0.05
0.2 0.00 200
400
600
800
200
1000
400
600
800
1000
Clusters
Clusters
Figure 9: NMI Subtracted from a Random Baseline
Figure 6: NCCG
1.0
0.6
RMSE
NCCG Divergence
0.8 0.4
0.6
0.2 0.4
0.0 0.2 200
400
600
800
1000
0
Clusters
2000
4000
6000
8000
10000
8000
10000
Clusters
Figure 7: NCCG Subtracted from a Random Baseline
Figure 10: RMSE
0.15
RMSE Divergence
0.20
NMI
0.10
0.05
0.15
0.10
0.05
0.00
0.00 200
400
600
800
1000
Clusters
0
2000
4000
6000
Clusters
Figure 8: NMI
Figure 11: RMSE Subtracted from a Random Baseline
In this paper we introduced problems encountered in evaluation of document clustering. This is the concept of ineffective clustering and a notion of work. The divergence from random baseline approach deals with these corner cases
and increases the confidence that a clustering approach is achieving meaningful learning with respect to any view of cluster quality. It is also applicable to any clustering evaluation but was only discussed in the context of document clustering in this paper.
9
Conclusion
Divergence from a random baseline was formally defined and analysed experimentally with both intrinsic and extrinsic measures of cluster quality. Furthermore, this approach appears to be performing a normalisation similar to that performed by NMI. It also provides a clear optimum for distortion as measured by RMSE.
References [1]
D. Arthur, B. Manthey, and H. Roglin. k-means has polynomial smoothed complexity. IEEE FOCS, 0:405–414, 2009.
[2]
P. Arvola, S. Geva, J. Kamps, R. Schenkel, A. Trotman, and J. Vainio. Overview of the INEX 2010 ad hoc track. INEX 2010, pages 1–32, 2011.
[3]
A. Banerjee, S. Merugu, I.S. Dhillon, and J. Ghosh. Clustering with Bregman divergences. JMLR, 6:1705–1749, 2005.
[4]
J.C. Bezdek, R. Ehrlich, et al. FCM: The fuzzy c-means clustering algorithm. Computers & Geosciences, 10(23):191–203, 1984.
[5]
D.M. Blei, A.Y. Ng, and M.I. Jordan. Latent Dirichlet allocation. The Journal of Machine Learning Research, 3:993– 1022, 2003.
[6]
C.L.A. Clarke, N. Craswell, I. Soboroff, and G.V. Cormack. Overview of the TREC 2010 web track. Technical report, DTIC Document, 2010.
[7]
C.M. De Vries and S. Geva. Document clustering with Ktree. INEX 2008, pages 420–431, 2009.
[8]
C.M. De Vries, R. Nayak, S. Kutty, S. Geva, and A. Tagarelli. Overview of the INEX 2010 XML mining track: Clustering and classification of XML documents. INEX 2010, pages 363–376, 2011.
[9]
A.P. Dempster, N.M. Laird, and D.B. Rubin. Maximum likelihood from incomplete data via the EM algorithm. Journal of the Royal Statistical Society. Series B (Methodological), pages 1–38, 1977.
[10] L. Denoyer and P. Gallinari. Report on the XML mining track at INEX 2007 categorization and clustering of XML documents. In ACM SIGIR Forum, volume 42, pages 22– 28. ACM, 2008. [11] L. Denoyer and P. Gallinari. Overview of the INEX 2008 XML mining track. INEX 2008, pages 401–411, 2009. [12] L. Denoyer, P. Gallinari, and A.M. Vercoustre. Report on the XML mining track at INEX 2005 and INEX 2006. INEX 2006, pages 432–443, 2007. [13] C. Ding and X. He. K-means clustering via principal component analysis. In ICML, page 29. ACM, 2004. [14] V. Estivill-Castro. Why so many clustering algorithms: a position paper. ACM SIGKDD Explorations Newsletter, 4(1):65–75, 2002. [15] P. Forner, J. Gonzalo, J. Kek¨al¨ainen, M. Lalmas, and M. De Rijke. CLEF 2011, volume 6941. 2011. [16] Shlomo Geva and Christopher M. De Vries. Topsig: topology preserving document signatures. In CIKM 2011, pages 333–338. ACM, 2011. [17] I. Guyon, U. von Luxburg, and R.C. Williamson. Clustering: Science or art. In NIPS Workshop on Clustering Theory, 2009. [18] Z.S. Harris. Distributional structure. Word, 1954. [19] M.A. Hearst and J.O. Pedersen. Reexamining the cluster hypothesis: scatter/gather on retrieval results. In SIGIR, pages 76–84. ACM, 1996. [20] N. Jardine and C.J. van Rijsbergen. The use of hierarchic clustering in information retrieval. Information storage and retrieval, 7(5):217–240, 1971.
[21] G. Karypis, E.H. Han, and V. Kumar. Chameleon: Hierarchical clustering using dynamic modeling. Computer, 32(8):68–75, 1999. [22] A. Kyriakopoulou and T. Kalamboukis. Using clustering to enhance text classification. In SIGIR, pages 805–806. ACM, 2007. [23] K.S. Lee, W.B. Croft, and J. Allan. A cluster-based resampling method for pseudo-relevance feedback. In SIGIR 2008, pages 235–242. ACM, 2008. [24] S. Lloyd. Least squares quantization in PCM. IEEE Transactions on Information Theory, 28(2):129–137, March 1982. [25] C. D. Manning, P. Raghavan, and H. Sch¨ utze. Introduction to Information Retrieval. Cambridge University Press, NY, USA, 2008. [26] R. Nayak, C.M. De Vries, S. Kutty, S. Geva, L. Denoyer, and P. Gallinari. Overview of the INEX 2009 XML mining track: Clustering and classification of XML documents. INEX 2009, pages 366–378, 2010. [27] R. Nayak, R. Witt, and A. Tonev. Data mining and XML documents. 2002. [28] S.E. Robertson, S. Walker, S. Jones, M.M. HancockBeaulieu, and M. Gatford. Okapi at trec-3. In Proceedings of the seventh Text REtrieval Conference, 1995. [29] G. Salton and C. Buckley. Term-weighting approaches in automatic text retrieval. Information processing & management, 24(5):513–523, 1988. [30] G. Salton, A. Wong, and C.S. Yang. A vector space model for automatic indexing. CACM, 18(11):613–620, 1975. [31] S.Z. Selim and M.A. Ismail. K-means-type algorithms: a generalized convergence theorem and characterization of local optimality. IEEE Transactions on Pattern Analysis and Machine Intelligence, (1):81–87, 1984. [32] M. Steinbach, G. Karypis, V. Kumar, et al. A comparison of document clustering techniques. In KDD workshop on text mining, volume 400, pages 525–526. Boston, 2000. [33] A.H. Tan. Text mining: The state of the art and the challenges. In PAKDD, pages 65–70, 1999. [34] M. Tovar, A. Cruz, B. V´azquez, D. Pinto, and D. Vilari˜no. An iterative clustering method for the XML-mining task of the INEX 2010. INEX 2010, 2011. [35] A. Trotman, X.F. Jia, and S. Geva. Fast and effective focused retrieval. INEX 2010, pages 229–241, 2010. [36] E. Voorhees. The philosophy of information retrieval evaluation. In Evaluation of cross-language information retrieval systems, pages 143–170. Springer, 2002. [37] F. Wang, S. amd Liang and J. Yang. PKU at INEX 2010 XML mining track. INEX 2010, 2010. [38] J.S. Whissell and C.L.A. Clarke. Improving document clustering using Okapi BM25 feature weighting. Information Retrieval, pages 1–22, 2011. [39] X. Wu, V. Kumar, J. Ross Quinlan, J. Ghosh, Q. Yang, H. Motoda, G.J. McLachlan, A. Ng, B. Liu, P.S. Yu, et al. Top 10 algorithms in data mining. Knowledge and Information Systems, 14(1):1–37, 2008. [40] Wei Xu, Xin Liu, and Yihong Gong. Document clustering based on non-negative matrix factorization. In SIGIR, pages 267–273. ACM, 2003. [41] G.K. Zipf. Human behavior and the principle of least effort: An introduction to human ecology. Addison-Wesley Press, 1949.