Document Similarity Based on Concept Tree Distance Praveen Lakkaraju
Susan Gauch
Mirco Speretta
University of Kansas EECS Department 2001 Eaton Hall, Lawrence, KS (785) 864-4620
University of Arkansas CSCE Department JBHT-CSCE 504 (479) 575-6036
University of Arkansas CSCE Department JBHT-CSCE 504 (479) 575-6036
[email protected]
[email protected]
[email protected]
ABSTRACT The Web is quickly moving from the era of search engines to the era of discovery engines. Whereas search engines help you find information you are looking for, discovery engines help you find things that you never knew existed. A common discovery technique is to automatically identify and display objects similar to ones previously viewed by the user. Core to this approach is an accurate method to identify similar documents. In this paper, we present a new approach to identifying similar documents based on a conceptual tree-similarity measure. We represent each document as a concept tree using the concept associations obtained from a classifier. Then, we make employ a tree-similarity measure based on a tree edit distance to compute similarities between concept trees. Experiments on documents from the CiteSeer collection showed that our algorithm performed significantly better than document similarity based on the traditional vector space model.
Categories and Subject Descriptors H.3.3 [Programming Languages]: Information Search and Retrieval.
General Terms Algorithms, Measurement.
Keywords Document similarity, concept trees, concept vectors, conceptual search, recommender systems, tree-edit distance.
1. INTRODUCTION The Web is quickly moving from the era of search to the era of discovery. Systems can help users discover things by locating and presenting new information that is similar to the items in which the user has previously or currently expressed interest. Examples are the 'more like this' or 'similar pages' links that accompany the search results of Web search engines, product recommendations by e-commerce Websites such as Amazon, document
Permission to make digital or hard copies of all or part of this work for personal or classroom use is granted without fee provided that copies are not made or distributed for profit or commercial advantage and that copies bear this notice and the full citation on the first page. To copy otherwise, or republish, to post on servers or to redistribute to lists, requires prior specific permission and/or a fee. Conference’04, Month 1–2, 2004, City, State, Country. Copyright 2004 ACM 1-58113-000-0/00/0004…$5.00.
recommendations by digital libraries like CiteSeer1, and related News links on some news websites. The objects to be recommended can be selected in different ways. Content-based approaches recommend objects based on features extracted from the objects themselves. For document recommendations, the most widely used technique is to calculate document similarity based on the vector space model’s cosine similarity measure [13]. Although this approach is simple to implement, the keyword vectors can be extremely sparse and it also suffers from the problem of semantic ambiguity. Semantic ambiguity can be overcome by considering concept vectors rather than keyword word vectors [14]. However, the concept space is often represented as a hierarchical tree structure, or taxonomy. Representing the documents as concept vectors ignores the parent-child relationships between the concepts in the taxonomy that could be used while computing the similarity between two documents. In this study, we try to exploit the hierarchical relationships between concepts by representing a document as a ‘concept tree’. The problem of matching trees finds application in a wide range of areas such as computational biology, compiler optimization, computer vision, XML databases and natural language processing. One of the popular methods used in comparing trees is the tree edit distance algorithm [7]. In this study, we introduce a novel technique to construct concept trees representing documents and we apply the tree edit distance algorithm to calculate document similarity. The rest of the paper is structured as follows: In Section 2, we present related work in the field. Section 3 introduces our approach and describes the system architecture. Experiments and results are presented in Section 4.
2. RELATED WORK The literature related to computing similarity between data objects can be divided into two broad categories. The first uses the semantic information included in the data objects [11] whereas the second makes use of the extraneous information about the data objects such as the concepts to which they belong and the structural context in which they occur [6]. Since we make use of the concepts associated with the documents, but the concepts are automatically associated using the document contents, we are a hybrid of these two approaches. Thus, we review some of the related work in both these categories and some research projects
1
http://acm.org/class/1998/
3.2 Tree Builder Module
that have made use of the Tree Edit Distance algorithm to compute similarity.
The tree builder module takes as input the concept vectors obtained from the previous module and generates the corresponding weighted concept tree. All concept trees are derived from a common reference tree. Each node is represented by a label, which has a weight associated. A label is a category ID or category name and the associated weight is a value representing the strength of the match between the given category and the domain of the document. The concept tree is generated as follows: for each category in the concept vector, the algorithm recursively propagates weights to the parent node until the root node is reached. Weights are assigned to parents according to the following equation:
Wan and Peng use the Earth Mover’s Distance measure to compute document similarity [15]. The Earth Mover’s distance, or EMD [9], computes the distance between two distributions represented by signatures. Since it computes similarity as the minimum amount of work needed to change one signature into the other, this EMD-based approach is similar to our own work. However, we represent documents as concept trees rather than making use of individual words and semantic word distances. More recently, there has been an increased emphasis on modeling objects using more complex data structures for the domain such as graphs or trees. In [5], Ganesan at al. present new similarity measures that incorporate the hierarchical structure of any given domain. Although we share a similar motivation, all of their measures require that the elements occur at leaves of the hierarchy, which is not a restriction that applies to the tree-edit distance algorithm. The tree edit distance algorithm is a popular measure for tree comparison. It was first introduced by Tai [7] in late 1970’s as an extension to the string edit distance problem and many variations and optimizations of this algorithm have been developed since [3, 7]. The edit distance between two trees A and B is the minimum cost of transforming A into B by a sequence of elementary operations such as insertion, deletion and substitution of nodes. Since the tree-edit distance algorithm can be modified to suit the requirements of a wide variety of applications, it has been used to compare the similarity between data objects in many different applications [10, 16, 1]. In our case, we deal with concept trees derived from a common parent taxonomy.
W Parent = " *WChild where WParent is the weight of the parent. WChild is the weight of the child and
!
α is the weight propagation factor. The weight propagation factor α is used to determine how much of a child’s weight is propagated to its parent. When α = 0 the parents will not be assigned any part of the child’s weight. In this case, we would essentially be dealing with concept vectors themselves since the parents will not have any role in the matching process. All the concepts are part of the same taxonomy and all the generated concept trees maintain the root and the hierarchical structure of the reference tree. Figure 1 shows a taxonomy that we will use as example to describe the process of generating a concept tree. The structure is three levels deep and
3. APPROACH
R
The system consists of three modules: the Classification module, the Tree Builder module, and the Tree Matching module. All modules interact as a chain in which the output of the previous module is the input of the next module.
3.1 Tree Classification Module The first step in our approach is to classify the set of input documents. Any classifier can be used for this purpose. The process of classification normally starts by collecting a set of training documents and choosing the taxonomy of categories relevant to the domain that the input documents belong to. The training set contains documents which are pre-assigned one or more categories in the taxonomy either manually or by some other method. Classification consists of two stages, the training stage and the classification stage. In the training stage, the classifier uses the training documents to build a model for each category in the taxonomy. This model will be used to classify the input documents at the classification stage. The output of the classification stage is a list of top categories for each input document along with their weights. There are a number of classifiers available and the choice of the classifier depends on a lot of different factors. Some of these are the domain of the input documents, the size of these documents, the amount of training data available and the size of the taxonomy being used. For our experiments we made use of a vector space classifier and the ACM’s classification hierarchy. These are discussed in detail in Section 4.1.
A
E
N
B
F
O
G
P
Q
C
H
S
I
T
J
U
D
K
V
L
W
M
X
Y
Z
each node represents a unique concept. Figure 1 Sample Taxonomy Let us consider the two sample documents, D1 and D2 and their corresponding concept vectors. Let the corresponding concept vectors obtained from the classification step, represented as lists of (conceptID, weight) pairs because they are so sparse, be the following: D1 = { (F, 40), (C, 30), (E, 20), (A, 10) } D2 = { (U, 60), (V, 40), (A, 20), (K, 10) } Figure 2 shows the step-by-step process of transforming the concept vector for document D2 into a concept tree T2, using the taxonomy shown in Figure 1. In this example, the α factor used to propagate weights from the child to the parent is set to 0.5. Using the same process we obtained the concept tree T1 for D1 that is shown above in Figure 3. In the above figures, bold nodes represent concepts that appear in the original concept vectors, i.e., they are not added by the tree building process. Each node is
labeled with the concept ID and the corresponding weight is assigned. R:12.5
R:7.5
C:25
C:15
U:60
A:20
J:50
J:30 U:60
R:25
R:22.5 C:25
A:20 J:50
J:50 V:40
U:60
C:30
V:40
U:60
K:10 V:40
Figure 2 Step by step process of building the concept tree T2 of Document D2
3.3 Tree Matching Module This module is responsible for matching pairs of concept trees by using the Tree Edit Distance technique. This algorithm finds the cost of transforming one concept tree to the other using predefined operations. Each type of operation has a specific cost. The lower the total cost of transformations between two trees, the more similar they are. The three operations we consider for transforming one concept tree to another are insertion, deletion and substitution of nodes. The cost associated with insertion or deletion of a node is equal to the corresponding weight of the node that is being inserted or deleted. Similarly, the cost associated with substitution of a node with a node from the other tree is the difference between their corresponding weights. Since all concept trees are part of the same taxonomy, we can assume that the missing nodes are actually present with a weight of zero. Hence, we have the same complete concept tree for each document and the process of transforming one tree to the other simplifies to a series of substitution operations. In Figure 3 we describe the steps to transform T1 into T2, the concept tree shown in Figure 2. For each step of the transformation, we show the operation being performed and also the total cost after that operation, i.e., the previous cost plus the
taxonomy to create all the concept trees. Thus, the nodes are unique and their order is the same among all concept trees. More complex algorithms would be necessary if the trees belonged to different taxonomies wherein the same concepts exist in different levels with non-uniform ordering.
4. EVAUATION METHODOLOY AND RESULTS 4.1 Dataset and Methodology The evaluation is based on a subset of the CiteSeer collection. CiteSeer is an automated digital library for scholarly literature in computer and information sciences. It consists of over 700,000 academic science papers and over 10 million citations. We randomly selected 50,100 documents from this collection to serve as dataset. The first step was to classify each document in the collection. We used the ACM’s classification hierarchy, the Computing Classification System (CCS)2 as reference taxonomy because it covers the concepts discussed by the documents in the CiteSeer collection. This taxonomy is three levels deep with a total of 368 categories. Based on our previous experimental results[8], we used a vector space classifier. Our training data consisted of documents from the CiteSeer collection that were manually classified by their authors into one or more of the ACM categories. We trained the classifier with 13 training documents per category. We used the 146 categories of the taxonomy that had enough training data, i.e., 13 or more author-tagged documents, for classifying the documents in the dataset. We classified all the input documents and created concept vectors for each containing the highest-weighted top 20 concepts. Then, using the tree-building algorithm discussed in Section 3, we built five concept trees for each document in CiteSeer’s collection each using one of five different values of α, i.e., 0, 0.25, 0.5, 0.75, and 1.
Figure 3 The step-by-step process of transforming concept tree T1 to concept tree T2 cost of the operation. The insertion of a node X is denoted by Add(X), the deletion by Del(X) and the substitution by Sub(X). The initial value of cost, C, is zero. The complexity of our algorithm is O(N), where N is the total number of nodes or concepts in the taxonomy. Our algorithm is computationally inexpensive because we use the same reference
We evaluated our new document similarity measure with a user study involving 9 volunteer graduate students in the EECS department of the University of Kansas. We randomly selected 14
2
http://acm.org/class/1998/
documents from our dataset to serve as the query documents. For each query document, we computed the top 10 most similar documents from the remaining CiteSeer documents using our concept tree similarity measure. We also computed the top 10 most similar document using the baseline algorithm discussed in Section 4.2. Each subject was asked to view the results for at most five query documents. The results for all algorithms were merged, duplicates were removed, and they were presented in random order to avoid bias. The subjects were asked to score each document as to how related it was to the original query document using a scale of as 0 (not related), 1 (somewhat related), or 2(very much related). At the end of the user study, we had ratings for each potentially-related document from 3 different subjects.
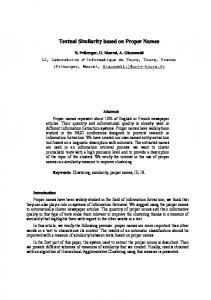
for this value of α, our algorithm performed at least as well as the baseline or better for 11 out of the 14 test documents.
When calculating precision in top 10 and top 3, we considered two different definitions of a good recommendation or “hit”: 1.
2.
At least 2 out of 3: A document is considered to be a good recommendation if at least two of the three users find it related, i.e., scored it 1 or 2. At least 1 out of 3: A document is considered to be a good recommendation if at least one of the three users found it related, i.e., scored it 1 or 2.
We also analyzed the data using other definitions of a ‘hit,’ e.g., calculating the sum of the scores of the 3 judges for each document. However, since those results revealed the same patterns, we will only present the data for the simple voting scheme described above.
4.2 Overview of the Baseline Our baseline algorithm uses the vector space model wherein each document is represented as a vector of words and their associated tf*idf weights. The similarity between two documents is computed by calculating the cosine similarity between document vectors. The current text based recommender system in CiteSeer makes use of this approach. In order to build the baseline for our evaluation, we first indexed all the documents in our dataset except those being used as test documents. We used the keywordonly version of the Keyconcept [14] search system for this purpose. For each test document, we submitted its keyword vector as a query against the index, retrieving the closest 10 documents based on the cosine similarity measure. These were combined with the top 10 results obtained using our new concept tree similarity measure and presented to the users for evaluation. The comparison of the results for the baseline with those for our algorithm is presented in the next Section.
Figure 4 Average Precision in Top-10 and Top-3 for "At least 2 out of 3" Definition
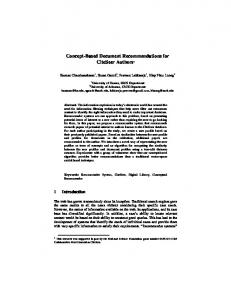
4.3.2 Results for “At least 1 out of 3” Definition Figure 5 below show the results for the average precision in Top10 and Top-3 when we consider the less restrictive definition of a hit, i.e., when only one of the three judges considered a document related. We see that once again our algorithm performed better than the baseline for all values of α when examining precision in the top 10 results. The best overall performance was obtained when α = 0.25 and for 11 out of 14 test documents, the algorithm performed better than, or at least as well as, the baseline. The data in Figure 5 reveal the same pattern for precision in the top 3 results, with our algorithm performing better than the baseline for all values of α. The best overall performance was obtained in the cases when α = 0.5 and α = 0.25. In this case, α = 0.25, our algorithm has done better than, or at least as well as, the baseline for all the 14 test documents.
4.3 Results In this section, we report the results from the user study. As mentioned earlier we tried five different weight propagation factors and we calculated the precision in Top-10 and in Top-3 for each of the two definitions of hit described in the previous section.
4.3.1 Results for “At least 2 out of 3” Definition Figure 4 show the average precision in Top-10 and Top-3 results for all queries. The baseline, blue columns, are compared with the 5 different values of α. The data in Figure 4 shows that our algorithm has performed better than the baseline for all the values of α tested. Our algorithm gave the best overall performance in the case when α = 0.25. Closer analysis of the data showed that,
Figure 5 Average Precision in Top-10 and Top-3 for "At least 1 out of 3" Definition In order to verify the statistical significance of our findings, Table 1 reports the results of a two-tailed t-test between the results for the baseline and the concept tree similarity measure with α = 0.25. We notice that our method, which uses the concept tree similarity measure, performed significantly better than the baseline in three of the four cases and just missed significance the fourth case.
Table 1 p values for Baseline versus α=0.25 DEFINITION OF
PRECISION TOP 10
"HIT" Mean for Baseline
Mean for
Improvement
α=0.25
(%)
At least 2 out of 3
47.14
61.43
At least 1 out of 3
77.86
90
PRECISION TOP 3 P value
Mean for Baseline
Mean for
Improvement
α=0.25
(%)
30.31
0.02
50
71.5
43
0.11
15.59
0.05
71.21
92.71
30.19
0.02
From the results, we can conclude that our matching algorithm has performed better than the baseline for all values of α tested and for both definitions of a good hit. Moreover, when α = 0.25, the algorithm performed at its best in all the cases studied. We also observe that the cases that made use of the hierarchical relationships between the concepts performed better than the case α = 0, which just used the concept vectors. This improvement is more pronounced when we looked at the precision in top 3 results. Ranking plays a very important role in the case of related content because users are generally not interested beyond the top 3-5 results.
5. CONCLUSIONS We introduced a new method for calculating inter-document similarity based on a tree matching algorithm. Our concept tree similarity identifies similar documents based on conceptual rather than keyword matches. In addition, by propagating weights from children concepts to their parents, it exploits the hierarchical structure of the concept space. The results of our user study showed that the concept tree similarity measure with a propagation factor of 0.25 outperformed the cosine similarity measure by 15 – 43%. Analysis with the t-test confirmed that the improvements were statistically significant. We are currently evaluating our method using bigger taxonomies and are also implementing a recommender system for the CiteSeer digital library that is based on our concept tree similarity measure [2].
6. ACKNOWLEDGMENTS This research was supported in part by the National Science Foundatation grant number 0454121: CRI: Collaborative: Next Generation CiteSeer.
7. REFERENCES [1] A. Nierman and H. V. Jagadish. "Evaluating Structural Similarity in XML Documents". In Int'l Workshop on the Web and Databases (WebDB), Madison,WI, Jun. 2002. [2] Chandrasekan, K., “Conceptually Based Author Recommender System,” MS thesis, EECS, University of Kansas, Fall 2007. [3] Chen, W. New algorithm for ordered tree-to-tree correction problem. Journal of Algorithms, 40:135–158, 2001. [4] G. Valiente. Algorithms on Trees and Graphs. SpringerVerlag, Berlin, 2002. [5] Ganesan, P., Garcia-Molina, H., and Widom, J. 2003. Exploiting hierarchical domain structure to compute similarity. ACM Trans. Inf. Syst. 21, 1 (Jan. 2003), 64-93. [6] Jeh, G. and Widom, J. 2002. SimRank: a measure of structural-context similarity. In Proceedings of the Eighth ACM SIGKDD international Conference on Knowledge
p value
Discovery and Data Mining (Edmonton, Alberta, Canada, July 23 - 26, 2002). KDD '02. ACM Press, New York, NY, 538-543. [7] K. Tai, ‘The tree-to-tree correction problem’, J. ACM, 26, (3), 422–433 (1979). [8] Lakkaraju, P., “Document Similarity Based on Concept Tree Distance”, MS thesis, EECS, University of Kansas, Summer 2007. [9] Rubner, Y., Tomasi, C., and Guibas, L. J. 2000. The Earth Mover's Distance as a Metric for Image Retrieval. Int. J. Comput. Vision 40, 2 (Nov. 2000), 99-121. [10] Sager, T., Bernstein, A., Pinzger, M., and Kiefer, C. 2006. Detecting similar Java classes using tree algorithms. In Proceedings of the 2006 international Workshop on Mining Software Repositories (Shanghai, China, May 22 - 23, 2006). MSR '06. ACM Press, New York, NY, 65-71. [11] Sahami, M. and Heilman, T. D. 2006. A Web-based kernel function for measuring the similarity of short text snippets. In Proceedings of the 15th international Conference on World Wide Web (Edinburgh, Scotland, May 23 - 26, 2006). WWW '06. ACM Press, New York, NY, 377-386. [12] Salton, G., and Buckley, C. Term weighting approaches in automatic text retrieval”. Tech Report 87-881 Dept. of Computer Science, Cornell University, 1997. [13] Salton, G., and McGill, M. Introduction to Modern Information Retrieval. McGraw-Hill, New York, 1983. [14] Susan Gauch, Juan M. Madrid, Subhash Induri, Devanand Ravindran, and Sriram Chadlavada, KeyConcept: A Conceptual Search Engine, Information and Telecommunication Technology Center, Technical Report: ITTC-FY2004-TR-8646-37, University of Kansas. [15] Wan, X. and Peng, Y. 2005. The earth mover's distance as a semantic measure for document similarity. In Proceedings of the 14th ACM international Conference on information and Knowledge Management (Bremen, Germany, October 31 November 05, 2005). CIKM '05. ACM Press, New York, NY, 301-302. [16] Yang, W. 1991. Identifying syntactic differences between two programs. Softw. Pract. Exper. 21, 7 (Jul. 1991), 739755.Spector, A. Z. 1989. Achieving application requirements. In Distributed Systems, S. Mullender, Ed. Acm Press Frontier Series. ACM Press, New York, NY, 19-33. DOI= http://doi.acm.org/10.1145/90417.90738