Jun 7, 2011 - DOI: http://dx.doi.org/10.3886/DDILongitudinal01 - Page 1 ... real-world examples to formulate best practices concerning the ...... Radloff ..... The best way to do this is with a link to this Web page. ⢠Any of ...
DOCUMENTING A WIDER VARIETY OF DATA USING THE DATA DOCUMENTATION INITIATIVE 3.1
By William C. Block, Christian Bilde Andersen, Daniel E. Bontempo, Arofan Gregory, Stan Howald, Douglas Kieweg, and Barry T. Radler
06/07/2011
Fortunato Castillo, Benjamin Clark, Larry Hoyle, Neeraj Kashyap, Denise Perpich, Joachim Wackerow, and
DDI Working Paper Series – Longitudinal Best Practice, No. 1
Knut Wenzig
This paper is part of a series that focuses on DDI usage and how the metadata specification should be applied in a variety of settings by a variety of organizations and individuals. Support for this working paper series was provided by the authors‘ home institutions; by GESIS Leibniz Institute for the Social Sciences; by Schloss Dagstuhl - Leibniz Center for Informatics; and by the DDI Alliance.
Documenting a Wider Variety of Data Using the Data Documentation Initiative 3.1
Documenting a Wider Variety of Data Using the Data Documentation Initiative 3.1 BEST PRACTICES, EXAMPLES, AND RECOMMENDATIONS FOR EXTENDING THE STANDARD1
PROBLEM STATEMENT/DESCRIPTION This paper looks at the growing variety of data sources in research that are not traditional question-based surveys, and how these can be usefully documented using version 3.1 of the Data Documentation Initiative. These data are increasingly being linked with data collected from more traditional surveys to bring multidisciplinary perspectives to bear on research questions. This phenomenon is not specific to longitudinal studies, but is a common issue in longitudinal contexts. The category of non-survey data is broad and not easily defined. Examples of these types of non-survey data sources include (but are not limited to): administrative, health records, and register data; audio and visual data; batteries or simple scales yielding scores; and data generated by independent hardware instrumentation. The collection of biological measures and physical samples is also included in this category. This short list of non-survey data was not exhaustive; indeed, these data come from a variety of other disciplines and industries not mentioned explicitly here. Not all possible data sources can be anticipated; this is a rapidly evolving field. However, there are enough real-world examples to formulate best practices concerning the documentation of these data. This paper provides guidance on expanding the capability of the Data Documentation Initiative (DDI) standard to document a wider variety of data resources and suggests improvements that may be incorporated into the DDI standard in future versions.
APPROACH We addressed the topic by first examining several real-world examples, and then attempting to generalize from that basis. We then considered the capabilities of DDI 3.1 in light of these examples and prepared sample instances to show how the existing standard can be used. This effort has been conducted with an awareness of the ongoing work to cover qualitative data within the DDI. Our approach is intended to be consistent with that work as it evolves.
ASSUMPTIONS When we consider these sources of data, it appears that there is an extended set of metadata that is needed to sufficiently describe them, often specific to the data source. The goal of this paper is to identify a set of metadata to support secondary analysis of data coming from these disparate sources. It seems probable that 1
The authors gratefully acknowledge the editing assistance provided by Stefan Kramer in the completion of this paper.
DOI: http://dx.doi.org/10.3886/DDILongitudinal01 - Page 1
Documenting a Wider Variety of Data Using the Data Documentation Initiative 3.1
the approach we use here will be useful even for sources of data not specifically described here. While this paper is based on the authors‘ collective experience, the approach seems to be generalizable. Another assumption underlying the approach is that the term ―instrument,‖ often thought of as specific to the social science survey context, may be interpreted in a broader sense to cover many different measurement protocols and devices.
ANALYSIS The specific sources we considered include (but are not limited to): • • •
•
• •
•
Audio and audio-visual recordings (may be an entire interview, or an evoked response) Images (e.g., x-rays, pictures of respondents, observation photos of neighborhood conditions) Biological data/biomarker information o Physical samples (blood, saliva, urine, tissue) o Biometrics (height, weight, grip strength, blood pressure, physiological waveform data) o Clinical assessments and diagnoses Administrative and register data o Health registries o Social service records (e.g., unemployment insurance applications) o Criminal justice information o Vital statistics (birth, death, marriage data) o Employment records Diaries (free text provided by the respondent) Psychometrics o Cognitive tests and batteries (digit span, Stroop test) o Constructed scales (possibly proprietary) Performance metrics o Skill tests o Balance, gait, coordination, mobility
Many of these categories include data coming from measurement tools which may be physical devices, or software tools. One important distinction is that in some cases, the data collected must be subjected to a process (scoring, aggregation, extraction, pre-processing) before yielding quantified results. It is important to recognize that this is not traditional data cleaning or editing. In some cases, data can be recorded directly from a device, which can in effect be treated as a black box. In other cases, there is a more complicated set of processes applied to the raw data obtained. As an example of such processing, we can consider a simple case: a subject has her blood pressure measured by a nurse with a pressure cuff, and the data – diastolic and systolic blood pressures – are manually recorded. If we want to consider a more complicated example, we can think of a participant being scanned with an MRI and simultaneously subjected to experimental stimuli (e.g., a series of clicks). The resultant scans (a series of images) are then processed (in a separate, proprietary tool) to identify differences between the subject‘s brain while being stimulated and while not. This yields a measure of blood flow through the brain – a
DOI: http://dx.doi.org/10.3886/DDILongitudinal01 - Page 2
Documenting a Wider Variety of Data Using the Data Documentation Initiative 3.1
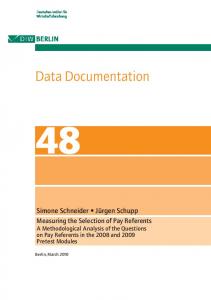
probability that a certain area of one‘s brain is activated by a specific stimulus. The MRI images are considered raw data in this example. There is a set of metadata to describe these differing scenarios, and it exists at different levels. There is information about the source itself, such as the description of the device generating the raw data or the register from which data are being sourced. Further, there is a description of the data collection process. There are metadata associated with the resultant data, both in their raw form and their processed form. It may be necessary to understand other aspects of the data collection, too – if staff are involved, it may be important to know how they have been trained to perform recording or processing of the raw data, and which tools and techniques they have used. In some cases a description of the experimental design is needed. In a more complicated case, consider the following description taken from the MIDUS II Neuroscience Project documentation for the EEG processing2 : EEG recording. EEG activity was recorded using a 128-channel geodesic net of Ag/AgCl electrodes encased in saline-dampened sponges (Electrical Geodesics, Inc [EGI], Eugene, OR). Electrode impedances were reduced to less than 100 KΩ, and analog EEG signals were amplified and sampled at a rate of 500 Hz (band-pass filtered from 0.1-100 Hz) with 16-bit precision using an online vertex (Cz) reference. Data cleaning. After 60 Hz notch filtering and 0.5 Hz high-pass filtering to remove slow frequency drift, bad channels were identified and removed. Bad sections of data were also removed. Using EEGLAB6, the EEG data was then submitted to a PCA/ICA forcing the identification of 20 components. Components containing obvious eye blinks, eye movements, and other artifacts were then removed from the data. Bad channels were then replaced using a spherical spline interpolation. Epochs of 2 second length were then created. The EEGLAB automated artifact identification routine was then run on these epoched data files, identifying epochs containing deviations of ±100 microvolts, which were then subsequently removed. In this EEG MIDUS II example, the processing continued with frequency analysis necessary to create a final set of EEG analysis variables. If we look at the metadata structures provided by DDI 3.1, there are reasonable places for documenting both simple and complex sources of data that do not conform to the traditional survey question and response. Complex cases will continue to be documented in domain-specific external constructs; DDI can point to and connect to these documents in a way that provides for versioning and maintainability. Because we are describing data collection, the DataCollection module is the natural place for this information. Within this module, there are three areas that are very useful: the CollectionEvent element, the Instrument element, and the ProcessingEvent element (see Figure 1 below).
2
Ryff, Carol D., and Richard Davidson. National Survey of Midlife Development in the United States (MIDUS II): Neuroscience Project [Computer file]. ICPSR28683-v1. Ann Arbor, MI: Inter-university Consortium for Political and Social Research [distributor], 2010-09-24. doi:10.3886/ICPSR28683. Readme file, pp. 6-7. http://www.icpsr.umich.edu/cgibin/file?comp=none&study=28683&ds=1&file_id=1026219.
DOI: http://dx.doi.org/10.3886/DDILongitudinal01 - Page 3
Documenting a Wider Variety of Data Using the Data Documentation Initiative 3.1
Instrument Data Collection Process CollectionEvent DataSource Origin
Raw Data Storage
OriginLocation
Pre-processing Stage One
Pre-processing 1 Results Data Storage
Instrument
Aggregate Variable ProcessingEvent Coding GenerationInstruction Aggregation VariableSet urn DependentVariableReference
Pre-processing Stage Two
Pre-processing 2 Results Data Storage
Aggregate Variable
Aggregate Variable
Figure 1: Mapping of non-survey data to DDI elements
In the CollectionEvent element, one can refer to the organization performing the data collection, describe its source, the date of the event, its frequency if repeated, the mode of the data collection, and the collection situation. In Instrument, it is possible to provide information about the name of the instrument, a description of it, a type designation (which can come from a controlled vocabulary), information about any software tool that constitutes the instrument, and a reference to an external location (a URL at which the instrument resides, if applicable). ProcessingEvent permits the inclusion of a Coding, which contains a GenerationInstruction element. This allows one to specify many useful pieces of information. One can reference external information about the processing (e.g., the document quoted above from MIDUS II), provide a textual description of the processing as part of the DDI file, include specific commands used in the data collection, and include a description of the aggregation or scoring rules. These last two elements are of special interest. Inside the Command element, there is the option to include a StructuredCommand. This element can be extended to attach non-DDI XML instances, such as those generated by many measurement devices. The Aggregation element allows us to specify which variables in the dataset
DOI: http://dx.doi.org/10.3886/DDILongitudinal01 - Page 4
Documenting a Wider Variety of Data Using the Data Documentation Initiative 3.1
have been populated by the process, establishing a crucial link with the processing of the data collected by the instrument during the collection event. The use of DDI 3.1 to document non-survey data sources is illustrated in the following set of examples.
Example 1: Register Data Example: Health Data in Denmark Use Case Administrative data can take many forms. Examples include social service applications such as requests for unemployment insurance, health records, and employment information gathered on the state of an economy. These data are increasingly valuable to researchers because they can be linked through the use of unique, individual identifiers in the dataset. Two prime examples are the use of a Central Person Registry (or CPR) in Denmark and a Social Security Number (SSN) in the United States. In Denmark, each citizen receives a unique CPR at birth. This number is used extensively by the government to administer programs such as the National Patient Registry (NPR) and the Criminal Registry -Kriminalregisteret. This former is administered by the National Board of Health -- Sundhedsstyrelsen (SST). In the United States, the SSN was originally intended to provide a unique number for purposes of administering a social insurance program designed to pay retired workers age 65 or older a continuing income after retirement. This number has now become widely used for administering other programs in many aspects of life in the United States, from loan applications to medical records to unemployment insurance. The number is so ubiquitous in life in the United States that all newborns are now assigned by law a federal SSN. Many countries, not only Denmark and the United States, have a similar way of assigning unique identifiers to their citizens for the purpose of administering government programs. All of these programs likely yield administrative data that, when combined with other sources of information on individuals, greatly enhance the research potential of the linked data. Returning to the Danish example, if a Danish citizen is hospitalized, this information is provided to the NPR, which records all health information related to a medical event. In a simplified case (which might not be technically accurate because the authors are not Danish social science researchers), a researcher could request the following information from the NPR cancer register:
Five-year cancer survival status (who lived/who died)
Postal addresses
CPRs
Socio-economic status (SES) at time of cancer diagnosis
A CPR number is represented as follows: 160267-xxxx, with digits 1-2 representing day of month of birth, digits 3-4 representing the month of birth, digits 5-6 representing the year of birth, digit 7 representing the century of birth, and digits 8-9 representing a random number. The 10th and final digit represents sex, and includes a control cipher. The 10th digit is in the form of an even or odd number, with males represented by uneven numbers and females by even numbers.
DOI: http://dx.doi.org/10.3886/DDILongitudinal01 - Page 5
Documenting a Wider Variety of Data Using the Data Documentation Initiative 3.1
Detail on SES in Denmark is available through Danmark Statistik. For further information on Health Registry Studies in Denmark, see The Danish Civil Registration System. The data provided by NPR for three individuals might look like this: CPR
5yr Survival
Postal address
Income
Home value
Taxes paid
160267-xxxx
Yes
11 Strasse
150,000
500,000
15,000
011249-xxxx
Yes
334 Forest Rd
34,000
0
890
050532-xxxx
No
11 Old Main Rd
55,000
40,000
1500
This information is enough to allow the researcher to follow up with five-year cancer survivors and conduct a survey to assess their socio-economic status five years prior to the onset of cancer. The survey data might look like this: CPR
Income 5 years earlier
160267-xxxx
90,000
011249-xxxx
200,000
050532-xxxx
80,000
Thus the researcher could create a longitudinal dataset and assess the possible impact of cancer on the socioeconomic status of five-year cancer survivors. DDI Markup Example As shown in the DDI markup example below, DataSource within CollectionEvent is used to document the source and date of the data: in this case, the National Patient Registry and October 21, 2010.
OrgScheme_1234 dk.dda 1.0.0 Sundhedsstyrelsen dk.dda 1.0.0 National Patient Registry Registry
DOI: http://dx.doi.org/10.3886/DDILongitudinal01 - Page 6
Documenting a Wider Variety of Data Using the Data Documentation Initiative 3.1
www.sst.dk 2010-21-10 .... The DDI documentation below uses DependentVariableReference within Aggregation and VariableSet to link the imported data to variables within the LogicalProduct.
This processing event describes data extracted from the National Patient Registry on 2010-21-10 EXTRACTION VarScheme_1234 dk.dda 1.0.0 CPR dk.dda 1.0.0 VarScheme_1234 dk.dda 1.0.0 5yr_Survival
DOI: http://dx.doi.org/10.3886/DDILongitudinal01 - Page 7
Documenting a Wider Variety of Data Using the Data Documentation Initiative 3.1
dk.dda 1.0.0 ....
Example 2: Biomarkers: MIDUS II – Blood Samples and Related Assays 3 Use Case As part of the biomarker project of the Midlife in the United States (MIDUS), a longitudinal study of aging in the U.S.4, a variety of biological data were collected on a subsample of respondents. The collecting and processing of tissue samples, particularly fasting blood draws, allowed for assessment of multiple indicators including cardiovascular, neuroendocrine, inflammatory, bone, and antioxidant. For illustrative purposes, this use case addresses how cholesterol measures (cholesterol, HDL cholesterol, and triglycerides) are obtained from cardiovascular indicators. Fasting blood samples were collected from each participant before breakfast on Day 2 of their hospital stays. To ensure consistency, all samples were collected and processed at the GCRC using standardized procedures5. Frozen samples were stored in a -60o C to -80o C freezer until shipped on dry ice to the MIDUS Biocore Lab. Samples were subsequently stored in a -65o C freezer until assayed. I. Blood Assays -- Frozen Serum in 1 mL aliquots is shipped to the MIDUS Biocore Lab monthly for the following biomarker assays:
Cardiovascular markers – Cholesterol Panel
Hormone markers - DHEA and DHEA-S
Inflammation markers - IL-6, s-IL6-r, C-Reactive Protein, Fibrinogen, E-Selectin, ICAM
Anti-oxidant markers - all trans-beta-carotene, 13-cis-beta-carotene, alphacarotene, betacryptoxanthin, lutein, zeaxanthin, lycopene, retinol, alphatocopherol, gamma-tocopherol
3
Ryff, Carol D., Teresa Seeman, and Maxine Weinstein. National Survey of Midlife Development in the United States (MIDUS II): Biomarker Project, 2004-2009 [Computer file]. ICPSR29282-v1. Ann Arbor, MI: Inter-university Consortium for Political and Social Research [distributor], 2010-09-24. doi:10.3886/ICPSR29282 4 MIDUS II Project pages, University of Wisconsin. http://www.midus.wisc.edu/midus2/ 5 Ryff, Carol D., Teresa Seeman, and Maxine Weinstein. National Survey of Midlife Development in the United States (MIDUS II): Biomarker Project, 2004-2009 [Computer file]. ICPSR29282-v1. Ann Arbor, MI: Inter-university Consortium for Political and Social Research [distributor], 2010-09-24. doi:10.3886/ICPSR29282. Blood, Urine, and Saliva Documentation. http://www.icpsr.umich.edu/cgi-bin/file?comp=none&study=29282&ds=1&file_id=1026195
DOI: http://dx.doi.org/10.3886/DDILongitudinal01 - Page 8
Documenting a Wider Variety of Data Using the Data Documentation Initiative 3.1
Bone Turnover markers – BSAP (Bone Specific Alkaline Phosphatase), NTx (nteleopeptide type 1 collagen), P1NP (aminoterminal propeptide type 1 procollagen)
Cholesterol Panel (Lipid assays): Cholesterol: The instrument uses the enzyme cholesterol esterase to cleave cholesterol esters into free cholesterol and fatty acids. Cholesterol oxidase then catalyzes the oxidation of cholesterol to cholest-4-en-3one and hydrogen peroxide. In the presence of peroxidase, this hydrogen peroxide effects the coupling of phenol and 4-aminoantipyrine to form a red quinone-imine dye. The color intensity of the dye is directly proportional to the cholesterol concentration. It is determined by measuring the increase in absorbance at 512 nm. HDL-cholesterol: Serum is first mixed with synthetic polyanions, which adsorb to the surfaces of the other lipoproteins (LDL, VLDL, and chylomicrons); they are thereby transformed into detergent-resistant forms, whereas HDL is not. After solubilizing the HDL with detergent, it is measured as described above for total cholesterol. The HDL assay was re-standardized by Roche Diagnostics on August 6, 2007. The results of assays done after that date are adjusted, as follows, to bring the new values in line with the existing data: Adjusted value = 1.1423(new value) - 0.9028 Triglycerides: Triglycerides are hydrolyzed by the enzyme lipoprotein lipase to glycerol and fatty acids. Glycerol is then phosphorylated to glycerol-3-phosphate by ATP in a reaction catalyzed by glycerol kinase. The oxidation of glycerol-3-phosphate is catalyzed by glycerol phosphate kinase to form dihydroxyacetone phosphate and hydrogen peroxide. In the presence of peroxidase, hydrogen peroxide effects the oxidative coupling of 4-chlorophenol and 4-aminophenazone to form a red-colored quinoneimine dye, which is measured at 512 nm. The increase in absorbance is directly proportional to the concentration of triglycerides in the sample. The resultant dataset (publicly available at ICPSR6) contains cardiovascular biomarker variables. Table 1 shows descriptive statistics of three variables (total cholesterol, HDL cholesterol, and triglycerides).
6
Ryff, Carol D., Teresa Seeman, and Maxine Weinstein. National Survey of Midlife Development in the United States (MIDUS II): Biomarker Project, 2004-2009 [Computer file]. ICPSR29282-v1. Ann Arbor, MI: Inter-university Consortium for Political and Social Research [distributor], 2010-09-24. doi:10.3886/ICPSR29282
DOI: http://dx.doi.org/10.3886/DDILongitudinal01 - Page 9
Documenting a Wider Variety of Data Using the Data Documentation Initiative 3.1
B4BCHOL Blood Total Cholesterol (mg/dL) N
B4BTRIGL B4BHDL Blood Blood HDL Triglycerides Cholesterol (mg/dL) (mg/dL)
Valid Missing
1244 1244 1242 11 11 13 Mean 186.59 132.52 55.37 Std. Deviation 40.170 131.819 17.982 Range 348 3274 102 Minimum 91 25 19 Maximum 439 3299 121 Table 1. Descriptive statistics of select MIDUS cardiovascular variables
DDI Markup Example The example below uses Instrument to document the blood draw and ExternalInstrumentLocation to document the clinical details of the blood draw. It also uses DependentVariableReference within Aggregation and VariableSet to link the imported data to variables within the LogicalProduct.
MIDUS II - Project 4 Tissue Collection and Processing Protocols Blood drawn for bio-marker assays. Tissue Sample http://www.icpsr.umich.edu/cgi-bin/file?comp=none&study=29282&ds=1&file_id=1026195 National Survey of Midlife Development in the US: Bio-Marker Project - Blood, Urine, and Saliva Data Documentation This processing event describes the fasting blood draw at clinical research centers at UW-Madison, Georgetown, and UCLA using the MIDUS II - Project 4 Tissue Collection and Processing Protocols.
DOI: http://dx.doi.org/10.3886/DDILongitudinal01 - Page 10
Documenting a Wider Variety of Data Using the Data Documentation Initiative 3.1
VarScheme_1234 us.uwm 1.0.0 B4BCHOL us.uwm 1.0.0 VarScheme_1234 us.uwm 1.0.0 B4BTRIGL us.uwm 1.0.0 VarScheme_1234 us.uwm 1.0.0 B4BHDL us.uwm 1.0.0 The example below uses DataCollectorOrganizationReference to document the places of blood collection: UW-Madison, Georgetown University, and UCLA. The dataset itself is located at ICPSR, as documented in OriginLocation.
DOI: http://dx.doi.org/10.3886/DDILongitudinal01 - Page 11
Documenting a Wider Variety of Data Using the Data Documentation Initiative 3.1
OrgScheme_1234 us.uwm 1.0.0 UW-Madison us.uwm 1.0.0 OrgScheme_1234 us.uwm 1.0.0 Georgetown-Univ us.uwm 1.0.0 OrgScheme_1234 us.uwm 1.0.0 UCLA us.uwm 1.0.0 Clinical research centers at UW-Madison, Georgetown, and UCLA. Fasting Blood Draws http://www.icpsr.umich.edu/cgibin/file?comp=none&study=29282&ds=1&file_id=1026195 2004-12-10 Nurse ....
DOI: http://dx.doi.org/10.3886/DDILongitudinal01 - Page 12
Documenting a Wider Variety of Data Using the Data Documentation Initiative 3.1
Example 3: Hardware Device Example: EEG Data from MIDUS 2 Neuroscience Project 7 Use Case As part of the neuroscience project of the Midlife in the United States (MIDUS), a longitudinal study of aging in the U.S. (http://www.midus.wisc.edu/midus2/), EEG data were collected on a subsample of respondents. Electroencephalography (EEG) is a procedure for the non-invasive measuring of electrical activity along the scalp produced by the firing of neurons within the brain. EEG is recorded from multiple electrodes placed on the scalp (see Image 1). Electrical activity along the scalp indicates activation in different areas of the brain. MIDUS created resting baseline EEG alpha asymmetry measures that indicated laterality in the following way: Log alpha power in the left hemisphere is subtracted from log alpha power in the right hemisphere (right – left) to create an index of laterality. Because greater alpha activity indicates less neural activation, larger laterality scores indicate greater LEFT HEMISPHERE activation.
Image 1. 128-channel geodesic electrode net
The resultant dataset (publicly available at ICPSR8) contains 33 variables indicating brain asymmetry -- e.g., variable name B5E1FP1LA; variable label FP1/FP2 Asymmetry in Alpha 1 using Standard Alpha Bands. 7
Ryff, Carol D., and Richard Davidson. National Survey of Midlife Development in the United States (MIDUS II): Neuroscience Project [Computer file]. ICPSR28683-v1. Ann Arbor, MI: Inter-university Consortium for Political and Social Research [distributor], 2010-09-24. doi:10.3886/ICPSR28683. Readme file, pp. 6-7. http://www.icpsr.umich.edu/cgibin/file?comp=none&study=28683&ds=1&file_id=1026219.
DOI: http://dx.doi.org/10.3886/DDILongitudinal01 - Page 13
Documenting a Wider Variety of Data Using the Data Documentation Initiative 3.1
Statistics B5E1FP1LA FP1/FP2 Asymmetry in Alpha 1 using Standard Alpha Bands N
Valid
319
Missing
12
Mean
-.00136
Std. Deviation
.098793
Range
.907
Minimum
-.291
Maximum
.616
Table 1: Descriptive statistics of MIDUS brain asymmetry measure DDI Markup Example The example below uses Instrument to document the procedure for obtaining the neurophysiological reading using ExternalInstrumentLocation to link to the documentation, held at ICPSR. It also uses DependentVariableReference within Aggregation and VariableSet to link to variables within the LogicalProduct.
MIDUS II - Project 5 EEG Data Collection Protocol Neurophysiological Reading http://www.icpsr.umich.edu/cgi-bin/file?comp=none&study=28683&ds=1&file_id=1026219 National Survey of Midlife Development in the US: Neuroscience Project - Readme This processing event describes the EEG Laboratory at University of Wisconsin Madison data collection, using the MIDUS II - Project 5 EEG Data Collection Protocol. 8
Ryff, Carol D., and Richard Davidson. National Survey of Midlife Development in the United States (MIDUS II): Neuroscience Project [Computer file]. ICPSR28683-v1. Ann Arbor, MI: Inter-university Consortium for Political and Social Research [distributor], 2010-09-24. doi:10.3886/ICPSR28683
DOI: http://dx.doi.org/10.3886/DDILongitudinal01 - Page 14
Documenting a Wider Variety of Data Using the Data Documentation Initiative 3.1
VarScheme_1234 us.uwm 1.0.0 B5E1FP1LA us.uwm 1.0.0 OrgScheme_1234 us.uwm 1.0.0 UW-Madison us.uwm 1.0.0 EEG Labaratory at University of Wisconsin - Madison EEG http://www.icpsr.umich.edu/cgibin/file?comp=none&study=28683&ds=1&file_id=1026219 2004-12-10 EEG geodesic 128-channel array ....
DOI: http://dx.doi.org/10.3886/DDILongitudinal01 - Page 15
Documenting a Wider Variety of Data Using the Data Documentation Initiative 3.1
Example 4: Documenting Low Pass Filter Processing Use Case Many instruments take signals as input and output waveform data for recording or visualization. The waveform data can be stored in numerous formats, many times as binary data with an XML header. This data can then be further processed by additional tools. An example of a simple tool is a low pass filter. The low pass filter removes components of the signal that have frequencies greater than a cutoff frequency. Once filtered, information has been lost and the original signal cannot be obtained from the filtered waveform.
Figure 2. Original vs. Filtered Signals The form of the filter can be a black box with a preset cutoff frequency, an adjustable cutoff frequency, or a software filter with numerous parameters. Documentation of the filter parameters may be sufficient, but in some instances it is necessary to retain the input waveform to allow a different filter to be substituted. The original raw data can be referenced, along with the raw data format. DDI Markup Example Raw data are referenced in the XML snippet below using DataSource within CollectionEvent.
OrgScheme_1234 bncdnet.ku.dda 1.0.0 Org1
DOI: http://dx.doi.org/10.3886/DDILongitudinal01 - Page 16
Documenting a Wider Variety of Data Using the Data Documentation Initiative 3.1
bncdnet.ku.dda 1.0.0 TDMS file containing 1 channel of raw waveform data TDMS https://www.bncdnet.ku.edu/repospub/ddi/examples/ExRawData.tdms 2004-12-10 OrgScheme_1234 bncdnet.ku.dda 1.0.0 Org1 bncdnet.ku.dda 1.0.0 TDMS file containing 1 channel of filtered waveform data TDMS https://www.bncdnet.ku.edu/repospub/ddi/examples/ExFilteredData.tdms 2004-12-10 FIR Low Pass Filter Configurable FIR filter for signal data Pre-process Module
DOI: http://dx.doi.org/10.3886/DDILongitudinal01 - Page 17
Documenting a Wider Variety of Data Using the Data Documentation Initiative 3.1
FIR_Filter.vi LabVIEW 1.0 FIR_Filter requiring LabVIEW 2010 graphical programming language development environment 2010-10-21 https://www.bncdnet.ku.edu/repospub/ddi/preprocessvis/FIR_Filter/FIR_Filter.vi https://www.bncdnet.ku.edu/repospub/ddi/examples/FIR_Filter_Parameters.xml EEG – Example application of low pass filter Each electrode produces a time varying electrical signal that is amplified, filtered, and digitized. The digitized signals are then displayed in real-time and recorded to disk. Further tools are required to preprocess the data prior to statistical analysis. In some cases summary data may be created, but in other cases it is necessary to retain the entire waveform. Consider the filter discussed earlier. A signal low pass filtered at 7 Hz cannot be used to analyze for information that is occurring 25 times per second. So in many cases it is important to retain the original waveform data and make it available for further pre-processing. EEG preprocessing typically links several tools together, and can produce waveform output or aggregated data.
Example 5: Scales: Functiona l Assessment in the Health and Retirement Survey (HRS) Use Case This example describes a collection instrument with items that are summed to produce a score. Frequently, traditional self-report questionnaires have included such scales as additional items; however, metadata attached to each item is unlikely to be able to capture metadata that pertains to the whole scale. For example, the HRS uses the Activities of Daily Living scale and the Center for Epidemiological Studies depression scale. Each has items with limited categorical responses (e.g., the ADL uses 0=performs independently, 1=performs with assistance, 3=cannot perform). If the relatively few items are marked up with DDI as independent survey items, important metadata associated with the item set may not be documented. This includes the scale name, origin/publisher, version, citation, scoring instructions, and score interpretation. Some of this information like score interpretation may be captured in the documentation of the variable for the derived score. In addition, the derived score may be summed by the field interviewer and tallied on the form, with only the total entered into the dataset. Or, by contrast, only the item responses may be obtained in
DOI: http://dx.doi.org/10.3886/DDILongitudinal01 - Page 18
Documenting a Wider Variety of Data Using the Data Documentation Initiative 3.1
the interview/survey, and code (e.g., SPSS syntax) is subsequently used to compute the score. When it exists, this code may be useful metadata to capture. Below are metadata related to the ADL and CESD-10: Activities of Daily Living Scale (Also known as ―Activities of Daily Living Scale‖, ―Katz ADL Scale,‖ or ―ADL Scale‖)9 1. Survey 1. Based on six criteria 1. Bathing with sponge, bath, or shower 2. Dressing 3. Toilet use 4. Transferring (in and out of bed or chair) 5. Urine and bowel continence 6. Eating 2. Each criterion is graded on level of dependence 1. Performs independently 2. Performs with assistance 3. Unable to perform (assigned 1 point each) 2. Interpretation 1. Level of ADL Dependence graded via score 2. Independence in ADLs suggested by score of 0 to 1 3. Dependence in ADLs increases as score approaches 6 Center for Epidemiological Studies Depression Scale (CES-D)10
A screening measure (NOT a diagnostic tool) developed to identify current depressive symptomatology related to major or clinical depression in adults and adolescents.
Items include depressed mood; feelings of guilt, worthlessness and helplessness; psychomotor retardation; loss of appetite; and sleep difficulties. Number of items: There are 10- and 20-item versions of the scale. Procedure/Administration: Self-report using pen/paper or interview. Responses are based on the frequency of occurrence during the past week. Uses a 4-point ordinal scale: Rarely or none of the time (less than 1 day); Some or a little of the time (1-2 days); Occasionally or a moderate amount of the time (3-4 days); Most or all of the time (5-7 days). How scored: A summary score is calculated. The range of scores on the CES-D-20 is 0-60 (0-30 for the CESD-10). Interpretability: A CES-D -20 cutoff score of 16 is indicative of ―significant‖ or ―mild‖ depressive symptomatology, and a cut score of 11 for the shorter version is recommended. It is equivalent to
9
Katz, S., et al. Studies of Illness in the Aged. The Index of ADL: A Standardized Measure of Biological and Psychosocial Function. JAMA. 1963 Sep 21;185:914-9. 10 Radloff, L. S. (1977). The CES-D Scale: A Self-Report Depression Scale for Research in the General Population. [Peer Reviewed]. Applied Psychological Measurement, 1(3), 385-401.
DOI: http://dx.doi.org/10.3886/DDILongitudinal01 - Page 19
Documenting a Wider Variety of Data Using the Data Documentation Initiative 3.1
experiencing six symptoms for most of the previous week or a majority of symptoms on one or two days. Higher scores indicate greater symptoms. DDI Markup Example
The Center for Epidemiologic Studies Depression Scale Radloff Center for Epidemiologic Studies 1977 Center for Epidemiologic Studies This is a self-report. The score is the sum of the 20 questions. Possible range is 060. If more than 4 questions are missing answers, do not score the CES-D questionnaire. A score of 16 points or more is considered depressed. Questions 4, 8, 12, and 16 are positive statements, and require reverse scoring to indicate depression. The respondents are instructed to answer about themselves during the past week, and are reminded that there are no right or wrong answers. clonevar cesd_04r = cesd_04 clonevar cesd_08r = cesd_08 clonevar cesd_12r = cesd_12 clonevar cesd_16r = cesd_16 recode cesd_04r cesd_08r cesd_12r cesd_16r (3=0) (2=1) (1=2) (0=3) egen cesd_totalScore = rowtotal( cesd_01 cesd_02 cesd_03 cesd_04r cesd_05 cesd_06 /// cesd_07 cesd_08r cesd_09 cesd_10 cesd_11 cesd_12r /// cesd_13 cesd_14 cesd_15 cesd_16r cesd_17 cesd_18 /// cesd_19 cesd_20) egen _temp_cesd = rowmiss( cesd_01 cesd_02 cesd_03 cesd_04r cesd_05 cesd_06 cesd_07 cesd_08r cesd_09 cesd_10 cesd_11 cesd_12r cesd_13 cesd_14 /// cesd_15 cesd_16r cesd_17 cesd_18 cesd_19 cesd_20) replace cesd_totalScore = . if _temp_cesd > 4 drop _temp_cesd SUMMATION VarScheme_1234
DOI: http://dx.doi.org/10.3886/DDILongitudinal01 - Page 20
Documenting a Wider Variety of Data Using the Data Documentation Initiative 3.1
us.isr 1.0.0 CESD_Total_Score us.isr 1.0.0 VarScheme_1234 us.isr 1.0.0 CESD_01 us.isr 1.0.0 VarScheme_1234 us.isr 1.0.0 CESD_02 us.isr 1.0.0 VarScheme_1234 us.isr 1.0.0 CESD_03
DOI: http://dx.doi.org/10.3886/DDILongitudinal01 - Page 21
Documenting a Wider Variety of Data Using the Data Documentation Initiative 3.1
us.isr 1.0.0 The Center for Epidemiologic Studies Depression Scale
Example 6: Audio Stimulus and Recorded Audio Response: CTOPP Nonword in the Language Acquisition Study Use Case Scales may not have items (e.g., in the next two minutes, name as many words beginning with ‗gr‘ as you can recall), but even when they do, the responses may be captured data as opposed to endorsed categories. For example, the nonword repetition subtask of the Comprehensive Test of Phonological Processing (CTOPP; Wagner, Torgensen & Rashotte, 1999) might be included in a protocol to assess phonological short-term memory. The authors created the orthographically legitimate, or plausible English language, items such as ―nirp‖ by randomly combining phonemes to fill slots in syllables, discarding non-pronounceable ones. This was done to avoid the possible confound of using analogies to real words, once again avoiding the use of cognitive-linguistic processes other than phonological memory. Similar to most CTOPP subtests, Nonword Repetition requires the use of an audiocassette recorder to ensure standardized administration, particularly as the items become more difficult. A separate recording is required of the spoken response, and this recording must be subsequently scored by trained personnel to tally the number of phonemes correctly reproduced. This is repeated for a number of nonwords, and overall total scores for correct phonemes and correct consonant phonemes are generally produced. Appropriate documentation would include the metadata about the scale, and pointers to the raw audio recording(s), the training of the person(s) scoring (including any double scoring procedures for reliability), and the aggregation (possibly a code snippet) used to produce the summary scores.
Example 7: Embedded Software Device: E-Prime in WLS Use Case Scales or other assessments may be in software and/or hardware that is embedded in the survey protocol. The Wisconsin Longitudinal Study‘s (WLS) 2010 collection wave added additional cognitive assessments programmed in E-Prime (Psychology Software Tools, Pittsburgh, PA), a Computer Assisted Self Interview (CASI) sequence within the overall Computer Assisted Paper Interview (CAPI) survey. (Underscoring the growing use of these types of assessments, the E-Prime implementation of the cogitative battery that WLS deployed was originally developed for and provided by the Health and Retirement Study, which was also preparing to deploy them.) E-Prime software is launched from CASES, after which the respondent takes over the keyboard, following online instructions and answering questions by making choices (pressing this or that key). CASES passes a respondent ID number to E-Prime, and data are saved with this ID number. These
DOI: http://dx.doi.org/10.3886/DDILongitudinal01 - Page 22
Documenting a Wider Variety of Data Using the Data Documentation Initiative 3.1
segments are in some sense a black box. Responses and scores (e.g., percent correct, reaction time) are stored in some proprietary fashion and later merged with other responses from the protocol during the initial data entry process. Final scores (e.g., the sum of correct responses) are then produced. Important metadata would obtain at the E-Prime level, as well as the level of each cognitive test implemented. At the E-Prime level the publisher, the version, and data storage aspects used might be documented. At the level of each cognitive test administered, documentation might include the name of the test if a standard test, or the construct being assessed. Information would also include the number/type of stimuli and the mode of response, scoring procedures, and details of score interpretation, as well as information attendant to the output data stream (i.e., format, procedures) that needs to be merged with the larger survey responses. The 2010 WLS wave used E-Prime modules to assess processing speed, executive function/working memory, language and semantic abilities, and general cognitive functioning. There were six E-Prime modules. They are all administered together. If the respondent refused the recording needed for the first three, then only the last three are administered.
Reading regular and irregular words and nonwords Picture naming Category verification Number judgment and reversed judgment Digit reading Word recognition
For simplicity we limit this use case to just two assessments, Number Judgment and Reversed Judgment, respectively assessing processing speed and executive function. Processing Speed, Number Judgment: Participants will see a number between 1 and 9, excluding 5, and will press a key indicating whether the number is above or below 5. The ―lower than 5‖ key will be pressed with the left hand and the ―higher‖ key with the right, consistent with the left to right order of digits on keyboards. Participants will receive 16 practice and 80 experimental trials. The dependent measures are accuracy and reaction time. >y_epr4a< [Instructions read by interviewer:] This next task is designed to measure your speed in responding to things you see. First, place your left index finger on the ―left‖ button and your right index finger on the ―right‖ button. You will see the numbers 1 through 9 on the computer screen. Every time you see a number, you should push the LEFT button if it is SMALLER than 5 and the RIGHT button if it is LARGER than 5. The number 5 will not appear on the screen. Use both hands for this task. First you will see a + in the center of the screen. Focus on the + and then wait for a number to appear. When the number appears, push the LEFT button if it is SMALLER than five and the RIGHT button if it is LARGER than 5. Do you have any questions? Press the ―left‖ button to begin with three practice trials. Executive function: Immediately following the number judgment task, we repeat the task, but with the assignment of responses to keys switched so that the right key now indicates ―lower than 5‖ and the left key indicates ―higher than 5‖.
DOI: http://dx.doi.org/10.3886/DDILongitudinal01 - Page 23
Documenting a Wider Variety of Data Using the Data Documentation Initiative 3.1
The degree of interference—calculated as the difference in response time between the original and the switch conditions, divided by the original mean response time—provides an estimate of the ability to inhibit a prepotent response. >y_epr4b< [The screen reads:] Now we‘re going to do something a little bit different. Please listen to the interviewer‘s instructions before beginning. Press a button to start with some practice trials when you are ready to begin. [Instructions read by interviewer:] This next task is just like the previous task, but has slightly different rules. This time, you‘re going to reverse the keys. Now if the number is SMALLER than 5, you should push the RIGHT button, and if the number is LARGER than 5, you should push the LEFT button. In other words, we are switching the meaning of the two keys, but everything else will remain exactly the same. Remember, it‘s now LEFT button for larger than 5, RIGHT button for smaller than 5. Do you have any questions? Press the ―left‖ button to begin with three practice trials.
RECOMMENDATIONS Recommendation 1: Data and metadata should be exported to standard and open formats whenever possible. Sometimes raw data and corresponding metadata need to be referenced to enable preprocessing to be repeated, possibly with different tools or with different parameters. In many cases raw data are stored in very specific formats, which can be proprietary, open, standard, or custom. When feasible, consideration should be given to exporting data and metadata to standard open formats. By doing this a larger number of tools can be used to pre-process the data without requiring a possibly proprietary converter. However, in other cases to prevent loss of data or metadata it may be best to link to the original raw data source.
Recommendation 2: Think of “instrument,” “data processing,” and “aggregation” as terminology that can be useful beyond traditional survey data for recording metadata about new data types. These terms can be applied to all of the examples in this paper and illustrate the flexibility of the DDI approach. GenerationInstruction should be able to point to an ―instrument‖ (―instrument‖ used in a very broad sense). Use Aggregation to assign a type to the scoring process and point to the input object with @ objectSource and reference the output variable (holding the score) using dependent variable.
Recommendation 3: Add machine -actionability to supplement humanreadable documentation. Several practices described in this paper rely on human-readable text embedded in various DDI tags, or exploit fields that can point to external documents. Examples include the MIDUS blood-draw document linked in using ExternalInstrumentLocation in Example #2, or the information about the CES-D depression scale contained in the human- readable text in the Description used in Example #5. While recording (or pointing to) this information largely addresses documentation needs, some relationships may not be preserved in ways that DDI toolmakers might require.
DOI: http://dx.doi.org/10.3886/DDILongitudinal01 - Page 24
Documenting a Wider Variety of Data Using the Data Documentation Initiative 3.1
Multiple instruments in a data collection event might have hierarchical (or other dependent) relationships. For example, the virtual instrumentation LowPassFilt1 documented in Example #4 has a sequential relationship with the EEG Data Collection Protocol in Example #3. The filter provides post- processing of the signals obtained from the hardware data collection event in the latter. It should be possible to indicate this relationship in a machine-actionable way. This would allow one to output all hardware data collections that use a particular virtual filter instrument in post-processing. Another example would be a codebook ordered by psychometric scale – even when the scale items were interlaced with other scales and ordered differently in the questionnaire. As the team worked on this project, two improvements to the standard were identified, mostly to handle the linkages not present in the existing schema. (1) Add an optional reference to CollectionEvent, pointing to an Instrument (possibly more than one with relationships between them specified) (2) Add a connection between CollectionEvent and GenerationInstructions (another reference) These linkages are currently possible only using human-readable text, and consequently limit what toolmakers can provide to end users.
DOI: http://dx.doi.org/10.3886/DDILongitudinal01 - Page 25
Documenting a Wider Variety of Data Using the Data Documentation Initiative 3.1
APPENDIX A GLOSSARY
Administrative data
Data collected for the administration of government (or other) programs. Examples include: o Economic data o Educational achievement in public schools o Hospital admissions/discharges/outcomes o Income/sales/property tax records (both personal and business) o Immigration applications/approvals/naturalization records o Social Security records o Unemployment Insurance claims/records o Voting records o Workers compensation (for on-the-job injuries)
Biomarker
The official NIH definition of a biomarker is: ―a characteristic that is objectively measured and evaluated as an indicator of normal biologic processes, pathogenic processes, or pharmacologic responses to a therapeutic intervention.‖ Ref: Biomarkers Definitions Working Group: ―Biomarkers and Surrogate Endpoints: Preferred Definitions and Conceptual Framework.‖ CLIN PHARMACOL THER 2001;69:89-95. http://www.everythingbio.com/glos/definition.php?ID=3716
Cohort/Event-based
Data collected over time about a group of individuals that are connected in some way or have shared some significant experience within a given period. Examples: birth, disease, education, employment, family formation, participation in an event.
Concordance
Tool or table indicating the presence of the same variable or question over waves of a study.
Continuous panel
Reports from a panel collected on a regular basis.
Continuous time series
Phenomena measured at every instant of time. Examples: lie detectors, electrocardiograms, etc.
Cross-sectional
Data about a population obtained only once.
Cross-sectional ad-hoc followup Data collected at one point in time to complete information collected in a previous cross-sectional study; the decision to collect follow-up data is not included in the study design.
DOI: http://dx.doi.org/10.3886/DDILongitudinal01 - Page 26
Documenting a Wider Variety of Data Using the Data Documentation Initiative 3.1
Data harmonization
Data harmonization is the process of bringing variable-level information into alignment to express comparability. This is often done through mapping across various elements of the variables, including variable name, label, categories, codes, etc.
Data life cycle
The whole course of existence of a set of data, from initial conception to ultimate disposal.
DDI
The Data Documentation Initiative (http://www.ddialliance.org/). Also that organization‘s metadata specification for the social and behavioral sciences.
Digital Object Identifier (DOI) A character string used to uniquely identify an electronic document or other object. Metadata about the object is stored in association with the DOI name and this metadata may include a location, such as a URL, where the object can be found. The DOI for a document or dataset is permanent, whereas its location and other metadata may change. Referring to an online document by its DOI provides more stable linking than simply referring to it by its URL, because if its URL changes, the publisher need only update the metadata for the DOI to link to the new URL.
Discrete time series
Measurements taken at (usually regularly) spaced intervals.
DSS / HDSS
Health and Demographic Surveillance Systems (HDSS) for longitudinal monitoring of small-area populations by continuous recording of vital events have been set up in many developing countries. HDSS's are based on a data gathering method comprising an initial census of the resident population, followed by multi-round surveys covering all inhabitants of the area. They thus, provide a geographical and temporal observation window on a locally circumscribed population defined using certain rules of residence. Individuals' life events during their period(s) of residence in the survey area are recorded on an individual basis (the minimum data being births, deaths and migration), but sometimes per household or per residential unit. Examples: macroeconomics (weekly share prices, monthly profits, sales); meteorology (daily rainfall, hourly temperature); measurements of individuals (blood pressure, weight, height); sociology (crime figures, employment figures), etc.
Grouping
A DDI mechanism to clearly document the repurposing of aspects of the initial study and the relationships that exists between each of the component studies in the group. The typical use case involves a series or collection of studies which are related in some way or a group of studies which are being compared. A Group can be comprised of StudyUnits and SubGroups. A standard set of attributes describes the
DOI: http://dx.doi.org/10.3886/DDILongitudinal01 - Page 27
Documenting a Wider Variety of Data Using the Data Documentation Initiative 3.1
following dimensions for grouping: Time, Instrument, Panel, Geography, Datasets, Language.
Instrument
A specific instrument or tool used to collect data. For survey data, the instrument has traditionally been seen as a questionnaire, but devices used to collect biomedical information, e.g., fMRI scanning devices, can also be viewed as instruments.
Interval panel
Measurements taken only when information is needed.
Longitudinal
Data collected repeatedly over time to study change in a population.
Panel
Data collected over time from, or about, the same sample of respondents.
Published
The DDI attribute isPublished is set to true when the metadata are made available outside of the group of original developers. Published metadata must be versioned.
Register data
Data collected and maintained on individuals and businesses to track vital statistics and other information.
Resource package
A means of packaging any maintainable set of DDI metadata for referencing as part of a study unit or group. A resource package structures materials for publication that are intended to be reused by multiple studies, projects, or communities of users. A resource package uses the group module with an alternative top-level element called Resource Package that is used to describe maintainable modules or schemes that may be used by multiple study units outside of a group.
Retrospective study
A study in which data are collected from recollections of past events.
Surveillance study
A study in which data are collected by systematic observation.
Time series
Data collected repeatedly over time to study change in observations. These are typically ―objective‖ measurements of phenomena that can be observed externally, as opposed to attitudes/opinions or feelings. Examples may include economic/financial indicators, natural/meteorological phenomena, vital statistics, etc.
Trend/Repeated cross-section The study of different samples/different groups of people from the same population at several points in time, using the same set of questions/variables. Conclusions are drawn for the population. Examples: public opinion polls, elections studies, etc.
Trials / Interventions
A study involving some sort of experimental action usually in comparison to some control condition.
DOI: http://dx.doi.org/10.3886/DDILongitudinal01 - Page 28
Documenting a Wider Variety of Data Using the Data Documentation Initiative 3.1
Versioned
Metadata for which any changes will require an update of the version attribute of the metadata.
Wave
One of a sequence of repeated stages of a study.
DOI: http://dx.doi.org/10.3886/DDILongitudinal01 - Page 29
Documenting a Wider Variety of Data Using the Data Documentation Initiative 3.1
APPENDIX B ACKNOWLEDGMENTS The paper is one of several papers that are the outcome of a workshop held at Schloss Dagstuhl - Leibniz Center for Informatics in Wadern, Germany, on October 18-22, 2010. The series was edited by Stefan Kramer, Larry Hoyle, and Mary Vardigan. Workshop Title: The Data Documentation Initiative (DDI) Standard : Managing Metadata for Longitudinal Data — Best Practices Link: http://www.dagstuhl.de/10422 Organizers: Arofan Gregory (Open Data Foundation, Tucson, Arizona, USA) Mary Vardigan (Inter-university Consortium for Political and Social Research [ICPSR], University of Michigan, USA) Joachim Wackerow (GESIS, Leibniz Institute for the Social Sciences, Germany) Participants in the workshop:
Christian Bilde Andersen, Danish Data Archive (DDA) Randy Banks, Institute for Social and Economic Research (ISER), University of Essex Bill Block, Cornell Institute for Social and Economic Research (CISER), Cornell University Daniel Bontempo, Life Span Institute, University of Kansas Fortunato Castillo, MRC Centre of Epidemiology for Child Health, Institute of Child Health, University College London Vicky (Huey-Chi) Chang, Wisconsin Longitudinal Study, University of Wisconsin-Madison Benjamin Clark, London School of Hygiene and Tropical Medicine, Tazama Project, Tanzania Sue Ellen Hansen, Institute for Social Research, Survey Research Operations, University of Michigan Stan Howald, Wisconsin Longitudinal Study, University of Wisconsin-Madison Larry Hoyle, Institute for Policy and Social Research, University of Kansas Jeremy Iverson, Algenta Technologies Uwe Jensen, GESIS - Leibniz Institute for the Social Sciences Douglas Kieweg, Center for Biobehavioral Neurosciences in Communication Disorders (BNCD), University of Kansas Neeraj Kumar Kashyap, Vadu Rural Health Program, KEM Hospital Research Centre, INDEPTH Network Stefan Kramer, Cornell Institute for Social and Economic Research (CISER), Cornell University Hilde Orten, Norwegian Social Science Data Archive (NSD) Denise Perpich, Language Acquisition Studies Lab, University of Kansas Barry Radler, Institute on Aging, University of Wisconsin-Madison Ingo Sieber, German Institute for Economic Research (DIW) Berlin, Socio-Economic Panel Study (SOEP) Johanna Vompras, University Bielefeld Library, Germany Knut Wenzig, National Educational Panel Study (NEPS), University of Bamberg Wolfgang Zenk-Möltgen, GESIS - Leibniz Institute for the Social Sciences
DOI: http://dx.doi.org/10.3886/DDILongitudinal01 - Page 30
Documenting a Wider Variety of Data Using the Data Documentation Initiative 3.1
APPENDIX C Copyright © DDI Alliance 2011, All Rights Reserved http://www.ddialliance.org/ Content of this document is licensed under a Creative Commons License: Attribution-Noncommercial-Share Alike 3.0 United States This is a human-readable summary of the Legal Code (the full license). http://creativecommons.org/licenses/by-nc-sa/3.0/us/ You are free:
to Share - to copy, distribute, display, and perform the work to Remix - to make derivative works
Under the following conditions:
Attribution. You must attribute the work in the manner specified by the author or licensor (but not in any way that suggests that they endorse you or your use of the work). Noncommercial. You may not use this work for commercial purposes. Share Alike. If you alter, transform, or build upon this work, you may distribute the resulting work only under the same or similar license to this one. For any reuse or distribution, you must make clear to others the license terms of this work. The best way to do this is with a link to this Web page. Any of the above conditions can be waived if you get permission from the copyright holder. Apart from the remix rights granted under this license, nothing in this license impairs or restricts the author‘s moral rights.
Disclaimer The Commons Deed is not a license. It is simply a handy reference for understanding the Legal Code (the full license) — it is a human-readable expression of some of its key terms. Think of it as the user-friendly interface to the Legal Code beneath. This Deed itself has no legal value, and its contents do not appear in the actual license. Creative Commons is not a law firm and does not provide legal services. Distributing of, displaying of, or linking to this Commons Deed does not create an attorney-client relationship. Your fair use and other rights are in no way affected by the above. Legal Code: http://creativecommons.org/licenses/by-nc-sa/3.0/us/legalcode
DOI: http://dx.doi.org/10.3886/DDILongitudinal01 - Page 31