vol. 153, no. 4
the american naturalist
april 1999
Does Body Size Optimization Result in Skewed Body Size Distribution on a Logarithmic Scale?
Pavel Kindlmann,1,* Anthony F. G. Dixon,2,† and Iva Dosta´lkova´1
1. Faculty of Biological Sciences, University of South Bohemia, Czech Academy of Sciences, Branisˇovska´ 31, CS37005 Cˇeske´ Budeˇjovice, Czech Republic; 2. School of Biological Sciences, University of East Anglia, Norwich, NR4 7TJ, United Kingdom Submitted March 2, 1998; Accepted October 31, 1998
Keywords: body size, distribution, model, taxon.
Kozlowski and Weiner (1997) challenged the idea that interspecific allometries reflect unitary functional relationships between parameters that are shared by all of the species within a set. They suggested that these allometries might also be produced as a by-product of underlying intraspecific processes. In the course of their argument, Kozlowski and Weiner developed a model for the optimal adult body size and found a striking result, which is that optimizing body size produces a distribution of sizes within a taxon that is skewed to the right, even when examined on a logarithmic scale. In this note, we point out that while this result was based on a limited range of parameters, it is actually a very general outcome of optimizing body size in their model. Kozlowski and Weiner’s (1997) new model is based on the assumptions that assimilation and respiration are allometric functions of body size, aw b and hw b, respectively; that the production rate, P(w), is the difference between assimilation and respiration, that is, P(w) 5 aw b 2 hw b; that the mortality rate, m(w), can be described by m(wx) 5 2gw l; and that the optimal adult body size can be found as a solution of dP(w) dE(w) E(w) 1 P(w) 5 1, dw dw
(1)
* To whom correspondence should be addressed; e-mail:
[email protected]. †
E-mail:
[email protected].
Am. Nat. 1999. Vol. 153, pp. 445–447. q 1999 by The University of Chicago. 0003-0147/99/5304-0010$03.00. All rights reserved.
where E(w) is the reciprocal of the mortality rate, m(w). They selected 100 values for the parameters a, b, h, b, g, and l at random from a normal distribution, with a fixed mean and coefficient of variation (CV), and solved equation (1) to obtain the optimum body size. The resulting body size distribution of species within a taxon was skewed to the right even when body size was logarithmically transformed (Kozlowski and Weiner 1997). Because they were not trying to explain the distribution of body sizes, they used only one set of arbitrarily chosen mean parameter values (table 1), and they did not try to mimic those suggestive of any specific taxonomic group. How robust is their result? To test for this, we repeated Kozlowski and Weiner’s (1997) simulations for a broad range of means of their parameters (table 1). For any fixed mean and CV we chose parameters independently from normal distributions. In some cases, this procedure generates parameter values that prevent equation (1) from being solved, for example, b 1 b . We have overcome this problem in two ways: we have forced the model to yield exactly 100 optimal sizes by using more than 100 random choices—results referred to as A—and we have omitted any parameter combination in which the condition 1 1 b 1 b 1 l 1 .5
(2)
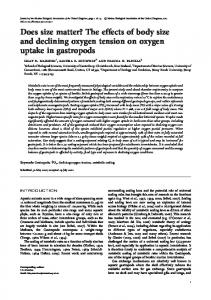
was not satisfied (results B). It can be easily shown analytically that equation (2) is sufficient for a unique solution of equation (1). As it is usually assumed (Schmidt-Nielsen 1984) that b is close to .75 and b is close to .67, and as the exponent for mortality is much lower than those for assimilation and respiration, this seems to be a reasonable restriction of the model. The simulation results (fig. 1) clearly indicate that most of the distributions are positively skewed, which is consistent with Kozlowski and Weiner’s (1997) results. However, there are cases in which the skewness is close to zero or even negative. Out of 1,080 cases, 1,001 of the cases produced a statistically significantly positive skewness in set A and 880 in B. None of the cases in set A were statistically significantly negatively skewed, while three were negatively skewed in set B. The tendency for fewer
446 The American Naturalist Table 1: Parameter values used in Kozlowski and Weiner’s (1997) paper and in this study Kozlowski and Weiner
This study
Coefficient of variation Parameters a b h b g l
Mean
Mean
Case 1
Case 2
Case 3
Lowest
Largest
Step
Coefficient of variation
.050 .670 .015 .750 .0015 2.100
20 5 20 5 50 10
10 2.5 10 2.5 50 10
20 5 20 5 20 2.5
.05 .67 .015 .75 .0015 2.100001
2.05 .67 1.015 .75 .0815 2.000001
.4 ) .2 ) .02 .02
20 5 20 5 50 10
Fig. 1: Distribution of skewnesses obtained in this study. A 5 model forced to yield exactly 100 optimal sizes. B used only parameters satisfying condition (2).
of the distributions to be positively skewed in B is because condition (2) does not allow the model to produce extremely large (and biologically probably not realistic) optimum body sizes. Thus, the distribution of body sizes published by Kozlowski and Weiner (1997) is a typical, but not a general, one for their model. The distribution of body sizes within a taxon is often (May 1978; Blackburn and Gaston 1994; Purvis and Harvey 1997), but not always (Dixon et al. 1995; Novotny´ and Kindlmann 1996), skewed to the right when body size is logarithmically transformed. Our results support the possibility that Kozlowski and Weiner’s (1997) model can be applied to the real world. Here we focused only on a sensitivity analysis of four out of the six life-history parameters in the Kozlowski and Weiner’s (1997) model and used the same values as Kozlowski and Weiner (1997) did for b and b; testing all of them would require an unrealistic number of simulations. In the future it would be inter-
esting to test the influence of the remaining two parameters and also the effect of nonnormal distributions. An alternative hypothesis for these types of size-diversity curves associates theory with some size-related feature of its food (Dixon et al. 1995). If the latter is true, then the body size distribution of such taxa should strongly depend on that of the organisms on which they feed. The same will be predicted by Kozlowski and Weiner’s (1997) model, if the assimilation and respiratory rates of the predator are dependent on the size of the prey.
Literature Cited Blackburn, T. M., and K. J. Gaston. 1994. The distribution of body sizes of the world’s bird species. Oikos 70: 127–130. Dixon A. F. G., P. Kindlmann, and V. Jarosˇı´k. 1995. Body
Notes and Comments 447 size distribution in aphids: apparency of specific plant structures. Ecological Entomology 20:111–117. Kozlowski, J., and J. Weiner. 1997. Interspecific allometries are by-products of body size optimization. American Naturalist 149:352–380. May, R. M. 1978. The dynamics and diversity of insect faunas. Pages 188–204 in L. A. Mound and N. Waloff, eds. Diversity of insect faunas. Blackwell, Oxford.
Novotny´, V., and P. Kindlmann. 1996. Distribution of body sizes in arthropod taxa and communities. Oikos 75: 75–82. Purvis, A., and P. H. Harvey. 1997. The right size for a mammal. Nature (London) 386:332–333. Schmidt-Nielsen, K. 1984. Scaling: why is animal size so important? Cambridge University Press, Cambridge. Associate Editor: Mark Pagel