Oct 22, 2007 - Allen, Mahalley D., Pettus, Carrie, & Haider, Donald P. (2004). Making the national local: .... Miller, C. Chet & Cardinal, Lara B. (1994). Strategic ...
Does Management Matter? Testing Models of Government Performance
by Alexander C. Heckman The Ohio State University John Glenn School of Public Affairs Columbus, Ohio 43210 and Capital University Department of Political Science Columbus, Ohio 43209
Paper prepared for the 9th Bi-Annual Public Management Research Association Conference, October 2007 Tucson, Arizona Please do not cite without author’s permission.
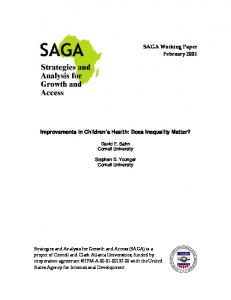
Understanding the Role Public Management in Government Performance The ultimate goal of public management research is to improve government performance. While theories of management and government performance abound, there is insufficient empirical testing of theory. As a result, it is difficult to accumulate generalizable knowledge that can be translated into to evidence-based advice for policymakers and management practitioners regarding how to improve performance (Boyne, Meier, O’Toole, & Walker, 2005). Additionally, many public administration and political science scholars have not accounted for management when studying performance, even though empirical studies consistently find that some aspect of management quality or particular management activities positively impact agency or program performance (Boyne, 2003). Research on public performance has emphasized the external environment of the agency (Boyne & Walker, 2005) This analysis represents a first step in theory testing to understand the general factors that determine government performance, with an emphasis on the role of management. In this paper, I assess the empirical basis for, and relative explanatory power, of two models that offer explanations of government performance and incorporate management in their explanations. Using basic statistical techniques and comparative state environmental data on agency inspections and emissions, I empirically test the Ingraham and Donahue government performance model (GPM) and the Mazmanian-Sabatier Implementation Success Model (ISM) using comparative data on state environmental agencies’ outputs and outcomes. The study also uses state management grades from the Government Performance Project (GPP) as a direct, holistic measure of management quality. The findings suggest that the more comprehensive implementation model provides a better explanation of government performance and the relative importance of management quality, policy, and other factors for determining performance. The analysis also indicates that management quality, as measured by the GPP, can have a significant impact on agency emissions under certain circumstances. Although, the relationship between management and emissions is inconsistent. Neither model was useful for explaining inspections. However, the results also suggest that additional analysis using more sophisticated methods is warranted for both measures of government performance. The paper proceeds in the following fashion. The first model to be tested, the Government Performance Model, is presented and its role in the literature is discussed. Next, management quality grades that are based upon the GPM and used in this analysis are explained. Then, the implementation model to be tested is discussed. Finally, the research design, hypotheses, and analysis are presented. The Government Performance Model The public management model to be tested in this analysis is the government performance model (GPM) set forth originally by Ingraham & Kneedler (2000a). The GPM is a prominent model in the public management literature and represents a synthesis of the insights from prior research. Figure 1 illustrates the original version of the GPM posited by Ingraham and Kneedler (2000a). [Insert Figure 1 here]
1
Figure 1 shows of an open systems model relationship in which only management and environmental factors directly determine government performance. According to the GPM, management is the “ability to marshal, develop, direct and control…financial, human, physical, and information resources” and effective management is about leaders coordinating, monitoring, and modifying key organizational systems to ensure “the right resources are in the right place at the right time” (Ingraham et al., 2003).The quality of management is determined by politics, policy direction, and resources, but only management directly impacts performance in the original conception of the GPM. Management is the process inside the “black box” that is directly responsible for producing outputs and achieving policy goals (Ingraham & Kneedler 2000a). According to the GPM, there are three management levers or dimensions that define management, including: 1. Management Systems: Management systems are the “infrastructure of public administration” (Donahue, Selden, & Ingraham, 2000). Government’s management capacity is dependent on the administrative structure and technology of core management systems. The nature of government management rests both on the character and interrelatedness of each system— “their configurations, tasks, procedures, and work processes—on the ways in which these management systems are interrelated” (Ingraham et al., 2003). “A government’s ability to marshal its resources is housed within its core administrative functions: it involves generic staff activities such as financial management, human resources management, capital management, and information technology management. These activities, immersed in a context rich in political exigencies, interact in highly complex ways to influence a government’s performance” (Donahue et al., 2000). The financial management system is used to distribute and manage money for public purposes through procurement, accounting, cash management, and reporting processes. Human resource systems are used for recruiting, retaining, motivating, training, and terminating employees. Information management requires developing, maintaining, and using information systems to collect, analyze, and communicate key information throughout the organization. Infrastructure management means planning for, maintaining, and disposing of capital resources. 2. Integration: Good management is not only about the quality of the independent systems, but also “the extent to which these management systems operate according to consistent objectives, are mutually supporting, and are well coordinated” (Ingraham et al., 2003). The integration dimension is comprised of leadership, information use, and resource allocation. Management provides leadership that influences the organization by making important strategic decisions. Management provides guidance and direction by setting priorities and expectations and setting a vision that provides a “coherent and cohesive administrative framework” for the organization (Ingraham & Kneedler, 2000a). Ingraham and Kneedler (2000a) make a distinction between political and management leadership. Political leadership is important for providing direction and support for management structures and systems, but the organizational leadership is responsible for the operation and maintenance of the system. In other words, political management may determine the inputs that go into the black box, but management determines how they are utilized. The use and transmission of information is critical to coordinating the organizations efforts towards its goals. Finally, management makes decisions about how where to distribute resources, which has a critical impact on the effectiveness of the organization.
2
3. Managing for Results: Managing for results processes are how organization members obtain information to assess organizational efforts and make decisions for improvement. Efforts designed to evaluate agency activities and progress toward goals are critical for identifying, diagnosing, and correcting problems in the organizational processes and outputs (Ingraham et al., 2003). This dimension is characterized by a “formalized system of performance management that facilitates a trend of improving effectiveness” and a focus on continuous improvement (Ingraham et al., 2000). Unfortunately, Ingraham and Kneedler (2000a) do not provide many details regarding the environmental factors shown in Figure 1. Environmental factors the authors have identified include “characteristics of the constituent populations and socioeconomic conditions” that could impact results and performance (Ingraham & Donahue, 2000b). More specific detail about theses non-management concepts in the GPM is not provided. Nevertheless, the GPM synthesizes fairly well the management literature on effective management and organizations. Good management requires developing key systems, leading the organization in the operation of those systems, coordinating the efforts of the various systems, and monitoring the systems to identify problems and improve the system performance (Boyne, 2003; Grindle & Hilderbrand 1995; Miller & Cardinal 1994; Rainey & Steinbauer, 1999; Wolf, 2003). The definition of management used by the GPM has served as the basis for developing the measure of management quality discussed in the next section. Measuring Management Quality Management is a difficult concept to measure because it so broad-based, multifaceted, and complex. Meier and O’Toole (2002) claim the management measurement problem is nearly “intractable.” Studies of government performance attempt to account for management or management quality often measure the concept too narrowly or indirectly (Boyne et al., 2005). For example, some studies use spending as a proxy for management quality, though the two concepts are clearly different. Other studies account for the use of a limited number of particular “best practice” processes or procedures (Boyne, et al., 2005; Selden & Sowa, 2004). Many other studies use subjective measures of management based upon agency officials or employees perceptions (Boyne et al. 2005; Brewer, 2005; Brewer and Selden 2000; Moynihan and Pandey 2005, Nicholson-Crotty & O’Toole, 2004; Selden & Sowa, 2004). While these measures have been shown to have some correlation with objective measures of performance (Brewer and Selden 2000), relying on such measures can be misleading. Perceptual measures of management quality may rest largely on the perception of whether the organization is performing well, which brings the validity of the measures into question. Also, perceptions of management performance may be based upon employee satisfaction in their jobs, which is not necessarily related to the organizational performance (Boyne et al. 2005; Ford, Ford & McNamara, 2002). The Government Performance Project (GPP) is an effort to measure the management quality of the four organizational management systems and management overall in a direct, principlebased, and holistic manner. As such, the development of operational measures for the GPM
3
management systems is a major contribution to the public management literature (Hou, Moynihan, & Ingraham, 2001). The GPP brought to together a large group of academics, and journalists from Governing magazine, who collaborate to rate the quality of management in each of the 50 American states using criteria-based upon the GPM conception of management.1 The criteria-based assessment approach required establishing “clearly state and widely accepted conditions” and then evaluating states activities to assess how well they meet the conditions, taking into account context and resources. This is a best principles approach, rather than a best practices approach. This means that states were evaluated on how well they met certain sound management principles rather than requiring adherence to specific practices. This approach recognizes that different organizations operating in different contexts may follow different practices to meet the quality criteria. The GPP considers good management non-partisan in that no political party or government form is the best (GPP Final Report). The management system quality criteria are summarized in Table 1. [Insert Table 1 here] The management systems and criteria presented in Table 1 were selected “because they were judged to be common systems in all levels of government, they have common characteristics that are amenable to comparison, and they compromise a major part of government managers’ and organizations’ management activities” (GPP Final Report). The specific quality criteria were determined by consulting with leading practitioners and experts in the respective areas. While management factors are often measured and tested separately, the GPP makes a holistic assessment of management quality. This aligns with the idea that effective management is noted by a clustering of factors together (Kalleberg & Moody, 1994). Using a more holistic and integrated approach for measuring management quality captures the concept of management better than the many studies that treat management activities as discrete, additive elements (Hou et al., 2001; Bradach, 1996). After reviewing the data sources the group of experts collectively agreed on a letter grade ranging from A to F based on common criteria for each management system area. The criteria show in Table 1 are not one-size fits all best practices, but represent best principles that if followed are supposed to mean better management. Essentially, the GPP criteria emphasize formal planning for and monitoring of the performance of each system, along with operational transparency and accountability. Also, the GPP criteria and process attempt to account for the implementation of plans and the communication of performance information (Ingraham & Moynihan, 2001). Formal policies, procedures, processes, monitoring, and communication define good management in the GPP. The GPP emphasizes rational decisionmaking based upon formal planning and analysis. Effective planning helps an organization to promote adaptive thinking and fit with the environment while improving organizational integration and control (Miller and Cardinal 1994; Yang & Holzer, 2006). Planning is “an attempt to influence the future by forecasting changes in the organization and its environment, setting objectives, and setting strategies for achievement of these objectives” (Boyne, 2001). A review of the empirical literature on planning and organizational performance in the public 1
The GPP has reported grades on the quality of state management in 1999, 2001, and 2005. After 2001, the project was taken over by a nonprofit group called GPP and the management categories were consolidated and the criteria were slightly modified.
4
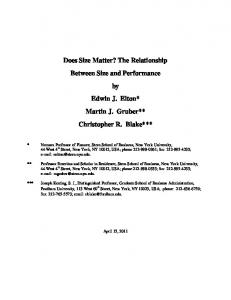
sector finds a generally positive impact for planning, although the strength and nature of the impact is not known. However, planning is not a sufficient condition for organizational success (Boyne, 2001). Planning and formalization do not guarantee effective execution. The overall management quality grades represent an averaging of the five system scores with each system receiving equal weight. Figure 2 is a histogram of the overall GPP management grades. [Insert Figure 2] As Figure 2 illustrates, the distribution of the grades is approximately normal, although there are significant gaps with no grades of “F” and only one “D” level grade. The most common grade is “B-” or 2.7 (nearly 25%).” Forty-two percent of the grades are “C” level grades and 50% are “B” level grades. In short, there are few high or low performers in the states and most states are average when it comes to management quality, with nearly 60% of grades falling within in the “B-” to “C+” range. Prior Empirical Tests Using GPP Grades Several empirical studies have used the GPP data in research on government performance. Jennings and Ewalt (2003) analyzed the impact of management capacity on activities and outcomes of state welfare programs. The authors found statistically significant positive and negative relationships between the overall management grades and various self-reported activities or outputs by state welfare agencies. However, management capacity was not correlated with welfare outcomes including job entry rates, job retention, and earnings grain measures. Other important determinants of earnings gains were unemployment, median family income, spending on TANF, and strict enforcement of sanctions (Jennings & Ewalt 2003). Coggburn and Schneider (2003a) report finding no relationship between managerial capacity and unspecified state outputs and outcomes. Coggburn and Schneider (2003b) also examine the relationship between state quality of life and management capacity ratings, state income per capita, and relative spending on programs with collective benefits. The authors find that state management quality, as measured by the GPP grade, is positively related to higher qualities of life. Other studies incorporate GPM indirectly as a basis for analysis of organizational performance or to assess the impact of the management dimensions on other phenomena. Pandey, Coursey, and Moynihan (2004) found that measures of “red tape” for two of the management systems were related to perceived negative performance of state health and human services agencies. Also, O’Leary and Yandle (2000) did not find a strong relationship between GPP management ratings and the strength or quality of state environmental dispute resolution programs. Prior research using the GPP suggests mixed results and that the grades may be promising a way to operationalize the concept of management quality in a holistic and quantitative manner that also could provide insights into what specific activities or principles one should do to develop effective management within an organization.
5
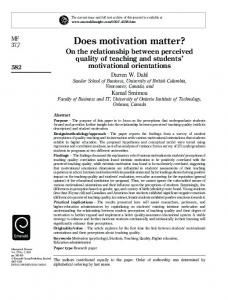
The Sabatier & Mazmanian Implementation Success Model The implementation literature focuses on explaining the success or failure of government policy and programs. Unlike the public management literature is emphasizes the role of policymakers how policy can be designed to facilitate success (McFarlane & Gruebel, 2006 and Barrett, 2004). Top-down implementation models conceptualize government performance as a process that can be controlled by central, elected officials. While the public management literature has focused on the performance of educational organizations, the implementation literature focus largely on the performance of intergovernmental programs, especially regulatory ones (Kettl, 1993). One of the most well developed and empirically tested, top-down models was posited by Mazmanian and Sabatier (McFarlane & Gruebel, 2006). The Mazmanian and Sabatier (1980) implementation success model (ISM) is used in this analysis and is presented Figure 3 below. [Insert Figure 3 here] The ISM identifies three major concepts: problem tractability, structuring of policy implementation, and other factors. The tractability of the problem refers to the idea that the technology available to deal with the problem situation and the severity of the problem will have an effect on how the policy is designed, what non-policy factors also affect implementation success, and the effectiveness of any policy intervention. The structure of the policy refers to its goals, an implicit causal theory about how to impact the problem situation, financial resources, the decision rules of the implementing agency, ability of outside actors to influence implementation, and the selection of implementers. Generally, programs are more likely to be effective it goals are clearly understood, there is a sound understanding of the causes of the problem, sufficient financial resources are provided, the agency has effective decision rules, supportive outside are given the ability to influence while opponents are blocked, and supportive implementers are selected. Major elements of non-policy factors include socioeconomic conditions, attitudes and resources of external groups, commitment of implementing officials. These non-policy factors can improve or hinder chances of program success (Lester & Bowman, 1989). Research Design, Data, Method, and Measurement Methodologically, past research in both public management and implementation research has often used a case study approach with a limited number organizations or cross-sectional large-N quantitative analysis (Boyne et al., 2005; O’Toole, 2000b; O’Toole, 2004). Both approaches limit the ability to make generalizations, particularly about causal relationships. Prior implementation research has also has been criticized for its “failure bias.” Implementation success has often been conceptualized and measured too simplistically as a dichotomous phenomenon (deLeon, 1999; Saetren, 2005). Implementation is conceptualized as either a total success or failure. In reality, implementation success should be considered as more of a continuum. There can be some degree of success without achieving every goal or desired outcome. Also, one cannot fairly judge the implementation without accounting for other factors, outside of the implementers’ control, that could determine what goals are met or outcomes achieved.
6
This study addresses some of the limitations of past implementation and government performance research by conducting a large-n, comparative analysis of all fifty American states on different performance measures in the area of environmental policy, while accounting for other theoretically relevant factors that could impact the selected dependent variables. The comparative nature of the analysis also allows implementation success to be evaluated in relation to peers charged with the same task and facing similar management challenges, avoiding a more absolute and dichotomous standard of implementation success. Specifically, this analysis uses graphical display of data, descriptive statistical comparisons, and basic bivariate and regression methods to assess the empirical support for the conceptual relationships detailed between the concepts identified in both models. The general reduced form models for both the GPM and the implementation model analysis are: GPM: O = f (E, M)
ISM: O = f (P, S, N)
where O refers to government performance in terms of outputs or outcomes, E refers to environmental factors, M is management, P refers to problem tractability, S refers to statutory factors controlled by policy makers, and N represents non-statutory factors, which includes the management skill of implementers. Governance scholars typically use some variation of this governance model as a conceptual base for their analyses (Hill & Lynn, 2004a). In order to conduct the test of the two models, the model concepts will be measured as described below. Analysis Context The testing of the theoretical models will be undertaken in the context of air pollution control policy at the state level. The Clean Air Act is the primary national, environmental, legislation for regulating and reducing the level of air pollution in the United States. In 1990, Congress revised the Clean Air Act (CAA), providing USEPA even broader authority to implement and enforce regulations reducing air pollutant emissions. Under the Clean Air Act, USEPA sets limits on certain air pollutants to ensure basic health and environmental protection from air pollution. The pollutants targeted for reduction include nitrogen dioxide and sulfur dioxide. The CAA also gives USEPA the authority to limit emissions of air pollutants coming from point sources like chemical plants, utilities, and steel mills. Individual states may have stronger air pollution laws than the federal government, but they may not have weaker pollution limits than those set by USEPA (USEPA, 2007a). State governments have also been allowed to take the primary responsibility for implementing the CAA. State environmental agencies monitor air quality, inspect facilities under their jurisdictions and enforce federal and state air pollution regulations. States must develop State Implementation Plans (SIPs) that outline how each state will control air pollution. A SIP is a collection of the regulations, programs and policies that a state will use to clean up polluted areas. The USEPA approves state agency SIPS and if plan does not meet federal requirements, the USEPA can issue sanctions against a state (USEPA, 2007a). Additionally, if states doe not meet USEPA air quality standards for air pollutants in a particular metropolitan statistical area, that area can be designated as being in non-attainment. Legally, the USEPA has greater authority
7
to require particular actions from state environmental agencies regarding non-attainment areas. Practically, the USEPA puts more pressure on state’s to take the necessary action to bring these areas into attainment (USEPA, 1999b, 2001b). To implement the CAA each state environmental agency engages in various types of surveillance and enforcement actions. Major types of surveillance activities include compliance inspections, off-site record reviews, and citizen complaint reporting. Compliance inspections involve visiting “a facility or site for the purpose of gathering information to determine compliance including direct observations of facility operations” (Blakeslee & Rong, 2006). Within the compliance e inspection category, states and the USEPA have defined four subcategories of compliance inspections, including compliance evaluation, sampling, reconnaissance or screening, and case development. Reconnaissance inspections involve efforts “to obtain a preliminary overview of a facility’s compliance program and status (Blakeslee & Rong, 2006). Compliance evaluation inspections are done to determine compliance with environmental regulations, but do not involve sampling. Case development inspections are done when violations have been identified and an agency is collecting specific information to support enforcement efforts. Although, the states and the USEPA have agreed on these definitions the states do not typically record or report inspection data using these definitions. States do report that compliance evaluation inspections are the most common type of inspection conducted (Blakeslee & Rong, 2006). The final way state agencies obtain information about regulated facilities compliance activities is from complaints, typically from contacts from individual citizens or interest groups (Blakeslee & Rong, 2006). In addition to inspections, state agencies engage off-site surveillance activities of testing or sampling done on-site or of records and information provided by regulated entities either voluntarily or at the request of the agency. While the purpose of surveillance activities is to identify violations of CAA regulations, once violations are identified state agencies undertake various types of enforcement actions to get regulated entities to take actions to bring their facilities back into compliance. Agencies use a wide range of enforcement tools to motivate regulated entities to bring their facilities into compliance. Enforcement tools include oral and written notifications of violations, field citations, negotiation of voluntary compliance agreements, issuance of proposed or final orders for action, financial penalties, and legal prosecution that can result in fines or orders to stop operations (Blakeslee & Rong, 2006). Data and Measurement This section identifies the data sources for the analysis and describes the nature of the data and the operational measures used in the empirical analysis. Operationalizing Government Performance There is no universal measure of performance or service quality for public organizations and different individuals and groups value different criteria and weight the same criteria differently. However, government services do have tangible characteristics that may be valued to some extent by most or all citizens. The government performance literature identifies seven main measures of public service performance (Boyne, 2003):
8
1. 2. 3. 4. 5. 6. 7.
Quantity of outputs (e.g., number of inspections performed) Quality of outputs (e.g., thoroughness of inspections) Efficiency (e.g., input cost per number of inspections) Equity (e.g., fairness of cost and benefit distribution for inspections) Outcomes (e.g., reduction in pollution arising from inspections) Value for money (e.g., cost per unit reduction in pollution) Client/citizen satisfaction (e.g., consumer perception of timeliness of inspections or professionalism of inspectors)
This analysis examines the impact of management quality on performance in terms of output quantity and outcomes. Specifically, the output measure is the number of compliance inspections per regulated facility performed by each state agency under the Clean Air Act. This data was obtained from two surveys of states conducted in 2001 and 2003 by the Environmental Council of the States (ECOS) about states’ environmental enforcement and compliance activities. The inspection data is likely the lowest quality and least comparable of all the data used in the analysis. As noted in the prior section, there is likely inconsistency in how states define, collect, and report on their activities. Also, the response rate for the surveys was below 50% in the second survey. Instead of relying on partial state data, inspection numbers were estimated based upon prior the prior survey in which data for all states was reported and based upon averages from the actual data from the second survey. The outcome measures are the level of nitrogen dioxide and the level of sulfur dioxide emissions from point sources per person or per regulated facility in each state as reported by the USEPA in the National Emissions Inventory (USEPA, 1999a, 2001a). Additionally, for sulfur dioxide emissions, the number of people in a state living in a non-attainment area is modeled as an outcome measure (USEPA, 1999b, 2001b). Operationalization of the GPM Model Management Quality: The concept of management quality is measured using state management grades developed by the Government Performance Project (GPP). Environmental Contingency Factors: The appropriate contingency factors will vary depending upon the performance concept. In general, scholars have found that the more severe the problem the more activity or outputs we expect from environmental agencies. Conversely, the more severe the problem the more difficult it is for an agency to achieve desired outcomes, such as reducing pollutant levels to attainment standards set by the USEPA (Bacot & Dawes, 1997; Lester, Franke, Bowman, & Kramer, 1983; Lowry, 1992; Potoski & Woods, 2002). For the inspections variable, the land area of the state is included as a contingency factor (U.S. Census Bureau, 1999, 2001). The larger a state the fewer inspections an agency would be able to do at a given level of management quality. For the nitrogen dioxide and sulfur dioxide emissions data, contingency factors include the annual consumption of petroleum and annual consumption of coal in the state, respectively (U.S. Department of Energy (DOE), 1999, 2001). The burning
9
of fossil fuels and the burning of coal are the primary source of the respective emissions and represent the difficulty of the task faced by the agency (Ringquist, 1993; USEPA, 2003). Operationalizing the ISM In order test the ISM model, its concepts will be measured in the manner described below. Problem Tractability To measure the dimensions of problem tractability, the level of coal and petroleum consumption and the dollar value of polluting industries per capita will be incorporated to the analysis, where relevant, to account for the diversity and depth in each state’s pollution problem (U.S. DOE, 1999, 2001). Land area is a measure of problem tractability for inspections (U.S. Census Bureau, 1999, 2001). The available technology for dealing with problems is largely standardized by the United States Environmental Protection Agency (USEPA) and should not vary much, if at all, between states. Therefore, this concept is not accounted for in the analysis. Statutory Factors The overall program intervention framework for environmental agencies is the same since it is established by the federal government under the Clean Air Act and the oversight of the United States Environmental Protection Agency (USEPA). The USEPA constrains states in terms of specific programs they can use to meet pollution standards and requires use of best available technology. Therefore, the outputs and outcomes achieved by each state should not be the result of flawed or widely divergent program interventions or technologies. This means that differences in state performance should not result from differences in factor numbers 1, 4, 5, 8, and 10 in Figure 3. Therefore, these concepts are not used in the model. The financial resources concept is measured by including the amount spent by each state on its air quality program. This data was provided by the Environmental Council of the States (ECOS) from a regular survey it conducts2. The integration measure is accounted for in two ways. A dummy variable for each USEPA region is incorporated (USEPA, 2007b). Prior research suggests USEPA regions vary in how stringently they enforce national pollution laws. The USEPA is perceived to be one of the most influential institutional actors by state EPAs (Hays, Esler, & Hays, 1996; Potoski & Woods, 2000; Waterman & Rouse, 1999). Some regions adopt an approach more accommodating and sympathetic to the states in the region and the practical and political challenges they face. Other regions are less sympathetic to the states and emphasize a stronger compliance focus more in line with the expectations of USEPA central administration (Crotty, 1988; Allen, Pettis, & Haider, 2004). The main problem with this measure is that there is no a priori expectation as to which regions will be more and less strict in their enforcement. Past research suggests that the relationships can change depending upon the management personnel in the states, the region and USEPA headquarters. Nevertheless, one would expect variety in the impact that the regions have 2
FY 1996 spending data was used in the 1999 model since it was the closest prior year available.
10
on how integrated the implementation effort is and the pressure on states to produce enforcement outputs and results. Second, at the state level, the structure of the state agency is accounted for using dummy variables for the four types of state environmental agency structures—super, mini-EPA, health, and decentralized—going from most to least consolidated. Decision rules are measured with an ordinal ranking of how stringent the states relevant environmental laws are. More stringent laws suggest more support for a tough approach to reducing pollution. There is one stringency measure for sulfur dioxide, one for nitrogen dioxide and one general measure (Potoski, 2001; STAPPA & ALAPCO, 2002). Access by outsiders is another concept not measured since the national policy would be similar in this regard for all states. The selection of implementers dimension is inherently measured since all relevant variables are measured at the state level. Non-statutory Factors There is overlap between problem tractability and some of the non-statutory factors. Specifically, the measure of coal and petroleum consumption and the value of polluting industries are key socioeconomic conditions that can impact the effectiveness of the air pollution control program. Popular and constituency group support for air pollution efforts will be captured using a measure of citizen ideology in each state. More liberal state populations are expected to demand more stringent environmental enforcement and results through general public opinion and interest group efforts (Berry, Ringquist, Fording & Hanson, 2007). Support from sovereigns and commitment of implementers at the state level will be measured with a government ideology measure for each state. This measure assesses both the level of liberalism among the different branches and chambers of government institutions in each state and the relative control over the government by liberals and conservatives. The citizen and government ideology measures come from Berry et al. (2007). At the national level, the measures for the different USEPA regions would be a very rough measure of varying support for the pollution control program from federal officials. Hypotheses Government Performance Model The expected relationships between the management and environmental variables will vary depending on the dependent variables. The inspections variable is a measure of output quantity, which should be strongly within the control of management. As such the relationship should be that the higher the management quality the higher the number of inspections done. The contingency factor should have negative relationship with inspections. However, relative to the management variable, the impact of the contingency factor should be rather small.
11
Conversely, the contingency factor should dominate the management variable in terms of impact on the emission variables. While outputs are strongly within the control of management, outcomes typically are not. Even with high quality management, the level of petroleum and coal consumption in a state should primarily determine emissions. Still, management quality should have a small and negative impact on emissions. That is, as the management grade increases the volume of emissions should decrease minimally. The contingency factors should have a large positive impact on the respective emissions variables. Implementation Success Model Problem Tractability: Problem tractability variables should be related to both state agency outputs and outcomes. The higher the per capita or per regulated facility the level of coal and petroleum consumption and value of polluting industries the more inspections per capita or per regulated the more inspections per capita or facility are anticipated. A similar relationship is expected with emissions and non-attainment with higher levels of both the more severe pollution levels. It is also expected that problem tractability will have a higher magnitude impact on outcomes relative to outputs. Statutory Variables: Pollution control spending per capita or facility should be related to more inspections and better outcomes or less emissions and more attainment. It is theorized that more revenues or income means more outputs and better outcomes, although, the empirical evidence on this is mixed (Boyne 2003; Lowry, 1992; Potoski & Woods, 2002; Wood, 1992). However, I think this relationship is likely to be non-linear. Boyne’s review of government performance literature (2003) found that resources measures are one of the few factors consistently found to impact government performance, although the findings are mixed. Boyne contends this is because the relationship has not been measured consistently properly. I agree with Boyne’s conclusion, but think the main problem is a conceptual and analytic issue and secondarily a measurement one. Studies assume a linear relationship. I think the relationship is likely nonlinear and more complex than this. To obtain any level of outputs or impact on outcomes, some minimum threshold level of resources are required. Then one would expect a range over which there are increasing gains for additional resources. Finally, after some maximum threshold level of spending one would expect to find diminishing returns on additional spending in terms of outputs and outcomes. No specific hypotheses can be offered regarding the different USEPA region measures in terms of direction or magnitude. The expectation is that the regions would have statistically detectable differences on outputs and outcomes and the direction of the impact would vary with some positively and some negatively related to the dependent variables. Lester et al. (1983) found that the more consolidated the agency the stronger the environmental policy. Agencies were ranked from least consolidated to most—decentralized, health agency, mini-EPA, and super agency. Therefore the expectation would be that more consolidated agencies would produce better results. It is not clear what the expected impact on outputs would be.
12
The measure of the stringency of state relevant state laws should be correlated with more outputs and better outcomes. That is, the more strict the laws the more inspections and the better the environmental emission outcomes. Non-statutory Factors Citizen and government ideology are measured so that the higher the score the more liberal a state’s citizens and government institutions. More liberalism in a state should be related to more inspections and better outcomes. More liberalism should also be related to more spending, more stringent state laws, and more consolidated agency structures. The GPP management quality variable is measure so that higher scores mean better management. Therefore, better management should be related to more inspections, less cost per inspection, and better outcomes. The management quality variable should not be related to partisanship and should be positively related with spending. That is, higher spending will be related to higher quality management. Boyne (2003) has found that measures of management are consistently found to be related to government performance. Analysis This section presents and analyzes the results of the various OLS and other analyses conducted using measures of the concepts identified by the GPM and ISM as a framework for explaining state agency environmental inspection outputs and emission outcomes. Air Pollution Inspections Table 2 shows the results from OLS regression models of air pollution on-site inspections per regulated facility. [Insert Table 2 here] The only variable approaching significance in Table 2 is for one USEPA region (Region 3: Delaware, Maryland, Pennsylvania, Virginia, and West Virginia), which also has a positive sing indicating a positive relationship with inspections per regulated facility. Neither model of the inspections measure provides significant results, particularly for the management quality measure or spending. These results are surprising from a theoretical perspective since the output measure was expected to be most related to management quality since management should have strong ability to control the number of inspections completed. The lack of significance for spending per facility variable is especially surprising given that one would expect that resources would be an important factor in determining how many inspections one is able to do3. This result could be explained largely by incomparability and inconsistency of the inspections and regulated facilities data. Many states do not seem to maintain detailed records on inspections and facilities and seem to report inconsistently to the USEPA. Also, even when such records are 3
Bivariate analysis shows a statistically significant relationship between spending and the total number of inspections and the number facilities regulated, but not between spending and inspections per facility regulated.
13
maintained, different states typically have different definitions for the different types of inspections and other monitoring and enforcement actions they take (ECOS, 20XX). While ECOS worked with states to address these issues, there still may be significant problems data quality. Additional empirical analysis and review of additional empirical literature, suggests that the regression results were not surprising. Bivariate analysis and basic plotting of the data suggest a statistically significant non-linear relationship between the total number of inspections and the GPP grade. Plotting the inspection and GPP variables shows a relationship in the shape of a tipping over “L.” This suggests that until management quality gets to a certain minimum level the number of on-site inspections made declines. The relationship between the two variables is positive from the “C” to the “B+” range and then becomes negative again from “B+” to “A-“. However, this relationship is weakened and becomes statistically insignificant with the variable of inspections per regulated facility—the graph shape becomes a wide “U” shape. Speculatively this may suggest that high performing management is able to work smarter and perform fewer inspections. Therefore, the use of more sophisticated methods could result in statistically significant findings. Also, visual display of the inspections per facility and spending per facility variables show that, with few exceptions, regardless of the spending per facility state environmental agencies do not exceed the average of one on-site inspection per year of regulated facilities. This suggests that agencies are not investing in additional on-site inspections with more funding, but must be using additional resources to conduct other types of monitoring, such as off-site records reviews, or, speculatively, in other organizational investments, such as higher employee salaries. However, together these analyses support findings from other empirical literature, that agency monitoring decisions are rather sophisticated. Agencies do not simply randomly inspect facilities and do more inspections with more resources. Instead environmental agencies, particularly effective ones, try to maximize compliance and the benefit received from agency resources by carefully targeting facilities based upon past compliance history and environmental risk (Helland, 1998). Therefore, there is not a simple linear, brute-force approach to inspections. Instead of increasing inspections, on average, for all facilities agencies target for more inspections facilities that are more likely to be in violation based upon prior experience. Again, more sophisticated modeling techniques, coupled with more disaggregated inspection, could enable a better analysis of the impact of spending and management quality on inspection outputs. Tables 3 and 4 show regression results for the outcome variables nitrogen dioxide and sulfur dioxide emissions, respectively. [Insert Table 3 here] The nitrogen dioxide (NOX) regressions provide more promising results than the inspections models. First, the implementation success model (ISM) is an overall better model than the government performance model (GPM) and the results are more in line with theoretical expectations. This is also true for the full model, which incorporates only the statistically significant variables from the ISM. In this case, the ideology variables no relationship to
14
emission levels per capita. Most importantly, the GPP grade measure of management quality is significant and shows the proper sign in both the ISM and full models. This indicates that as management quality increases the level of a state’s NOX emissions per person decreases. Better management results in better environmental outcomes. Also as expected, increases in petroleum consumption are associated with increases in emissions. Conversely, increases in spending per facility, existence of the consolidated super agency structure, and more strict state standards for NOX emissions, are related to decreased emissions. However, spending does not seem to have any meaningful magnitude or consistent relationship with emissions. The impact of the super agency structure is also not clearly negative since the coefficient confidence interval goes from negative to slightly positive. All the USEPA regions with a statistically significant relationship with emissions (Regions 3: Delaware, Maryland, Pennsylvania, Virginia, and West Virginia; Region 4: Alabama, Florida, Georgia, Kentucky, Mississippi, North Carolina, South Carolina, Tennessee; Region 5: Illinois, Indiana, Michigan, Minnesota, Ohio, Wisconsin; Region 7: Iowa, Kansas, Missouri, Nebraska; and Region 8: Colorado, Montana, North Dakota, South Dakota, Utah, Wyoming) show a positive relationship with emissions. Because there was no definitive a priori expectation for the expected relationship for the particular USEPA regions, strong conclusions cannot be drawn. However, the results support the idea that some USEPA regions may be developing relationships with state environmental agencies that do not emphasize a strict focus on demanding emission reductions. [Insert Table 4] Table 4 presents sulfur dioxide (SO2) model results that are quite different the NOX model results. Neither model is clearly better at explaining SO2 emissions. This is because the only variable that is statistically significant and consistently related to SO2 emissions is the coal consumption variable, which is included in both models. None of the other management, policy, or political variables is significant or consistently related to S02 emissions4. These divergent results appear problematic for both models and for GPP as a measure of management quality. However, Table 5 shows results for OLS results for models of the percent of people in each state living in areas designated as non-attainment areas for SO2 emissions. The USEPA requires states to institute new and stricter environmental control programs in non-attainment areas. Being in non-attainment is one of the most serious violations a state can have and typically results in strong enforcement efforts from the USEPA. [Insert Table 5 here] Table 5 shows results that are almost the exact opposite from Table 4. In Table 5, the GPM model is superior to the ISM model because only management quality and policy-related variables, agency structure and stringency of state SO2 standards, are significant and are related in a consistent manner. The existence of a consolidated super agency structure and more strict 4
Graphical display and bivariate analysis show a positive, non-linear, statistically significant relationship between the GPP grade and the measure of sulfur dioxide (SO2) emissions, emissions per capita, and emissions per regulated facility. There is a negative, non-linear, statistically significant relationship between spending per capita and SO2 emissions.
15
state SO2 standards are all related to fewer people in a state living in non-attainment areas for a state. While management quality is significant, the sign is not in the theoretically expected direction. Unlike in the SO2 analysis, the coal consumption variable is not significantly related to the non-attainment. These results suggest that agencies with the super agency structure and states with more strict SO2 laws are best able to prevent or reduce serious violations of the Clean Air Act. Of course, they also may suggest that states with non-attainment problems may adopt more strict policies and agency structures more suited to addressing the non-attainment problem. Even more interesting, the results suggest that serious enough environmental problems can be overcome with appropriate policy action, negating even the impact of economic variables such as petroleum consumption. This conclusion also could be supported with the findings from Table 4, as it is not uncommon for states to reduce or eliminate programs in areas that are deemed strongly in “attainment” after a period of being in non-attainment. Additionally, efforts to bring non-attainment areas into attainment often can result in emission shifting in the state, companies closing facilities in non-attainment areas and/or opening new facilities in attainment areas or reducing production of facilities in non-attainment areas and increasing production at facilities in attainment areas. Therefore, state efforts may reduce the percent of people living in nonattainment areas, while not significantly impacting overall emission levels for the whole state. This finding is bolstered by the fact that an analysis of NOX non-attainment did not show similar findings because there is only one state that has any residents living in a NOX non-attainment area. This suggests that if states are not facing serious violations and action from the USEPA regarding non-attainment, they will focus on reducing overall emissions of target pollutants like NOX. Management also seems to matter for serious environmental violations but not in the expected direction. This calls into question the validity of the GPP grade as a valid measure. Additional Analysis of Relationships between Variables of Interest To better understand the relationships between key variables of interest, additional visual displays and bivariate tests were conducted. Notable results include finding no meaningful linear relationship between spending and the GPP grade but a statistically significant non-linear, bivariate relationship. There also is no meaningful or statistical relationship between the ideology measures and the GPP grade or agency structure. There is no relationship between spending (or spending per facility) and government ideology. Conclusion: Policy Implications, Limitations, and Future Research This analysis represents a first step, in one-part of a larger research agenda seeking to assess the theoretical knowledge in the field regarding how government performance can be improved, with a focus on the role of public management. All together, the findings suggest some very interesting policy implications. First, for an intergovernmental policy such as the CAA, the details of the policy matter in terms of directing state policy administrative efforts and regarding the outcomes achieved. States will focus on solving problems for which there is strong enforcement and real potential sanctions involved, such as when they have regions in nonattainment for meeting minimum emission standards. However, efforts to meet those targeted goals result in states neglecting other broader goals, such as reducing overall pollution emissions. Conversely, when not faced with significant sanctions for specific non-compliance issues, as was the case with NOX emissions, states will focus on broader goals of emission reduction.
16
Perhaps most importantly, the analysis indicates that policy design matters and can be more important than management, particularly if strong enough incentives or sanctions are part of the design. The impact of management is much less clear. Management quality, as measured by the GPP grades, may matter in certain contexts. Although, the inconsistent results require more sophisticated testing to evaluate the relationships for effectively. Good management and policy design may result in better outcomes when focused on particular policy problems. However, there may be a limited ability to deal with multiple problem issues effectively, particularly within given resources. The analysis also suggests that the implementation model is superior to the original GPM model for exploring the government performance issue. The GPM model ignores too many key factors. However, the analysis also suggests that continued testing of our theoretical models can result improved understanding of these relationships and ultimately better theoretical models. The GPP management measure may prove to be a promising measure of management for conducting empirical testing, but the inconsistent results may mean that the GPP grade is not a valid measure. The measure showed some empirical relationship with one of the outcome measures that matched theoretical expectations, but not in another. Some support for the validity of the GPP measures is that it was related to spending in a non-linear fashion that is supported by theory. Also, the GPP was not related to measures of citizen or government ideology, which was also the expected relationship. While further testing of the validity of this measure is merited, this analysis and past research provide some support for the use of the GPP as a reasonable and holistic measure of management quality not typically used in much public management research. Still, these conclusions should be viewed as tentative. As this analysis showed, the relationships between management, policy design, other factors, and government performance are complex and often non-linear. Surprisingly, these complexities were most problematic in trying to model government agency outputs. Apparently, modeling and measuring outputs to explain performance requires more sophisticated understanding and approaches than explaining the outcomes resulting from agency efforts. This analysis should be improved by employing more sophisticated techniques that enable a better evaluation of non-linear relationships of multiple variables with different variances and levels of measurement. Further, conclusions about the validity and quality of the theoretical models warrant additional research. The generalizability of theoretical and empirical conclusions drawn here should be tested in other policy areas. Future iterations of this project will include replicating this analysis with more advanced statistical methods and testing them in the area of transportation policy.
17
References Allen, Mahalley D., Pettus, Carrie, & Haider, Donald P. (2004). Making the national local: Specifying the conditions for national government influence on state policy making. State Politics and Policy Quarterly, 4(1), 318-344. Bacot, A. Hunter & Dawes, Roy A. (1997). State expenditures and policy outcomes in environmental program management. Policy Studies Journal, 25(3), 355-370. Berry, William D., Ringquist, Evan J., Fording, Richard C., & Hanson, Russell L. (2007). Measuring citizens and government ideology in the American States, 1960-93. Inter-University Consortium for Political and Science Research, Study No. 1208. Blakeslee, Mary E. & Rong, Fang (2006). State environmental agency contributions to enforcement and compliance: 2000-2003. Environmental Council of the States. Borins, Sandford (2004). Grading the graders [Review of the book Government performance: Why management matters]. Journal of Public Administration Research and Theory, 15(3), 463466. Boyne, George A. (2001). Planning, performance and public services. Public Administration, 79(1), 73-88. Boyne, George A. (2003). Sources of public service improvement: A critical review and research agenda. Journal of Public Administration Research and Theory, 13(3), 367-394. Boyne, George A., Meier, Kenneth J., O’Toole, Laurence J., & Walker, Richard M. (2005). Where next? Research directions on performance in public organizations. Journal of Public Administration Research and Theory, 15(4), 633-639. Bradach, Jeffrey (1996, November). Organizational Alignment: The 7-S Model (Note 9-497045). Watertown, MA: Harvard Business School Publishing. Available at http://harvardbusinessonline.hbsp.harvard.edu. Brewer, Gene A. (2005). In the eye of the storm: Frontline supervisors and federal agency performance. Journal of Public Administration Research and Theory, 15(1), 505-527. Brewer, Gene A. & Selden, Sally Coleman (2000). Why elephants gallop: Assessing and predicting organizational performance in federal agencies. Journal of Public Administration Research and Theory, 10(4), 685-711. Brown, R. Steven, & Green, Valerie (2001). State environmental agency contributions to enforcement and compliance. Environmental Council of the States. Accessed on October 22, 2007 at http://www.ecos.org/section/publications.
18
Coggburn, Jerrell D. & Schneider, Saundra K. (2003a). The quality of management and government performance: An empirical analysis of American states. Public Administration Review, 63(2), 206-213. Coggburn, Jerrell D. & Schneider, Saundra K. (2003b). The relationship between state government performance and quality of life. International Journal of Public Administration, 26(12), 1337-1354. Crotty, Patricia McGee (1988). Assessing the role of federal administrative regions: An exploratory analysis. Public Administration Review 48(2), 642-648. DeLeon, P.S. (1999). The missing link revisited: Contemporary implementation research. Policy Studies Review, 16(3/4), 311-338. Donahue, Amy Kneedler, Selden, Sally Coleman & Ingraham, Patricia W. (2000). Measuring government management capacity: A comparative analysis of city human resources management systems. Journal of Public Administration Research and Theory, 10(2), 381-411. Ford, Jeffrey D. Ford, Laurie W. & McNamara, Randall T. (2002). Resistance and background conversations of change. Journal of Organizational Change Management, 15(2), 105-121. Government Performance Project (1999). State Grade Report. Accessed on October 22, 2007 at http://www.maxwell.syr.edu/gpp/index.asp. Government Performance Project (2001). State Grade Report. Accessed on October 22, 2007 at http://www.maxwell.syr.edu/gpp/index.asp. Government Performance Project (2002). Paths to Performance in State & Local Government: A Final Assessment from the Maxwell School of Citizenship and Public Affairs. Government Performance Project (1999). State Grade Report. Accessed on October 22, 2007 at http://www.maxwell.syr.edu/gpp/grade/2002full.asp Grindle, Merilee S. & Hilderbrand, Mary E. (1995). Building sustainable capacity in the public sector: What can be done? Public Administration and Development, 15, 441-463. Hays, Scott P., Esler, Michael, & Hays, Carol E. (1996). Environmental commitment among the states: Integrating alternative approaches to state environmental policy. Publius: The Journal of Federalism, 26(2), 41-58. Helland, Eric (1998). The enforcement of pollution control laws: Inspections, violations, and self-reporting. The Review of Economics and Statistics, 80(1), 141-153. Hill, Carolyn J. & Lynn, Laurence E. (2004a). Governance and public management: An introduction. Journal of Policy Analysis and Management, 23(1), 3-11. Ingraham, Patricia W., Joyce, Philip G., & Donahue, Amy E. Kneedler (2003). Government performance: Why management matters. Baltimore, MD: Johns Hopkins University Press.
19
Ingraham, Patricia W. & Kneedler, Amy E. (2000a). Dissecting the black box: Toward a model and measures of government management performance. In Jeffrey L. Brudney, Laurence J. O'Toole, Jr., & Hal G. Rainey (Eds.), Advancing public management: new developments in theory, methods, and practice (pp. 235-252). Washington, DC: Georgetown University Press. Ingraham, Patricia W. & Donahue, Amy E. Kneedler (2000b). Dissecting the black box revisited: Characterizing government management capacity. In Carolyn J. Heinrich & Laurence J. Lynn, Jr. (Eds.), Governance and performance: New perspectives (pp. 292-318). Washington DC: Georgetown University Press. Ingraham, Patricia W. & Moynihan, Donald P. (2001). Beyond measurement: managing for results in state government. In Dall W. Forsythe (Ed.), Quicker, better, cheaper? Managing performance in American government (Eds.) (pp. 309-334). Albany, NY: Rockefeller Institute Press. Jennings, Edward T. & Ewalt, Jo Ann G. (2003). Does the black-box make a difference? The quality of management and the success of welfare reform. Prepared for presentation at the National Public Management Research Conference, Georgetown University, Washington D.C., October 9-11, 2003. Accessed on October 22, 2007 at http://teep.tamu.edu/Npmrc/Jennings.pdf Kalleberg, A.L. and Moody J.W. (1994). Human resource management and organizational performance. American Behavioral Scientist, 37(7), 948-962. Kettl, Donald F. (1993). Searching for clues about public management: Slicing the onion different ways. In Barry Bozeman (Ed.), Public management: The state of the art (pp. 55-68). San Francisco: Jossey-Bass Publishers. Hou, Yilin, Moynihan, Donald P., & Ingraham, Patricia Wallace (2003). Capacity, management, and performance: Exploring the links. American Review of Public Administration 33(3), 295315. Ichniowski, Casey, Kochan, Thomas, Levine, David, Olson, Craig, & Strauss, George (1996). What works at work? Overview and assessment. Industrial Relations, 35(3), 299-333. Lester, James P. & Bowman, Ann O’M. (1989). Implementing environmental policy in a federal system: A test of the Sabatier-Mazmanian model. Polity, 21(4), 731-753. Lester, James P., Franke, James L., Bowman, Ann O’M, Kramer, & Kenneth W. (1983). Hazardous waste, politics, and public policy: A comparative state analysis. Western Political Quarterly 36(2), 257-285. Lowry, William R. (1992). Dimensions of federalism: State governments and pollution control Policies. Durham, NC: Duke University Press. Mazmanian, Daniel A. & Sabatier, Paul A. (1980) A multivariate model of public policymaking. American Journal of Political Science, 24(3), 439-468. 20
McFarlane, Deborah R. & Gruebel, Marilyn M. (2006, November). Public management and policy implementation: Intersection, subset, or neither? Paper presented at the Fall Conference of the Association of Public Policy Analysis and Management, Madison, WI. Miller, C. Chet & Cardinal, Lara B. (1994). Strategic planning and firm performance: A synthesis of more than two decades of research. Academy of Management Journal 37(6), 16491665. Moynihan, Donald P. & Pandey, Sanjay K. (2005). Testing how management matter in an era of government by performance management. Journal of Public Administration Research and Theory, 15(3), 421-439. Nicholson-Crotty, Sean & O’Toole, Laurence J. (2004). Public management and organizational performance: The case of law enforcement agencies. Journal of Public Administration Research and Theory, 14(1), 1-18. O’Leary, Rosemary & Yandle, Tracy (2000). Environmental management at the millennium: The use of environmental dispute resolution by state governments. Journal of Public Administration Research and Theory, 10(1), 137-155. O’Toole, Laurence J. (2000b). Research on policy implementation: Assessment and prospects. Journal of Public Administration Research and Theory, 10(2), 263-288. O’Toole, Laurence J. (2004). The theory-practice issue in policy implementation research. Public Administration, 82(2), 209-329. Pandey, Sanjay K., Coursey, David H., & Moynihan, Donald P. (2004). Management capacity and organizational performance: Can organizational culture trump bureaucratic red tape? Paper presented at Determinants of Performance in Public Organizations Seminar, May 6-8, Cardiff, Wales. Retrieved August 7, 2007 from http://www.clrgr.cf.ac.uk/events/pandey%20et%20al%202004.pdf Potoski, Matthew D. (2001). Clean air federalism: Do states race to the bottom? Public Administration Review, 6(3), 335-343. Potoski, Matthew & Woods, Neal D. (2000). Designing state clean air agencies: Administrative procedures and bureaucratic autonomy. Journal of Public Administration Research and Theory, 11(2), 203-221. Potoski, Matthew & Woods, Neal D. (2002). Dimensions of state environmental policies: Air pollution regulation in the United States. Policy Studies Journal, 30(2), 208-226. Rainey, Hal G. & Steinbauer, Paula (1999). Galloping elephants: Developing elements of a theory of effective government organizations. Journal of Public Administration Research and Theory, 9(1), 1-32.
21
Ringquist, Evan J. (1993). Environmental protection at the state level. New York, NY: M. E. Sharpe, Inc. Saetren, Harald (2005). Facts and myths about research in public policy implementation: Outof-Fashion, allegedly dead, but still very much alive and relevant. Policy Studies Journal, 33(4), 559-582. Selden, Sally Coleman & Sowa, Jessica E. (2004). Testing a multi-dimensional model of organizational performance: Prospects and problems. Journal of Public Administration Research and Theory, 14(3), 395-416. STAPPA (State and Territorial Air Pollution Program Administrators) & ALAPCO (Association of Local Air Pollution and Control Officers) (2002). Restrictions on the stringency of state and local air quality programs. U.S. Census Bureau (1999). Statistical Abstracts of the United States. Accessed on October 22, 2007 at http://www.census.gov.prod/www/abs/statab.htm. U.S. Census Bureau (2001). Statistical Abstracts of the United States. Accessed on October 22, 2007 at http://www.census.gov.prod/www/abs/statab.htm. U.S. Department of Energy (1999). State Energy Consumption, Price, and Expenditure Estimates (SEDS). Accessed on October 22, 2007 at http://www.eia.doe.gov/emeu/states/_seds.html. U.S. Department of Energy (2001). State Energy Consumption, Price, and Expenditure Estimates (SEDS). Accessed on October 22, 2007 at http://www.eia.doe.gov/emeu/states/_seds.html. U.S. Environmental Protection Agency (1999a). National Emissions Inventory. Emissions Inventory & Analysis Group; Air Quality Assessment Division, Office of Air Quality Planning and Standards. Research Triangle Park, North Carolina. U.S. Environmental Protection Agency (2001a). National Emissions Inventory. Emissions Inventory & Analysis Group, Air Quality Assessment Division, Office of Air Quality Planning and Standards. Research Triangle Park, North Carolina. U.S. Environmental Protection Agency (1999b). National Air Quality and Emissions Trend Report, 2001. Accessed on October 22, 2007 at http://www.epa.gov/airtrends/reports.html. U.S. Environmental Protection Agency (2001b). National Air Quality and Emissions Trend Report, 2001. Accessed on October 22, 2007 at http://www.epa.gov/airtrends/reports.html. U.S. Environmental Protection Agency (2007a). The Plain English Guide to the Clean Air Act. Accessed on October 22, 2007 at http://www.epa.gov/air/oaq_caa.html/peg/index.html. U.S. Environmental Protection Agency (2007b). Regions. Accessed on October 22, 2007 at http://www.epa.gov/epahome/locate2.htm.
22
Waterman, Richard W. & Rouse, Amelia (1999). The determinants of political control of the bureaucracy and the venues of influence. Journal of Public Administration Research and Theory 9(4), 527-569. Wood, Dan B. (1992). Modeling federal implementation as a system. American Political Science Review, 36(1), 40-67. Wolf, Patrick J. (1993). A case survey of bureaucratic effectiveness in U.S. cabinet agencies: Preliminary results. Journal of Public Administration Research and Theory, 3(2), 161-181. Yang, Kaifeng & Holzer, Marc (2006). The performance-trust link: Implications for performance measurement. Public Administration Review, 66(1), 114-126.
23
Tables and Figures Figure 1
Environmental Factors
Politics Policy Direction
Resources
Government Management Management Subsystems: 1) Financial, 2) Human Resource, 3) Information Technology, and 4) Capital
Government Performance
Integration: 1) Leadership 2) Information Use and 3) Resource Allocation Managing for Results
Source: Ingraham & Donahue, 2000a
Government Performance Model
24
Table 1 Government Performance Project Criteria for Assessing Quality of State Management Management System Financial
Quality Criteria/Principles Multi-year perspective on budgeting Mechanisms in place that preserve fiscal stability and health Sufficient financial information is available to policymakers, managers, and citizens Appropriate control maintained over financial operations Human Resources (HR) Conduct strategic analysis of present and future HR needs Able to obtain the employees it needs Able to maintain an appropriately skilled workforce Able to motivate employees to perform effectively in support of goals Civil structure in place that supports ability to achieve workforce goals Information Technology (IT) IT systems provide information that supports managers’ needs and strategic goals IT systems form a coherent structure Meaningful, multi-year planning is conducted Training is adequate Can evaluate and validate return on IT investments Can procure necessary IT systems in a timely manner IT systems support the ability to communicate with and serve citizens Capital Conducts thorough analysis of future needs Monitors and evaluates projects through implementation Conducts appropriate maintenance of assets Managing for Results Engages in results oriented strategic planning Develops indicators and evaluative data that can measure progress toward accomplishments and results Leaders and managers use data for policymaking, management and evaluation of progress Clearly communicates results to stakeholders Source: GPP Final Report, Appendix E
25
Figure 2 Distribution of GPP Grades (1999, 2001)
25
20
Frequency 15
10
5
Mean =2.6 Std. Dev. =0.572 N =100 0 1.0
1.5
2.0
2.5
3.0
3.5
4.0
Overall GPP Grade Point
26
Figure 3 Sabatier-Mazmanian Implementation Success Model Tractability of Problem 1. Availability of valid technology 2. Diversity of target group behavior 3. Extent of change required
Statute Structuring of Implementation 4. Clear and consistent objectives 5. Causal theory 6. Financial Resources 7. Integration among implementing institutions 8. Decision-rules of implementing agencies 9. Recruitment of implementing officials 10. Formal access by outsiders
Non-statutory Factors Affecting Implementation 11. Socioeconomic conditions and technology 12. Media attention and public support 13. Attitudes & resources of constituency groups 14. Support from sovereigns 15. Commitment & leadership from implementers
Government Performance Source: Lester & Bowman, 1989
Outputs
Impacts
27
Table 2 Air Pollution Inspection Regression Results GPM Model Inspections per Regulated Facility Independent Adjusted R2: Variables Key Statistics .034 Management Beta coefficient: -.04 Quality Grade 95% C.I. for Beta: -.02 to .13 (p-value) (.68) State Land Area Beta coefficient: .00 95% C.I. for Beta: .00 to.00 (p-value) (.02) Spending per Beta coefficient: -Regulated Facility 95% C.I. for Beta: -(p-value) -Agency Structure: Beta coefficient: -Super Agency** 95% C.I. for Beta: -(p-value) -USEPA Region 3* Beta coefficient: -95% C.I. for Beta: -(p-value) -Pollution Policy Beta coefficient: -Stringency 95% C.I. for Beta: -(p-value) -Government Beta coefficient: -Ideology 95% C.I. for Beta: -(p-value) -Citizen Ideology Beta coefficient: -95% C.I. for Beta: -(p-value) -*Other USEPA Region dummies were not significant **Other agency structures were not significant.
ISM Model Inspections per Regulated Facility Adjusted R2: .130 -.06 -.26, .14 (.53) .00 .00 to .00 (.14) .00 .00 to .00 (.12) -.06 -.19 to .06 (.31) .51 -.022 to 1.04 (.06) -.011 -.10 to .08 (.81) .00 -.01 to .01 (.931) -.005 -.015 to .006 (.367)
28
Table 3 Nitrogen Oxide Emissions Regression Results ISM Model Nitrogen Dioxide Emissions per Capita Adjusted R2: .455 -24.41 -39.28 to -9.55 (.002) .317 .17 to .47 (.000) -.00 -.01 to .00 (.06) -30.76 -62.78 to 1.26 (.06) 52.80 15.81 to 89.80 (.01)
Full Model Nitrogen Dioxide Emissions per Capita Adjusted R2: .478 -24.79 -38.34 to -11.24 (.00) .33 0.21 to 0.46 (.00) -.01 -0.01 to 0.00 (.00) -.13.86 -28.56 to 0.84 (.06) 54.35 29.38 to 79.32 (.00)
Region 4
38.66 2.79 to 74.53 (.04)
29.03 9.25 to 48.82 (.04)
Region 5
47.09 12.08 to 82.10 (.009)
39.21 15.84 to 62.59 (.00)
Region 7
42.58 4.88 to 85.83 (.029)
34.84 7.20 to 62.48 (.01)
Region 8
82.85 46.44 to 119.26 (.000) -36.82 -69.59 to -4.06 (.03) .018 -.39 to .43 (.93) .138 -.71 to .99 (.75)
82.85 51.53 to 95.09 (.000) -29.35 -54.61 to -4.09 (.02) -------
Independent Variables Management Quality Grade Petroleum Consumption per Capita Spending per Regulated Facility Agency Structure: Super Agency** USEPA Region 3*
Pollution Policy Stringency
Key Statistics Beta coefficient: 95% C.I. for Beta: (p-value) Beta coefficient: 95% C.I. for Beta: (p-value) Beta coefficient: 95% C.I. for Beta: (p-value) Beta coefficient: 95% C.I. for Beta: (p-value) Beta coefficient 95% C.I. for Beta (p-value)
GPM Model Nitrogen Dioxide Emissions per Capita Adjusted R2: .128 -6.43 -21.13 to 8.27 (.39) .244 .118, .369 (.00) ----------
Beta coefficient: 95% C.I. for Beta: (p-value) Government Beta coefficient: Ideology 95% C.I. for Beta: (p-value) Citizen Ideology Beta coefficient: 95% C.I. for Beta: (p-value) *Other USEPA Region dummies were not significant **Other agency structures were not significant
----------
29
Table 4 Models of Sulfur Dioxide Emissions Per Capita GPM Model 1 Sulfur Dioxide Independent Emissions per Capita Variables Key Statistics Adjusted R2: .71 Management Beta coefficient: -.01 Quality Grade 95% C.I. for Beta: -15.92 to -15.90 (p-value) (1.00) Coal Consumption Beta coefficient: .38 per Capita 95% C.I. for Beta: .33 to .43 (p-value) (.00) Value of Polluting Beta coefficient: 4.51 Industries per 95% C.I. for Beta: -.61 to 9.62 Capita (p-value) (.08) Spending per Beta coefficient: -Capita 95% C.I. for Beta: -(p-value) -Agency Structure: Beta coefficient: -Super Agency** 95% C.I. for Beta: -(p-value) -USEPA Region 8* Beta coefficient: -95% C.I. for Beta: -(p-value) -Pollution Policy Beta coefficient: -Stringency 95% C.I. for Beta: -(p-value) -Government Beta coefficient: -Ideology 95% C.I. for Beta: -(p-value) -Citizen Ideology Beta coefficient: -95% C.I. for Beta: -(p-value) -*Other USEPA Region dummies were not significant **Other agency structures were not significant
ISM Model 1 Sulfur Dioxide Emissions per Capita Adjusted R2: .78 -4.65 -22.67 to 13.38 (.61) .41 .35 to .47 (.00) 1.49 -5.43 to 8.42 (.67) .00 -.00 to .00 (.94) -25.91 -61.62 to 9.80 (.15) -36.05 -81.40 to 9.23 (.12) -15.72 -42.21 to 10.77 (.24) -.06 -.51 to .39 (.78) 1.12 .19 to 2.17 (.02)
Full Model Sulfur Dioxide Emissions per Capita Adjusted R2: .75 ---.44 .38 to .49 (.00) ----------52.96 -81.83 to -24.10 (.00) ------.50 -.05 to 1.05 .(07)
30
Table 5 Percent of Population Living in a SO2 Non-attainment Area in the State GPM Model % of Population in SO2 Independent Non-attainment Area Variables Key Statistics Adjusted R2: .073 Management Quality Beta coefficient: .03 Grade 95% C.I. for Beta: .01 to .05 (p-value) (.00) Coal Consumption Beta coefficient: .00 per Capita 95% C.I. for Beta: .00 to .00 (p-value) (.27) Value of Polluting Beta coefficient: -.01 Industries per Capita 95% C.I. for Beta: -.01 to .08 (p-value) (.727) Spending per Capita Beta coefficient: -95% C.I. for Beta: -(p-value) -Agency Structure: Beta coefficient: -Super Agency** 95% C.I. for Beta: -(p-value) -USEPA Region 8* Beta coefficient: -95% C.I. for Beta: -(p-value) -Pollution Policy Beta coefficient: -Stringency 95% C.I. for Beta: -(p-value) -Government Ideology Beta coefficient: -95% C.I. for Beta: -(p-value) -Citizen Ideology Beta coefficient: -95% C.I. for Beta: -(p-value) -*Other USEPA Region dummies were not significant **Other agency structures were not significant
ISM Model % of Population in SO2 Non-attainment Area Adjusted R2: 0.189 .04 .02 to .07 (.00) .00 .00 to .00 (.91) .00 -.01 to .01 (.55) .00 .00 to .00 (.66) -.04 -.09 to .02 (.16) .07 .01 to .14 (.03) -.06 -.09 to -.018 (.01) .00 -.00 to .00 (.57) .00 -.00 to .00 (.60)
Full Model % of Population in SO2 Non-attainment Area Adjusted R2: .244 .03 .02 to.05 (.00) ----------.03 -.05 to -.00 (.01) .07 .03 to .10 (.00) -.05 -.08 to -.02 (.00) -------
31