Alsabbagh et al. BMC Medical Research Methodology (2017) 17:66 DOI 10.1186/s12874-017-0339-z
RESEARCH ARTICLE
Open Access
Does the association between adherence to statin medications and mortality depend on measurement approach? A retrospective cohort study Mhd. Wasem Alsabbagh1* , Dean Eurich2, Lisa M. Lix3, Thomas W. Wilson4 and David F. Blackburn5
Abstract Background: The aim of this study was to examine the relationship between mortality and statin adherence using two different approaches to adherence measurement (summary versus repeated-measures). Methods: A retrospective cohort study was conducted using administrative data from Saskatchewan, Canada between 1994 and 2008. Eligible individuals received a prescription for a statin following hospitalization for acute coronary syndrome (ACS). Adherence was measured using proportion of days covered (PDC) expressed either as: 1) a fixed summary measure, or 2) as a repeatedly measured covariate. Multivariable Cox-proportional hazards models were used to estimate the association between adherence and mortality. Results: Among 9,051 individuals, optimal adherence (≥80%) modeled with a fixed summary measure was not associated with mortality benefits (adjusted HR 0.97, 95% CI 0.86 to 1.09, p = 0.60). In contrast, repeated-measures approach resulted in a significant 25% reduction in the risk of death (adjusted HR 0.75, 95% CI 0.67 to 0.85, p < 0.01). Conclusions: Unlike the summary measure, the repeated measures approach produces a significant reduction of allcause mortality with optimal adherence. This effect may be a result of the repeated measures approach being more sensitive, or more prone to survival bias. Our findings clearly demonstrate the need to undertake (and report) multiple approaches when assessing the benefits of medication adherence. Keywords: Compliance/adherence, Mortality, Treatment, Lipids and cholesterol, Secondary prevention
Background Observational studies using health-administrative databases have reported low mortality rates among individuals exhibiting high adherence to statin medications (HMG Co-A reductase inhibitors) [1]. However, these studies have produced highly variable estimates of benefit. Depending on the study, individuals exhibiting high adherence have been associated with 20%, [2] 50%, [3, 4] or even 81% [5] lower risks of death. An important source of variability may be the approach used to measure adherence, even if the adherence data source is the same. * Correspondence:
[email protected] 1 School of Pharmacy, University of Waterloo, 10A Victoria St. S., Kitchener, ON N2G 1C5, Canada Full list of author information is available at the end of the article
In studies using electronic refill databases, adherence is often measured by the ‘medication possession ratio’ (MPR) or the ‘proportion of days covered’ (PDC). This approach estimates the percentage of days during a defined observation period where medication was available for consumption based on the total quantity obtained from pharmacy refills [6]. In descriptive studies, adherence is typically expressed as a single measure summarizing the entire observation period often lasting 1 year or more [7–9]. Although the summary measure of adherence offers a simple and straightforward approach to represent the entire period of follow-up, it does not account for the possibility that adherence may change during this period. Medication adherence can also be measured repeatedly using defined intervals within a period of follow-up
© The Author(s). 2017 Open Access This article is distributed under the terms of the Creative Commons Attribution 4.0 International License (http://creativecommons.org/licenses/by/4.0/), which permits unrestricted use, distribution, and reproduction in any medium, provided you give appropriate credit to the original author(s) and the source, provide a link to the Creative Commons license, and indicate if changes were made. The Creative Commons Public Domain Dedication waiver (http://creativecommons.org/publicdomain/zero/1.0/) applies to the data made available in this article, unless otherwise stated.
Alsabbagh et al. BMC Medical Research Methodology (2017) 17:66
and treated as a time-dependent variable [10, 11]. This measurement method may have advantages over the summary measure because it is more sensitive to changes in adherence. For example, a summary adherence measure of 58% calculated over a 1-year period could actually reflect an individual with 16% adherence during the first 6 months and 100% adherence in the last 6 months of observation. It has been suggested that the repeated-measures approach is superior to the summary approach for identifying associations between adherence and mortality [11–13]. However, we can find no empirical data or theoretical paradigm to support this claim. No studies have investigated the impact of measurement strategy on the estimates of benefit of statin adherence. Thus, our purpose was to compare the estimated impact of statin adherence on mortality using two measurement approaches, a fixed summary measure versus repeatedmeasures, for a cohort of individuals with acute coronary syndrome (ACS).
Methods Data source
Administrative data maintained by the Saskatchewan Ministry of Health were used for this study. Saskatchewan Ministry of Health databases contain comprehensive data and have been used previously to produce high quality pharmacoepidemiological studies [14–18]. Specifically, we used information from the population registry, prescription drug file (pharmacy dispensations), physician claims, and hospital services databases. The Saskatchewan Ministry of Health data covers almost 99% of the province’s residents for both physician and hospital services. The only exceptions are federal prisons inmates, members of the armed forces, and the Royal Canadian Mounted Police, who are recipients of the federal government’s health benefits. On the other hand, the prescription drug database captures medication dispensations for 90% of the provincial population; it excludes individuals who receive federal prescription coverage such as the First Nations (aboriginal) population. Information on medications available “over-the-counter” or excluded from the provincial drug formulary were not available in this study. Cohort
The cohort included individuals at least 30 years of age who received at least one dispensation for a statin medication within 90 days [2, 19] of hospital discharge and for whom the responsible/primary diagnosis in the hospital record was ACS. This included myocardial infarction (MI) and unstable angina (UA). All individuals who met the cohort inclusion criteria between January 1st, 1994 and December 31st, 2008 were retained. Individuals were required to have continuous beneficiary status for 1825 days (i.e., 5 years) before the index hospitalization.
Page 2 of 11
Additionally, in order to offer the opportunity to exhibit adherence or non-adherence behaviour, individuals had to survive and maintain provincial beneficiary status for at least 102 days after their first statin dispensation. Individuals were excluded if they underwent a revascularization procedure without a diagnosis of MI or UA, could not be followed for at least 102 days, or received any statin medication within 365 days prior to the index hospitalization [20]. The codes used to identify MI and UA conditions (Appendix 1) were shown to have positive predictive, sensitivity, and specificity estimates of 85 to 98% [21–26]. For individuals with several eligible hospitalizations, the earliest hospital discharge date for ACS was deemed the index date. Adherence
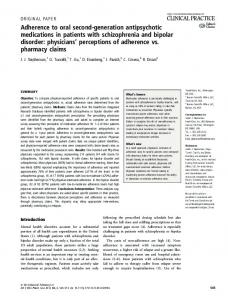
Adherence was measured from the first statin dispensation date until death, provincial health coverage termination, or end of the study period (i.e., December 31, 2008). The PDC method was used to calculate adherence [27–29] with an adjustment to prevent overestimation. Specifically, each statin dispensation was assigned a ‘completion date’ corresponding to the number of medication doses supplied [30]. If a subsequent dispensation was obtained early, the new supply was not applied until the previous ‘completion date’ plus 1 day. Also, any excess supply of medication extending beyond the last follow-up day was removed from the calculation (Fig. 1) [30]. Similar to other studies, 80% level of adherence or higher was considered optimal adherence [31, 32] and switching between statins was allowed. Additionally, we removed any days of hospitalization during the observation period from PDC calculation because medications dispensed to inpatients are not included in the prescription drug database [33]. The assessment of adherence was applied in two ways. In method “A”, a single summary measure of adherence was calculated between the date of the first dispensation and the date of death, provincial health coverage termination, or end of the study period (December 31, 2008). In method “B”, the same period of follow-up was divided into 3-month intervals (i.e., 102 days) where adherence was measured in each. Unused supplies from a previous interval were applied to the subsequent interval to prevent underestimation. The 102 days interval was chosen because, in Saskatchewan, prescriptions are usually filled in 1 month supply quantity (34 days) [34]. Analysis procedure
The association between statin adherence and mortality was described using Kaplan-Meier estimator and was assessed using a time-to-event analysis with multivariable Cox proportional-hazard regression models. The outcome was time to death, starting 102 days following
Alsabbagh et al. BMC Medical Research Methodology (2017) 17:66
Page 3 of 11
Fig. 1 Adjustment of the adherence measure (proportion of days covered) to prevent overestimation from early refills or refills extending beyond measurement period represented on days’ time scale (shadowed panels) as original data a and data with adjusted date(s) and quantities b
the first statin dispensation. The model covariates included demographic, condition-related, therapy-related, patient-related, and health-system-related variables, as categorical variables (Appendix 2, Appendix 3 and Appendix 4), in addition to dichotomous adherence variable (i.e., PDC ≥80% versus PDC < 80%). For Method A, the summary measure of adherence was entered in the model as a fixed covariate (i.e. a covariate that does not differ in value over time), whereas for Method B, adherence was included in the model as a time-dependent repeated-measure covariate (i.e. a covariate that differs in value over time) assessed every 102 days. We estimated the adjusted hazard ratios (HRs) with 95% confidence intervals (95% CIs) for adherent individuals (i.e. PDC ≥ 80%) compared with non-adherent individuals (i.e., PDC < 80%). The proportional hazards assumption was assessed visually using the log cumulative hazard (the “log-log”) plot and Schoenfeld residuals versus observed event time’s plot [35]. Multicollinearity amongst the non-adherence variables was examined by calculating the variance inflation factor (VIF); values greater than 10 were interpreted as representing substantial multicollinearity [36]. Baseline variables that demonstrated evidence of multicollinearity were excluded from the model. In a sensitivity analysis, adherence was re-classified into three categories (instead of two): PDC 20%, 21–79%, and ≥80% to assess whether estimates of benefit were substantially affected. We used SAS 9.3 software (SAS Institute Inc., Cary, NC, USA) to perform all analyses.
Results From 43,118 individuals who were hospitalized and had an ACS diagnosis and/or a coronary revascularization procedure in Saskatchewan between January 1st, 1994 and December 31st, 2008, a total of 9,051 individuals (21.0%) met all inclusion criteria (Fig. 2). Among all individuals in the cohort, 69.2% (n = 6,260) were male and the mean age was 64.8 years (median = 66.0, standard deviation [SD] = 12.3). More than half of individuals (58.5%; n = 5,292) received a revascularization procedure during their ACS hospitalization. Additionally, roughly one third (36.7%, n = 3,325) had a diagnosis of hypertension in the year prior to the index date, and 13.6% (n = 1,232) had a diabetes diagnosis (Table 1). The mean follow-up time was 1,721 days (median 1,525.0, SD = 1,138.4) or 4.7 years. The mean PDC calculated over the entire follow-up period was 70.6% (median = 84.0%, SD = 31.9%), and the percentage of individuals achieving optimal adherence (i.e. ≥80%) was 54.6% (n = 4,939). The percentage of adherent individuals increased substantially over the study period from 40.7% in 1994 to 77.8% in 2008. Adherence categorization by the fixed baseline summary measure was generally concordant with the repeated measures approach in the last completed measurement interval. The adherence category matched on both measures in 76.7% of individuals (median 80.2%, SD = 15.4%) However, the concordance between the two measures declined over time (Fig. 3). Nonconcordance was most commonly observed as non-
Alsabbagh et al. BMC Medical Research Methodology (2017) 17:66
Page 4 of 11
Fig. 2 Flow chart for cohort selection
adherence by the fixed summary measure and optimal adherence using the repeated-measures approach. This may reflect the case when an individual starts therapy by being non-adherent early in the treatment period, and then becomes adherent afterward. Essentially, the fixed summary measure penalizes individuals for previous periods of non-adherence whereas the repeated measures approach does not consider past adherence patterns. In contrast, the percentage of cases of optimal adherence by the fixed summary measure but poor adherence by the repeated-measures was relatively infrequent and remained stable over time (Fig. 3). Using the fixed-summary measure of adherence, death occurred in 12.3% (n = 606) of adherent individuals (i.e.PDC ≥80%) compared to 14.6% (n = 600) of nonadherent individuals. This difference was not associated with a lower risk of death in the time-to-event analysis (Fig. 4) (crude HR 1.07, 95% CI 0.96 to 1.20, p = 0.25;
adjusted HR 0.97, 95% CI 0.86 to 1.09, p = 0.60). Similar results were obtained when non-adherence was categorized as < 20% (i.e., rather than < 80%) in a sensitivity analysis (crude HR 0.91, 95% CI 0.77 to 1.08; p = 0.28; adjusted HR 0.96, 95% CI 0.80 to 1.14). This effect was identical in the 1899 individuals who entered the cohort prior to 2001 (crude HR 0.95, 95% CI 0.78 to 1.16; p = 0.62; adjusted HR 0.93, 95% CI 0.75 to 1.14, p = 0.48), and the 7,152 individuals who entered the cohort on 2001 and after (crude HR 1.09, 95% CI 0.95to 1.26; p = 0.23; adjusted HR 1.01, 95% CI 0.87 to 1.17, p = 0.91). In contrast, optimal adherence measured as a timedependent variable was clearly associated with a lower risk for death (Fig. 4) (crude HR 0.80, 95% CI 0.71 to 0.89, p < 0.01; adjusted HR 0.75, 95% CI 0.67 to 0.85, p < 0.01). Similar results were obtained when nonadherence was categorized as