International Journal of Computational Bioinformatics and In Silico Modeling Vol. 3, No. 4 (2014): 412-422 Research Article Open Access
ISSN: 2320-0634
Dof1 transcription factor interacts with only specific regions of the promoters driving the expression of genes involved in carbon and nitrogen metabolism Alok Kumar Gupta1,2, Vikram Singh Gaur1, Rajesh Kumar Pathak1, Sanjay Gupta3 and Anil Kumar1,* 1 Department
of Molecular Biology & Genetic Engineering, College of Basic Sciences & Humanities, G. B. Pant University of Agriculture & Technology, Pantnagar-263145 (Uttarakhand), India 2 Uttarakhand Technical University, Dehradun-248007 (Uttarakhand), India 3 Department of Biotechnology, Sardar Bhagwan Singh Post Graduate Institute of Biomedical Science & Research, Dehradun248161 (Uttarakhand), India
*Corresponding author: Anil Kumar; e-mail:
[email protected] Received: 18 May 2014
Accepted: 12 June 2014
Online: 01 July 2014
ABSTRACT The Dof1 protein is a member of the Dof transcription factor gene family in plants involved in the regulation of specific genes involved in C/N metabolism or in other words the genes influencing nitrogen use efficiency in plants. Dof1 proteins recognize the sequence 5’-AAAG-3’ present in the promoter regions of genes controlled by them. The present study was focussed to understand whether Dof1 simultaneously regulates all the genes of the target family of genes and whether number of Dof binding sites plays any role in driving the expression of its target genes. Correlation studies carried out between the Dof binding sites in the promoter region and the expression levels of genes specifically regulated by Dof1 TF in viz. rice and Arabidopsis and genes involved in glycolysis, TCA cycle and N metabolism. The analysis revealed a non-significant effect of number of Dof binding sites on gene the expression levels. Further, In silico interaction studies between Dof1 protein and its target promoters revealed that Dof1 protein specifically interacts with “(A\T\C) AAAG” sequence and does not interact with all the “AAAG” motifs present in the promoter. The results indicate that (a) number of Dof binding sites has no influence on the expression levels of target genes and (b) Probably Dof1 alone does not regulate the expression of genes involved in C/N metabolism.
Keywords: Dof transcription factor, nitrogen use efficiency, gene expression, molecular modeling, docking INTRODUCTION The Dof (DNA-binding with one finger) family of transcription factors are plant specific transcription factors that are defined by the presence of a characteristic C2C2-type zinc finger DNA-binding domain. The first Dof transcription factor was isolated from maize by Yanagisava, 1991 [1] and since then many Dof transcription factor genes from different plants have been isolated and functionally characterized such as their involvement in regulating the expression of genes associated with carbon assimilation [2,3], phytochrome signalling [4,5], seed maturation and germination [6-9], the auxin response http://bioinfo.aizeonpublishers.net/content/2014/4/bioinfo412-422.pdf
[10], the salicylic acid response [11] and the function of the stomata guard cells [12], in photoperiodic flowering and biosynthesis of glucosinolates [13,14] and recently in floral organ abscission [15], in secondary wall deposition and carbon partitioning in poplar [16], as a transcriptional repressor in the nutrient condition-dependent growth [17] and germination in non-after-ripened seeds [18]. Since the above listed examples are plant specific phenomenon it was suggested that the members of Dof transcription factor family are involved in regulating the processes that are specific to plant only.
412
Alok Kumar Gupta et al. / Int J Comput Bioinfo In Silico Model. 2014, 3(4): 412-422
All known Dof transcription factors have a single copy of the highly conserved DNA binding Dof domain, which is located within the N-terminal regions of the respective proteins in general and through binding site experiments it has been revealed that the DNA binding domains of all Dof proteins specifically bind to the 5’AAAG-3’ sequence motif present in the promoters of the genes regulated by Dof transcription factors [18]. The highly divergent C-terminal region of the Dof protein interacts with the RNA polymerase to initiate or repress transcription [20-22]. Furthermore, some Dof domains have been shown to be involved not only in DNA recognition but also in specific protein–protein interactions [9, 20, 23 and 24]. Hence, the Dof transcription factors show versatility and, regardless of their very similar DNA recognition properties, are thought to be capable of regulating particular gene promoters via specific protein–protein interactions [25, 26]. Contrastingly, some members of the Dof transcription factors have a remarkable property that has over the years attracted considerable attention. Specific members of the Dof transcription gene family commonly known as Dof1 have been shown to act like master regulators by simultaneously regulating the genes involved in carbon (PEPC, PK, CyPPDK) and nitrogen metabolism (NR, GS, GOGAT etc). This important finding led to the generation of transgenic Arabidopsis lines carrying over expressed maize Dof1 which showed improved performance under low nitrogen conditions. In the transgenic Arabidopsis the over expressed Dof1 binds to the motif 5’-AAAG-3’ present in the promoter region of the genes and up regulates the expression. However, it is worth mentioning here that since a gene family constitutes many genes and Dof binding sites might vary from gene to gene it is important to investigate whether Dof1 exerts similar regulation in all the genes it regulates. Furthermore, it is also necessary to investigate how does the Dof transcription factors identify and bind to its target DNA binding site 5’-AAAG-3’ because such a small motif could not only be present in the promoter regions but may also present in the non promoter regions. Also, it is necessary to investigate whether the number of Dof binding motifs in the promoters region of genes regulated by Dof transcription factors play any role in directing the level of expression. Such an investigation might help to identify the key genes that are dominantly involved in the process of carbon and nitrogen metabolism and therefore would provide a handle to devise better strategies to achieve higher nitrogen use efficiency in crops under low nitrogen inputs. Presented here is an investigation that is focussed to answer these important questions by first correlating the number of Dof binding sites in the promoter regions of genes regulated by Dof transcription factor to their expression levels in different tissues and then identifying potential Dof binding regions in the promoter region generating the protein structure of Dof protein followed by various
http://bioinfo.aizeonpublishers.net/content/2014/4/bioinfo412-422.pdf
docking studies with promoter regions to identify the potential Dof binding site.
MATERIALS AND METHODS Retrieval of CDS of genes involved in C/N metabolism, generation of promoter sequence datasets, identification of number of Dof binding sites and expression studies CDS sequences of Rice and Arabidopsis genes involved in carbon and nitrogen metabolism were downloaded from the TAIR (www.arabidopsis.org), TIGR (http://rice.plantbiology.msu.edu), Rice MPSS and Arabidopsis MPSS databases. Using BLASTn program of NCBI, individual CDS sequences were used as blast queries to obtain respective 1000bp upstream sequences. Using the online motif finding tool “PLACE” individual promoter sequences were then used as query sequences to find the number of Dof binding sites. Using rice and Arabidopsis MPSS database the expression levels of each gene in different tissues (for Rice NL, NYL, NR, NYR, PSC, PSY, PSN, PSI, PSL, for Arabidopsis ROS LES and SIS ) was recorded and the data was stored in a separate MS excel file for further analysis. Heat maps displaying the expressions of rice and Arabidopsis gene involved in C/N metabolism was generated using Matlab-2007. Statistical Analysis of the generated data To find whether the number of Dof binding in the promoter region of individual genes influences their level of expression, a correlation study was carried out with the following hypothesis. H0: Number of Dof binding sites in the promoter region of Dof1 regulated genes has no relation to their expression levels/patterns. Alternative Hypothesis H1: Number of Dof binding sites plays a direct and quantitative role in the expression levels of Dof1 regulated genes Significance of the correlation coefficient “r” was checked by t-test.
Modelling of Dof1 protein structure Protein sequences of Dof1 transcription factors from rice, maize, barley, sorghum and wheat were retrieved from NCBI and were submitted to the LOMETS: Local Meta-Threading-Server (http://zhanglab.ccmb.med.um ich.edu/LOMETS) to predict the three dimensional structure of Dof1 transcription factor. For each protein submitted for structure prediction, 10 structures were predicted. Based on C-score (confidence score) one model were chosen from each cereal.
413
Alok Kumar Gupta et al. / Int J Comput Bioinfo In Silico Model. 2014, 3(4): 412-422
Energy minimization The chosen models were then subjected to energy minimization by Swiss PDB Viewer software (http://www.expasy.org/spdbv) to validate the protein structure using the steepest descent method. Number of steps for steepest descent minimization was taken as 100. Forces acting on each atom of selected groups were minimized by iterative force field calculations followed by structural adjustments. Evaluation of structural model Stability of the protein model were validated by the structural Analysis and Verification Server (http://nihserver.mbi.ucla.edu/SAVES), which has inbuilt tools such as PROCHECK, WHAT_CHEK, ERRAT, VERIFY_3D, and PROVE. DNA structure modelling of Arabidopsis PEPC, PK, GS2 and NIA2 genes promoters The coding DNA sequences of Arabidopsis PEPC, PK, GS2 and NIA2 genes were retrieved from TAIR database and were used as query sequences to perform BLASTn searches to extract the 1000bp upstream region from transcription start site. Due to the limitation of docking server and nucleotide size restriction of the DNA modelling tool, the 1000 base pair upstream region was fragmented into 200 base pair each and single stranded DNA structure of these promoters was modelled by the make-na server (http://structure.usc.edu/make-na/server.html). Molecular docking Dof domain of all protein structures were docked with the Zinc atom by the AutoDockVina (http://vina.scripps.edu). The coordinated structure of Dof1 protein of Maize with ZINC atom were docked with each of the modelled DNA fragment by Hex (http://www.hex.loria.fr), to identify the probable interacting DNA binding sites. Pymol (http://www.pymol.org) was used for visualization and analysis of results.
http://bioinfo.aizeonpublishers.net/content/2014/4/bioinfo412-422.pdf
RESULTS AND DISCUSSION Number of Dof binding sites and expression profiles of genes involved in C/N metabolism of rice and Arabidopsis A total of 26 genes and their family members of rice and Arabidopsis involved in C/N metabolism viz., genes involved in (a) glycolysis pathway (b) TCA cycle and (c) nitrogen uptake and assimilation were identified and CDS sequences of the members of the gene families were downloaded from TAIR and TIGR database. The number of members of each gene family in rice and Arabidopsis is given in Figure 1 and 2. Over all it was observed that there are more number of members in each rice gene family compared to the corresponding gene family of Arabidopsis. It was also observed that in both rice and Arabidopsis, most of genes of a gene family either did not express or had a very low level of expression in the tissues studied. However, at least member of (GS) family in both rice and Arabidopsis was found to express dominantly in all the tissues under study. Except the glycolysis, average expression of rice genes involved in TCA cycle, C/N metabolism was significantly higher than that of Arabidopsis. Further, the average expression of genes regulated by Dof1 was also significantly higher in rice than that of Arabidopsis (Fig. 3). Expression levels of individual genes of rice and Arabidopsis determined using Rice and Arabidopsis MPSS databases is shown in the heat map (Fig. 4 & 5). Identification of the number of Dof binding sites in promoter region of rice and Arabidopsis genes involved in C/N metabolism revealed that the Dof binding sites in the promoter region is highly variable in the promoters of genes involved in C/N metabolism. Average number of Dof binding sites in the promoter region of Arabidopsis genes involved in glycolysis, TCA cycle, Nitrogen metabolism and C metabolism was higher than that of rice (Fig.6). Similarly, the number of Dof binding sites in the promoter of Arabidopsis genes reported to be regulated by Dof1 was higher than that of rice (Fig. 7).
414
Alok Kumar Gupta et al. / Int J Comput Bioinfo In Silico Model. 2014, 3(4): 412-422
Figure 1. a-Rice glycolysis genes family and its members number, b-Rice TCA cycle genes and its members numbers, c-Rice carbon metabolism genes and its member numbers and d- Rice nitrogen metabolism gene family and its members number.
Figure 2. a-Arabidopsis glycolysis genes family and its members number, b-Arabidopsis TCA cycle genes and its members numbers, c-Arabidopsis carbon metabolism genes and its member numbers and d- Arabidopsis nitrogen metabolism gene family and its members number. http://bioinfo.aizeonpublishers.net/content/2014/4/bioinfo412-422.pdf
415
Alok Kumar Gupta et al. / Int J Comput Bioinfo In Silico Model. 2014, 3(4): 412-422
Figure 3. The average level of expression of genes regulated by Dof1 in rice and Arabidopsis thaliana.
Figure 4. Heat map showing expression patterns of A. Arabidopsis glycolysis genes, B- Arabidopsis TCA genes, C-Arabidopsis nitrogen metabolism genes, D- Arabidopsis carbon metabolism genes.
http://bioinfo.aizeonpublishers.net/content/2014/4/bioinfo412-422.pdf
416
Alok Kumar Gupta et al. / Int J Comput Bioinfo In Silico Model. 2014, 3(4): 412-422
Figure 5. Heat map showing expression patterns of A. Rice Glycolysis genes, B- Rice TCA genes, C-Rice nitrogen metabolism genes, D-Rice carbon metabolism genes. (a-NL, b-NYL, c-NR, d-NYR, e-PSC, f-PSY, g-PSN, h-PSI, and i-PSL)
Figure 6. Average number of Dof binding sites in the promoter region of Arabidopsis and rice genes involved in glycolysis, TCA cycle, Nitrogen and C metabolism.
http://bioinfo.aizeonpublishers.net/content/2014/4/bioinfo412-422.pdf
Figure 7. The number of Dof binding sites in the promoter of Arabidopsis and rice genes regulated by Dof1 transcription factor. 417
Alok Kumar Gupta et al. / Int J Comput Bioinfo In Silico Model. 2014, 3(4): 412-422
Correlation analysis was performed between the number of Dof binding sites in the promoter region of members of each gene family and their expression levels in the tissues. Significance of correlation coefficient was tested at 5% confidence level. It was found that for most of the genes the correlation coefficient “r” had both negative and positive values. However, for most of the gene family the value of “r” was not significant. Test of correlation coefficient for gene families which had less than three members could not be performed because the “t” value could not be calculated.
In silico Dof1 protein structure prediction, DNA structure modelling and molecular docking studies The structure of each Dof1 proteins of five different cereals (Barley, Maize, Rice, Sorghum, wheat) was modelled by LOMET server [27]. Based on maximum Cscore the most appropriate predicted structures were chosen for each protein. The chosen models from LOMET server were then subjected to energy minimization using Swiss-PDB Viewer software for stabilizing their stereo-chemical properties, SAVES server were used to validate the results.
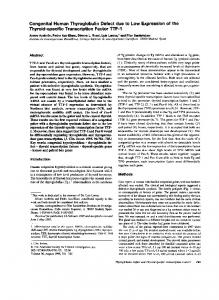
Figure 8. 3D Structure of Dof1 Transcription factor from (A) Zea mays, (B) Oryza sativa, (C) Triticum aestivum, (D) Sorghum bicolor, (E) Hordeum vulgare, modeled by LOMET server and (F) Structure of Zn++ .
Table 1. Coordination of Zn++ atom with Dof1 TF through molecular docking studies by AutoDock vina S.No. 1 2 3 4 5
Zn++ with Dof TF Zea mays Oryza sativa Triticum aestivum Hordeum vulgare Sorghum bicolor
Energy (Kcal/mol) -1.4 -1.4 -1.3 -1.3 -1.1
The modelled structures of each Dof1 transcription factor were coordinated with ZINC atom through molecular docking studies by AutoDock vina (Table 1). ZINC atom coordinated with Zea mays Dof1 transcription factor with energy value -1.4 Kcal/mol (fig 2). Other Dof1 transcription factor from Oryza sativa, Triticum aestivum, Hordeum vulgare and Sorghum bicolar were coordinated with ZINC atom with energy value -1.4, -1.3, -1.3 and -1.1 Kcal/mol respectively (Fig. 3-6).
http://bioinfo.aizeonpublishers.net/content/2014/4/bioinfo412-422.pdf
Figure 9. Docked Structure Dof1 Transcription factor of Zea mays with Zn++ atom.
418
Alok Kumar Gupta et al. / Int J Comput Bioinfo In Silico Model. 2014, 3(4): 412-422
Figure 10. Docked Structure Dof1 Transcription factor of Oryza sativa with Zn++ atom.
1000bp promoters region of four genes of Arabdobsis viz., phosphoenolpyruvate carboxylase (PEPC), pyruvate kinase (PK), glutamate synthase (GS2) and nitrate reductase (NIA2) were taken to identify the most probable binding site. Due to the limitation of docking server, 1000 bp promoters were fragmented into 200 base pair each and single stranded and double stranded DNA structure of these promoters was modelled. These modeled DNA were then docked with Dof1 of Maize to identify the probable AAAG binding site (Fig 14). We have found that Dof1 TF showed to interacted by greatest affinity with double stranded third fragment of GS2 (-824.5 Kcal/mol) and PEPC (847.1 Kcal/mol), First fragment of NIA2 (-841.0 Kcal/mol) and third fragment of PK (-901.6 Kcal/mol); It was also interacted with single stranded second fragment of GS2 (-705.1 Kcal/mol) and PEPC (-747.5 Kcal/mol), fourth fragment of NIA2 (-745.6 Kcal/mol and third fragment of PK (-737.4 Kcal/mol) with highest affinity (Table 2). DNA-protein interaction revealed that the Maize Dof1 protein recognizes the (A\T\C) AAAG motif and it was also observed that concentration of Adenine is high in flanking sequences of AAAG which is interacting with Dof1 transcription factor.
Figure 11. Docked Structure Dof1 Transcription factor of Triticum aestivum with Zn++ atom.
Figure 12. Docked Structure Dof1 Transcription factor of Sorghum bicolor with Zn++ atom.
Figure 13. Docked Structure Dof1 Transcription factor of Hordeum vulgare with Zn++ atom.
http://bioinfo.aizeonpublishers.net/content/2014/4/bioinfo412-422.pdf
Table 2. Molecular docking studies of modeled double and single stranded DNA with Dof1 TF of Maize by Hex. S. No.
Gene promoter
1 2 3 4 5 6 7 8 9 10 11 12 13 14 15 16 17 18 19 20
GS2 GS2 GS2 GS2 GS2 PEPC PEPC PEPC PEPC PEPC NIA2 NIA2 NIA2 NIA2 NIA2 PK PK PK PK PK
Double stranded: Energy (Kcal/mol) -806.9 -756.1 -824.5 -726.0 -739.1 -814.0 -844.6 -847.1 -790.4 -788.0 -841.0 -821.0 -835.9 -825.4 -821.2 -802.7 -846.2 -901.6 -846.7 -830.5
Single stranded: Energy (Kcal/mol) -690.7 -705.1 -687.9 -682.8 642.0 -690.0 -747.5 -671.9 -697.2 -621.8 -695.6 -711.3 -646.5 -745.6 -686.4 -671.7 -703.2 -737.4 -701.1 -718.1
Increasing the nitrogen use efficiency of cereal crops is a challenge for modern agriculture as the NUE of most cereals crops is less than 50%. This indicates that much of the nitrogen added to the crops in form of nitrogenous fertilizer is only partially absorbed and goes waste. The unused nitrogenous fertilizer finds its way into the environment and now it has been realized that it is one of the major pollutant of ground water and the cause of a widely known environmental problem “eutrophication”. Therefore, poor nitrogen use efficiency of cereals crops not only damages the environment but also substantially increase the cost of production. The use of nitrogenous fertilizers to 419
Alok Kumar Gupta et al. / Int J Comput Bioinfo In Silico Model. 2014, 3(4): 412-422
increase the crop production so as to keep pace for feeding ever growing world population cannot be
avoided. Therefore, it is imperative to design newer high yielding crops that require less nitrogen.
Figure 14. Docked structure of Dof1(red) with Double stranded (a,b,c,d) and single stranded (e,f,g,h) of GS2, PEPC, NIA2 and PK.
Nitrogen use efficiency is complex trait controlled by the concerted action of genes involved in nitrogen uptake, nitrogen assimilation [28] along with the genes involved in carbon metabolism such as the genes involved in glycolysis and TCA cycle. [29]. Since, nitrogen metabolism involves many genes, manipulating all the genes or some major genes to achieve high nitrogen use efficiency are neither practical nor possible. Although, there have been many endeavours which reports over expressing candidate genes through transgenic technology, success to increase NUE have been limited. However, among these studies, genetic engineering with Dof1 transcription factor to increase nitrogen use efficiency have shown some promising results. overexpressed the maize Dof1 in Arabidopsis and reported that the Arabidopsis plants survived well under limited nitrogen conditions as compared to the controls [29]. It was explained that, since the genes involved in C/N http://bioinfo.aizeonpublishers.net/content/2014/4/bioinfo412-422.pdf
metabolism are simultaneously regulated by a single Dof transcription factor gene, over expressing Dof1 would also increase the expression of genes and the activity of their enzymes involved in C/N metabolism and subsequently increasing nitrogen use efficiency under low nitrogen conditions [29]. Since, genes involved in C/N metabolism belong to multigene families, it is however not clear whether the Dof1 regulates all the members of the target gene family and further, how Dof1 exerts its regulatory properties in regulating its target genes involved in C/N metabolism. In order to understand the role of number of Dof binding sites in the promoter region of all the genes involved in C/N metabolism and the genes regulated by Dof1, present study was carried out it will further elucidate their role in the expression of these genes and identification in of potential Dof binding site deriving the Dof1 regulated gene expression in different tissues.
420
Alok Kumar Gupta et al. / Int J Comput Bioinfo In Silico Model. 2014, 3(4): 412-422
Relationship of Dof binding sites in promoter region and expression levels The Dof1 transcription factor recognises the DNA motif “5’-AAAG-3’’ in the promoter region of genes under its regulation [30]. This motif is present in multiple copies in the promoter region of genes such as GS, GOGAT, NR, PPDK, PEPC, PK and ICDH which are reported to be regulated by Dof1 transcription factor [30]. Since, there are many members in these gene family, a correlation study was undertaken to understand whether the number of Dof binding sites in the promoter region of these genes have a role in driving their expression levels in different tissues. Correlation analysis revealed that the correlation coefficient varied from negative to positive according to the gene family indicating a negative and positive effect of Dof binding sites on expression levels. However, statistically, the value of correlation coefficient “r” was non-significant indicating that although the value of “r” is negative or positive, the number of Dof binding sites in the promoter region has no effect on the gene expression patterns. This also indicates that Dof1 regulates only some major genes of each gene family as reported and might not simultaneously regulate all the members of GS, GOGAT, NR, ICDH, PPDK, PEPC and PK gene families. Since, this observation is based on a simple correlation and if it is true, it indicates that the other members of these gene families probably do not contribute towards achieving plants Nitrogen use efficiency in plants and therefore, there exists a possibility to further increase the NUE of crops by manipulating all the genes of this gene family. Further, in the present study, not only the gene family whose members are previously reported to be regulated by Dof1, similar correlation study of all the members of the gene family involved in glycolysis, TCA cycle, C/M metabolism was also carried out and as expected no significant correlation between the Dof binding sites and expression levels was observed. The overall result obtained suggests that mere presence of high number of Dof1 binding sites in the promoter region does not indicate high levels of expressions of a given genes and the Dof1 overrides other binding sites and probably interacts with binding sites having specific DNA architecture. Hence, to identify the potential Dof binding sites in the promoter region of genes regulated by Dof1, Dof1 protein was modelled and using in silico methods it was allowed to interact with the promoter region of the genes reported to be regulated by Dof1.
nucleotides each. The docking experiments showed that the modelled Dof1 protein interacted with its binding site with lowest energy. The results indicated that there were only a few AAAG sites in the promoter region which interacts with Dof1 protein and every “AAAG” did not participate in the interaction. It was further observed that the Maize Dof1 protein recognized the (A\T\C)AAAG sequence as a core motif in protein-DNA docking studies. It was also observed that the concentration of Adenine was high in the flanking sequences of “AAAG” which interacted with Dof1 transcription factor. The DNA-protein docking studies showed that Dof1 interacted with only the specific motifs in the promoter region and not all and if these specific region or motifs are not present Dof1 with would not interact thereby increasing the specific of Dof1 proteins. It would be tempting to find if the Dof1 specific target motif is present only in the promoters of genes under its regulation. However, it is likely that other factors such as protein-protein interaction and post translational modifications, also contribute to specific interaction of Dof proteins with their target sites in vivo [30]. However, more analysis is necessary to clarify the flanking nucleotide around AAAG using other more sophisticated algorithms and software’s. The availability of purified Dof1 protein will further provides molecular insight of its 3-D structure by X-ray crystallography and interaction study with DNA using DNA foot printing and atomic force microscopy to identify the probable Dof binding sites with different cloned promoters driving the expression of C/N metabolism genes.
Identification of target “AAAG” site through in-silico Dof1-DNA interaction Since, Dof1 structure is not available; its structure was modelled using the online protein threading tool “LOMET". The Dof 1 protein structure model was validated using various online available tools. Due to the size restriction of the docking server, the promoter sequence of the genes known to be regulated by Dof1 viz., these four genes of Arabdobsis that are phosphoenolpyruvate carboxylase (PEPC), pyruvate kinase (PK), glutamate synthase (GS2) and nitrate reductase (NIA2) and was fragmented into 200
Acknowledgements
http://bioinfo.aizeonpublishers.net/content/2014/4/bioinfo412-422.pdf
CONCLUSION There is a great diversity of Dof binding sites in the promoter region of the members of a gene family that have been reported to be regulated by Dof1 TF. The expressions of members of a gene family regulated by Dof1 TF are diverse. In most of the cases H0 hypothesis was accepted suggesting that number of Dof binding sites in the promoter region of members of a gene family is not directly related to their expression levels. Probably it is not the number of Dof binding repeats but its specific location on the promoter region relative to the transcription start site plays an important role in governing the expression of individual gene. Oherwise probably Dof1 selectively regulates a few genes of a gene family that show increased nitrogen use efficiency phenotype.
The authors thankfully acknowledge Department of Biotechnology, Govt. of India for providing financial support in the form of program support for research and development in Agricultural Biotechnology (Grant no. BT/PR7849/AGR/02 /374/2006-Part II), as well as Sub DIC Bioinformatics at G.B. Pant University of Agriculture and Technology, Pantnagar, India for providing all necessary facilities.
REFERENCES 1.
Yanagisawa S, Izui K (1993) Molecular cloning of two DNAbinding proteins of maize that are structurally different but
421
Alok Kumar Gupta et al. / Int J Comput Bioinfo In Silico Model. 2014, 3(4): 412-422
2.
3.
4.
5.
6.
7.
8.
9.
10.
11.
12.
13.
14.
15.
16.
interact with the same sequence motif. J Biol Chem. 268:16028-36 Yanagisawa S., Sheen J., (1998). Involvement of maize Dof zinc finger proteins in tissue-specific and light-regulated gene expression. Plant Cell. 10:75-89. Yanagisawa S., (2000). Dof1 and Dof2 transcription factors are associated with expression of multiple genes involved in carbon metabolism in maize. Plant Journal. 21:281-288. Park DH, Lim PO, Kim JS, Cho DS, Hong SH, Nam HG (2003) The Arabidopsis COG1 gene encodes a Dof domain transcription factor and negatively regulates phytochrome signaling. Plant J 34:161–171. Ward JM, Cufr CA, Denzel MA, Neff MM (2005) The Dof transcription factor OBP3 modulates phytochrome and cryptochrome signaling in Arabidopsis. Plant Cell 17:475– 485 Vicente-Carbajosa J, Moose SP, Parsons RL, Schmidt RJ (1997). A maize zinc-finger protein binds the prolamin box in zein gene promoters and interacts with the basic leucine zipper transcriptional activator Opaque2. Proc Natl Acad Sci 94:7685–7690. Mena, M., Vicente-Carajosa, J., Schmidt, R.J. and Carbonero, P.(1998) An endosperm-specific DOF protein from barley, highly conserved in Wheat, binds to and activates transcription from the prolamin-box of a native β-hordein promoter in barley endosperm. Plant J. 16: 53-62 Gualberti G, Papi M, Bellucci L, Ricci I, Bouchez D, Camilleri C, Constantino P, Vittorioso P (2002) Mutations in the Dof zinc finger genes DAG2 and DAG1 influence with opposite effects the germination of Arabidopsis seeds. Plant Cell 14:1253– 1263. Washio K (2003) Functional dissections between GAMYB and Dof transcription factors suggest a role for protein–protein association in the gibberellin-mediated expression of the RAmy1A gene in the rice aleurone. Plant Physiol 133:850– 863. Baumann K, De Paolis A, Costantino P, Gualberti G (1999) The DNA binding site of the Dof protein NtBBF1 is essential for tissue-specific and auxin-regulated expression of the rolB oncogene in plants. Plant Cell 11: 323–334. Kang G., Wang C., Sun G. and Wang Z. (2003). Salicylic acid changes activities of H2O2-metabolizing enzymes and increase the chilling tolerance of banana seedlings. Environ. Exp. Bot. Plesch, G., Ehrhart, T. and Mueller-Roeber, B. (2001) Involvement of TAAAG elements suggests a role for Dof transcription factors in guard cell-specific gene expression. Plant J. 28:455-464 Imaizumi T, Schultz TF, Harmon FG, Ho LA, Kay SA (2005) FKF1 F-box protein mediates cyclic degradation of a repressor of CONSTANS in Arabidopsis. Science 309:293– 297. Skirycz A, Reichelt M, Burow M et al., (2006) DOF transcription factor AtDof1.1 (OBP2) is part of a regulatory network controlling glucosinolate biosynthesis in Arabidopsis. Plant J. 47, 10–24. Wei, P.C., Tan, F., Gao, X.Q., et al., (2010). Overexpression of AtDOF4.7, an Arabidopsis DOF Family Transcription Factor, Induces Floral Organ Abscission Deficiency in Arabidopsis, Plant Physiol., vol. 153, pp. 1031–1045. Gerhardt IR, Filippi SB, Okura V, et al., (2011) Overexpression of walldof transcription factor increases secondary wall deposition and alters carbon partitioning in poplar. BMC Proc 5(Suppl 7):O35.
17. Sugiyama T, Ishida T, Tabei N, et al., (2012) Involvement of PpDof1 transcriptional repressor in the nutrient conditiondependent growth control of protonemal filaments in Physcomitrella patens. J. Exp. Bot. 63, 3185–3197. 18. Rueda-Romero P, Barrero-Sicilia C, Cadenas AG, et al., (2012). Arabidopsis thaliana DOF6 negatively affects germination in non-after-ripened seeds and interacts with TCP14. J Exp Bot 63:1937–1949. 19. Yanagisawa S., Schmidt R.J., (1999). Diversity and similarity among recognition sequences of Dof transcription factors. The Plant Journal. 17(2): 209-214. 20. Diaz I., Vicente-Carbajosa J., Abraham Z., et al., (2002). The GAMYB protein from barley interacts with the DOF transcription factor BPBF and activates endosperm-specific genes during seed development. The Plant Journal. 29:401414. 21. Martinez M., Diaz I., (2005). The barley cystatin gene (Icy) is regulated by DOF transcription factors in aleurone cells upon germination. Journal of Experimental Botany. 56:547-556. 22. Yamamoto MP et al (2006) Synergism between RPBF Dof and RISBZ1 bZIP activators in the regulation of rice seed expression genes. Plant Physiol 141:1694–1707. 23. Yanagisawa S (1997) Dof DNA-binding domains of plant transcription factors contribute to multiple protein–protein interactions. Eur J Biochem 230:403–410. 24. Krohn, N.M., Yanagisawa, S. and Grasser, K.D. (2002) Specificity of the stimulatory interaction between HMGB proteins and the transcription factor Dof2 and its negative regulation by protein kinase CK2-mediated phosphorylation. J. Biol. Chem. 277, 32438-32444. 25. Rubio-Somoza I, Martinez M, Abraham Z, Diaz I, Carbonero P (2006) Ternary complex formation between HvMYBS3 and other factors involved in transcriptional control in barley seeds. Plant J 47:269– 281 26. Gupta A.K., Gaur V.S., Gupta S., Kumar A., (2013). Molecular characterization and co-expression analysis of genes involved in nitrogen uptake and assimilation in finger millet genotypes grown under the influence of varying nitrate signals for understanding their regulation. Functional Integrated Genomic. 13(2):179-190. 27. S. Wu, Y. Zhang. LOMETS: A local meta-threading-server for protein structure prediction. Nucleic Acids Research 2007; 35: 3375-3382 28. Yanagisawa S (2004) Dof domain proteins: plant-specific transcription factors associated with diverse phenomena unique to plants. Plant Cell Physiol 45:386–391. 29. Gupta N., Gupta A.K., Kumar A., (2012). Spatial distribution of Dof1 transcription factor in different tissues of three finger millet genotypes differing in grain colour, yield, protein content and photosynthetic efficiency. Molecular Biology Report. 39(3):2089-2095. 30. Yanagisawa S., (2001). The transcriptional activation domain of the plant-specific Dof1 factor functions in plant, animal and yeast cells. Plant Cell Physiology. 42(8):813-823.
© 2014; AIZEON Publishers; All Rights Reserved This is an Open Access article distributed under the terms of the Creative Commons Attribution License which permits unrestricted use, distribution, and reproduction in any medium, provided the original work is properly cited.
*****
http://bioinfo.aizeonpublishers.net/content/2014/4/bioinfo412-422.pdf
422