S8-2 [Invited]
Ext. Abs. the 11th International Workshop on Junction Technology 2011
Dopant and carrier profiling for 3D-device architectures Jay Mody1,2, A K Kambham1,2, G. Zschätzsch1,2, T. Chiarella2, N. Collaert2, L. Witters2, Pierre Eyben2, M. Gilbert2, S Kölling1,2, A. Schulze1,2, T-Y Hoffmann2 and Wilfried Vandervorst1,2 1
2
K.U.Leuven, Department of Physics and Astronomy, B-3001 Leuven, Belgium, imec, Kapeldreef 75, B-3001 Leuven, Belgium E-mail:
[email protected] 3D-problem, several concepts have emerged looking at less complicated approaches to probe the degree of conformality. Rather than tackling the 3D-problem they focus on probing the conformality of the source/drain region as a first step in the process development. The full ranges of metrology concepts for this study are: Resistors [7], SIMS through fins [8], SSRM [8] and Atom Probe [9].
1. Introduction For continued downscaling at 22nm node and beyond, FinFETs have now emerged as the device of choice due to an unprecedented combination of performance improvement (increased Id) and power reduction (low leakage) [1]. A crucial aspect in the process design is the recognition that the drive current control in FinFETs is dominated by the sidewall doping (dose retention/activation), as shown in Figure 1 [2], whereas short channel effects are linked to dopant conformality. This represents a challenge for the junction formation of 3D-device architectures (FinFETs) as we need to combine both aspects simultaneously i.e. high sidewall doping and conformality. To achieve this goal several doping alternatives are being considered such as traditional ion implantation [3], vapor phase doping [4] and variants of plasma doping [5], [6]. Obviously, adequate development of these processes requires the availability of 3D-dopant and carrier profiling techniques with sub-nm resolution.
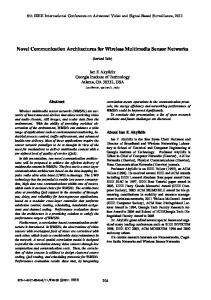
Resistors To probe the degree of conformality in a quick manner a resistor based concept has been proposed by Vandervorst et al. [7]. Here a fin is made out of polysilicon and covered with a hard-mask as shown in Figure 2. Fully pads
HM
silicided
probe
hard mask
10°
45°
Normalized drive current
1.2 Side/Top = 100% (Conformal) Side/Top = 7.5% (10° implant) Side/Top = 46% (45° implant)
Resistors
1.0
(a)
(b)
(c)
0.8
Figure 2 (a) Fin uncovered for fin doping, (b) Fin covered with hard-mask limiting the dopant incorporation to the sidewall process. (c) Fully processed structure with silicided probing pads and non-silicided regions forming the resistors.
0.6 1E19 1E20 1E21 -3 Sidewall peak concentration (cm )
Figure 1: Drive current versus dopant conformality
During the doping step the hard-mask will shield the top from being doped and only the sidewall gets exposed to the doping step. After annealing the entire region outside the hard mask region is fully silicided thereby creating a resistor whose value is proportional to the sidewall dose incorporated below the hard mask. When compared to the resistor value when no hard mask is used (i.e. when top and sidewall are exposed simultaneously), information on the sidewall doping efficiency can be extracted. Since the side wall represents a much larger area than the top, one should ideally reach a situation where the resistor value with or without a hard mask is almost the same. Figure 3 shows the conformality values that are obtained for the fins implanted with different tilt angles (45º vs. 10º). One can clearly see that with the 45º tilted implant the sidewall is more doped than the 10º case as was expected. Since this method is based on a wafer level concept, it can be run as a standard wafer lot, enabling to explore complex design of
In this paper, we discuss the metrology concepts that can be applied to characterize dopant/carrier profiles in FinFET-based structures. We demonstrate their value in a study of dose retention and activation when traditional ion implantation is used for junction formation at different tilt angles (45º and 10º). The high tilt angle is a simple approach to reach high sidewall doping and modest conformality. Although in practice this approach is of limited value, as shadowing caused on neighboring fins will limit applicability, it can serve as a reference for the more common approach based on a low tilt angle (≤ 10º). 2. Metrology Concepts for 3D-device architectures From the previous section it is very clear that for FinFETs one needs to measure the degree of conformality i.e., top vs. sidewall dose. Although intrinsically a
978-1-61284-134-2/11/$26.00 ©2011 IEEE
108
Ext. Abs. the 11th International Workshop on Junction Technology 2011
concentration of the area that is analyzed in the SIMS crater, which must be converted to dose. Assuming that the dopants are confined in the top surface and the sidewalls of the fin (and thus not in the deposited undoped silicon in the trenches), the dopant concentration in the fins can be obtained by considering the surface fraction that is taken up by the fins. It should be noted that the dopants are implanted in 2-quad mode during the implantation process. Hence, during SIMS analysis we obtain dopant concentration from both the sidewalls of the fins resulting in dose per fin (i.e., two sidewalls).When converting the SIMS signal to concentrations using the regular relative sensitivity factor approach, the following equation applies: Sidewall dosefin = SIMS concentration x Fin pitch [8].
R (no HM) / R (HM)
experiments. Its suitability to automatic wafer probing moreover provides extra information on wafer uniformity in a timely manner. However, the information necessary to understand the doping process, top vs. sidewall junction depth, dose retention (dopants incorporated), dose activation (dopants activated) values are missing.
45° tilt
10° tilt
14
Sims through fins SIMS is a highly sensitive surface analysis technique, which is fast, reliable, and is able to detect elements present in the parts per billion ranges. As it is a 1D technique, planar samples (apparently no resembling the 3D-fin structures) are only suitable. Therefore an alternative SIMS concept was developed (SIMS through FINs) [8] which nevertheless provides information on the sidewall dose. The approach is based on removing the 3D-geometry by filling the space in between an array of FINs which have been exposed to the doping/anneal process, with undoped polysilicon and subsequently planarizing it by chemical mechanical polishing as shown in Figure 4. Deposited Si
Array of 10 fins
1E20 45°
1E19 10°
1E18
0
100
200
300
Figure 5: Comparison of boron SIMS-thru fin profiles implanted at 45° and 10°. The dose values obtained with SIMS are comparable with the theoretical model suggested by Vandervorst et al. [7] and the values are summarized in Table 1. The value of “SIMS through fins” is that it provides a quantitative measurement of the top and the sidewall dose be it without any information on the in-depth distribution within the fins.
Deposited Si 40nm
Bottom of the fin & Trench
Sidewall of the fin
Depth (nm)
200nm
200nm
200nm
Space between adjacent arrays 2.7μm
1E21
Top surface
3
Apparent Concentration (at./cm )
1E22
Figure 3: Conformality values obtained with resistor structures
40nm
2
BF2 5keV 8 x 10 ions/cm
Atom Probe Tomography (APT) Although the previous concepts provide quite a lot of information only atom probe tomography can provide us with 3D spatial resolution necessary for probing dopants in FinFET-based devices. The APT-analysis was performed using a laser assisted wide angle atom probe (LAWATAP) from CAMECA [10]. Figure 6 illustrates the APT-analysis for the 40nm fins where the 3D dopant distribution of boron (green) inside a fin and the native oxide (orange) covering the sidewalls of the fin are shown. Due to the size of the fins (40 nm) relative to the APT-tip (50-100 nm) (Figure 4 – dashed line) it becomes virtually impossible to image the fin with one APT-tip completely and separate APT-measurements are used to probe the top and side profiles (see Figure 4 & Figure 6 (b)). Although focused ion beam (FIB) preparation is used to ion mill the APT-tip, intermixing of the dopant profile and Ga-incorporation is
Array of 10 fins
Figure 4: Fin Array used for SIMS through fin Now when SIMS profile is performed on this planarized sample, even erosion occurs and the SIMS signal will represent the amount of dopants present at the instantaneous surface. As seen in Figure 5 in the early phase of the profile (first peak) this will be primarily dopants originating from the top of the FIN whereas with increasing depth (flat part of the SIMS profile), dopant atoms will originate from the sidewall regions. Finally (second peak) the region doped in between the FINs is reached. Our parameter of interest is to extract the dose on the top surface and sidewall of the fins. However, during a SIMS measurement we obtain the average dopant
109
Ext. Abs. the 11th International Workshop on Junction Technology 2011
+
avoided by working consecutively at reduced Ga -beam energies, 30, 16, 5 and 2kV which prevents the milling of the cap layer.
sidewall of the fin. SSRM is a scanning probe based method sampling the local carrier concentration with sub-nm spatial resolution and is already a well established technique for 2D-carrier-profiling [11]. In the past it has also been successfully applied for FinFET-based devices [12]. Thus, it can well be utilized to study the junction formation and conformality of the source/drain regions of FinFET-based devices. The value of SSRM is that it not only provides information on the junction location but equally well on the distribution of the carriers and their respective concentrations. 40nm fin - 45° tilted implant - Lateral profiles 1
5E20 Boron SiO2 SiF
Atomic %
Comparing the lateral profiles at mid height in the fins (Figure 6 (a) & (b)), the different sidewall incorporation efficiencies for the 45° and 10° case are revealed. The implant angle has a clear impact on the lateral B-distribution (Figure 7) translating to very different conformalities (see Table 1).
5E20
Atomic %
1E20 0.1
0.01 -10
0
10
20
30
40
10
20
30
40
5E18 50
Figure 8: Lateral dopant profile of 45° showing Boron, Oxygen (SiO2) and Fluorine (SiF) profiles for 45° implanted fin. (Atom Probe) The SSRM images of 40 nm wide fins for both tilts (45° & 10°) are shown in Figure 9. The fins implanted at 45° appear completely doped with a higher concentration in the top. However, in the 10° case, a shallow highly doped region is observed at the sidewall whereas the top surface implant is deeper (Figure 9). Comparisons of the retained sidewall dose obtained by APT, SIMS & SSRM (Table 1) show a good agreement suggesting nearly 100 % activation agreement (within the error margin of 20-30%) for the sidewall (Figure 10, 11, 12) which is also in agreement with 2D-simulation results (Figure 12). The latter is in contrast with the top dose (Table 1) where APT and SIMS indicate a much higher incorporation than SSRM. A large inactive fraction is present here as evidenced also by the difference in near-surface peak concentration. The latter implies that the conformality (sidewall dose/top dose) of the “electrical carriers” is higher (up to 23% even at 10° tilt) than the “chemical dopant” conformality implying that characterization of electrical conformality will be completely different than chemical conformality and one should not extrapolate the electrical conformality based on the chemical conformality.
3
1E19
0
Depth (nm) Concentration (at./cm )
Boron 45° Boron 10°
5E19
3
0.01 -10
40nm fin - Lateral profiles
1
0.1
Concentration (at./cm )
Figure 6: 3D dopant distribution data of 40nm fin implant at (a) 45° & (b) 10°. (Green → Boron, Orange → SiO2)
5E18 50
Depth (nm)
Figure 7: Lateral dopant profile of 45° and 10° implanted fins (figs. 2 (a) & (b)) (Atom Probe) When a lateral profile (Figure 8) for the 45° case clearly shows an almost uniform B-distribution within the fin, its location relative to the native oxide (represented here by the SiO2 cluster) and the F-distribution (shown here as SiF) exhibits an accumulation within the native oxide as well. To validate our results we compare the values with the previously obtained SIMS results and the theoretical model [7]. The results are summarized in Table 1 and are in good agreement. However, it must be noted now we can obtain 3D spatial distribution of dopants in FinFETs. Scanning Spreading Resistance Microscopy (SSRM) Previously the resistor approach provided information on the active dopants on the sidewall, no detailed information was present on their spatial distribution or the active concentration in the top and
110
Ext. Abs. the 11th International Workshop on Junction Technology 2011
40nm fin - 10° tilted implant 500
Depth (nm)
Depth (nm)
400
300
200
1.0E21 1.0E20 1.0E19 1.0E18 1.0E17 1.0E16 1.0E15 1.0E14
300
200
100
100 75 150 Depth (nm)
1E22
1E22
50 100 150 Depth (nm)
1E21
45°
1E20
1E20
1E19
1E19 10° 1E18 -10
3
Figure 9: 2D-SSRM map of active carrier concentration of BF2 implanted at 45° and 10°
1E21
APT - 45° SSRM - 45° Simulated Carrier Conc. - 45° APT - 10° SSRM - 10° Simulated Carrier Conc. - 10°
Dopant concentration (at./cm )
400
40nm fin - Lateral profiles 3
Carrier Concentration (/cm ) (log10 scale)
3
500
Carrier concentration (at./cm )
40nm fin - 45° tilted implant
1E18 0
10
20 30 Depth (nm)
40
50
1E22
Top surface
3
1E21
Sidewall of the fin SIMS SSRM
1E20
Fin Bottom & Trench
1E21
1E20
1E19
1E19
0
100 200 Depth (nm)
300
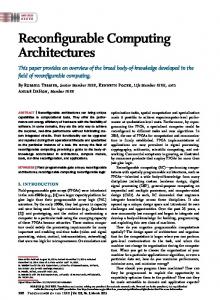
Figure 12: Comparison of lateral profiles as extracted from APT, SSRM and 2D-simulations for both 45° & 10° tilted implants Device Performance Figure 13 represents the Ion vs. Ioff curve for p-FinFET devices where the extensions are implanted at 45° and 10°. We see approximately 25% improvement in the drive current at Ioff = 100 nA/µm with the 45° tilted implant as compared to the 10° tilt implanted case. In 10° 19 -3 case, the lower sidewall concentration (~ 4x10 cm ) and the reduced underlap degrades the drive current by a higher extension resistance. The latter is in agreement with theoretical simulations [2] which show a similar dependence of the drive current on the side wall concentration (Figure 14). A further increase of the dose for the 10° tilted implants is required to compensate this effect and to account for the reduced underlap under the gate. Increasing the dose by “2x” for a 10º implant increases the drive current by 10% thus, getting closer to the reference 45º implant case (Figure 13). However, further increase in dose or energy is not recommended as they would lead to secondary effects such as fin erosion and fin amorphization. This makes a very strong case for non ion implantation based doping strategies such as plasma doping, vapor phase doping, etc..
3
1E18
1E18
Apparent carrier concentration (/cm )
Apparent concentration (at./cm )
40nm fin - 45° tilted implant 1E22
Figure 10: SSRM vs. SIMS (45° implant). SSRM profile is calculated from figure 10. ([8] for the procedure)
1E21
Top surface
3
1E22
1E20
Sidewall of the fin SIMS SSRM
Fin Bottom & Trench
1E21
1E20
1E19
1E19
0
100 200 Depth (nm)
300
3
1E18
1E18
Apparent carrier concentration (/cm )
Apparent concentration (at./cm )
40nm fin - 10° tilted implant 1E22
Figure 11: SSRM vs. SIMS (10° implant). SSRM profile is calculated from figure 10. ([8] for the procedure)
111
Ext. Abs. the 11th International Workshop on Junction Technology 2011
1 0.01 1E-4 Ioff (A/µm)
3. Conclusions Dopant and carrier profiling techniques for FinFET-based structures have been demonstrated. The resistor based approach can provide information on active dopant conformality wand is suited for automated probing leading to a quick turnaround time for extensive screening of doping conditions and wafer uniformity studies. SIMS can provide quantitative information on dose retained in top vs. sidewall of the fins. However, both these techniques lack in resolving the spatial distribution of dopant for which one would need to rely on techniques such as Atom Probe for dopants and SSRM for active dopants where one can obtain information with extremely high spatial resolution.
Boron - 45° tilted implant Boron - 10° tilted implant Boron - 10° tilted implant (2x Dose)
1E-6 1E-8
+25% @ Ioff = 100nA/µm
1E-10
+12% @ Ioff = 100nA/µm
1E-12 1E-14 200
400
600
Ion (µA/µm)
Acknowledgements IMEC acknowledges the collaboration with CAMECA and S.K, A.S. thank IWT for their PhD fellowship.
Figure 13: Comparison of p-FinFET device performance for extensions ion implanted at 45° and 10° tilts.
References [1] “Intel 22nm 3-D Tri-Gate Transistor Technology,” 02-May-2011. [Online]. Available: http://newsroom.intel.com/docs/DOC-2032. [Accessed: 11-May-2011]. [2] R. Duffy et al., “Doping fin field-effect transistor sidewalls: Impurity dose retention in silicon due to high angle incident ion implants and the impact on device performance,” Journal of Vacuum Science & Technology B: Microelectronics and Nanometer Structures, vol. 26, no. 1, p. 402, 2008. [3] H.-J. L. Gossmann, “Ion implantation in advanced planar and vertical devices,” Nuclear Instruments and Methods in Physics Research Section B: Beam Interactions with Materials and Atoms, vol. 237, no. 1-2, pp. 1-5, Aug. 2005. [4] S. Takeuchi et al., “Vapor Phase Doping with N-type Dopant into Silicon by Atmospheric Pressure Chemical Vapor Deposition,” ECS Transactions, vol. 16, no. 10, pp. 495-502, Oct. 2008. [5] D. Lenoble et al., “Enhanced Performance of PMOS MUGFET via Integration of Conformal Plasma-Doped Source/Drain Extensions,” in VLSI Technology, 2006. Digest of Technical Papers. 2006 Symposium on, Honolulu, HI, 2006, pp. 168-169. [6] B. Mizuno, “Plasma Doping for 3D and 2D devices,” in Junction Technology, 2009. IWJT 2009. International Workshop on, 2009, pp. 91-95. [7] W. Vandervorst et al., “Probing doping conformality in fin shaped field effect transistor structures using resistors,” in International Workshop on Insight in Semiconductor Device Fabrication, Metrology and Modeling (Insight 2007), Napa, California, 2008, vol. 26, pp. 396-401. [8] J. Mody et al., “Experimental studies of dose retention and activation in fin field-effect-transistor-based structures,” Journal of Vacuum Science & Technology B: Microelectronics and Nanometer Structures, vol. 28, p. C1H5-C1H13, Jan. 2010.
Figure 14: Comparison of normalized drain current vs. sidewall surface concentration and the top /side surface concentration ratio indicating the degree of conformality Table 1: Comparison of conformalities obtained for dose retention using APT, SIMS and theoretical values. Also conformality values for active percentage of retained dose are mentioned as measured with SSRM. Conformality Conformality (Sidewall/top) (Sidewall/top) (%) (%) 45º tilted 10º tilted Retained dopants implant implant Theoretical Model [7] 46 7.5 SIMS 36 9.0 Atom Probe 39 12.5 Active percentage of dopants SSRM 78 29
112
Ext. Abs. the 11th International Workshop on Junction Technology 2011
[9]
A. K. Kambham, J. Mody, M. Gilbert, S. Koelling, and W. Vandervorst, “Atom-Probe for Finfet Dopant Characterization,” in 52nd International Field Emission Symposium, Sydeny, Australia, 2010. [10] “CAMECA LA-WATAP 3D Atom Probe•: LASER Assisted Wide Angle Tomographic Atom Probe.” [Online]. Available: http://www.cameca.com/html/product_atom_probe.ht ml. [Accessed: 24-Jan-2010]. [11] Li Zhang, H. Tanimoto, K. Adachi, and A. Nishiyama, “1-nm Spatial Resolution in Carrier Profiling of Ultrashallow Junctions by Scanning Spreading Resistance Microscopy,” Electron Device Letters, IEEE, vol. 29, no. 7, pp. 799-801, 2008. [12] J. Mody, P. Eyben, E. Augendre, O. Richard, and W. Vandervorst, “Toward extending the capabilities of scanning spreading resistance microscopy for fin field-effect-transistor-based structures,” Journal of Vacuum Science & Technology B: Microelectronics and Nanometer Structures, vol. 26, no. 1, pp. 351-356, Jan. 2008.
113