Int. J. Radiation Oncology Biol. Phys., Vol. 67, No. 2, pp. 342–346, 2007 Copyright © 2007 Elsevier Inc. Printed in the USA. All rights reserved 0360-3016/07/$–see front matter
doi:10.1016/j.ijrobp.2006.09.010
CLINICAL INVESTIGATION
Prostate
DOSIMETRIC PARAMETERS AS PREDICTIVE FACTORS FOR BIOCHEMICAL CONTROL IN PATIENTS WITH HIGHER RISK PROSTATE CANCER TREATED WITH Pd-103 AND SUPPLEMENTAL BEAM RADIATION PETER ORIO, D.O.,*† KENT WALLNER, M.D.,*†‡ GREGORY MERRICK, M.D.,§ ANDREW HERSTEIN,† PAUL MITSUYAMA, M.D.,*† KEN THORNTON, PH.D.,㛳 WAYNE BUTLER, PH.D.,§ AND STEVEN SUTLIEF, PH.D.*† *Department of Radiation Oncology, University of Washington, Seattle, WA; †Radiation Oncology, Puget Sound Health Care System, Department of Veterans Affairs, Seattle, WA; ‡Group Health Cooperative, Seattle, WA; §Schiffler Cancer Center, Wheeling, WV; 㛳Varian Medical Systems, Charlottesville, VA Purpose: To analyze the role of dosimetric quality parameters in maximizing cancer eradication in higher risk prostate cancer patients treated with palladium (Pd)-103 and supplemental beam radiation. Methods: One-hundred-seventy-nine patients treated with Pd-103 and supplemental beam radiation, with minimum 2 years follow-up prostate-specific antigen (PSA) values and posttreatment computed tomography scans were analyzed. Dosimetric parameters included the V100 (percent of the postimplant volume covered by the prescription dose), the D90 (the minimum dose that covered 90% of the post implant volume), and the treatment margins (the radial distance between the prostatic edge and the prescription isodose). Treatment margins (TMs) were calculated using premarket software. Results: Freedom from biochemical failure was 79% at 3 years, with 92 of the 179 patients (51%) followed beyond 3 years. In comparing patients who did or did not achieve biochemical control, the most striking differences were in biologic factors of pretreatment PSA and Gleason score. The V100, D90, and average TM all showed nonsignificant trends to higher values in patients with biochemical control. In multivariate analysis of each of the three dosimetric parameters against PSA and Gleason score, TM showed the strongest correlation with biochemical control (p ⴝ 0.19). Conclusions: For patients with intermediate and high-risk prostate cancer treated with Pd-103 brachytherapy and external beam radiation, biologic factors (PSA and Gleason score) were the most important determinants of cancer eradication. However, there is a trend to better outcomes among patients with higher quality implant parameters, suggesting that attention to implant quality will maximize the likelihood of cure. © 2007 Elsevier Inc. Prostatic carcinoma, Brachytherapy, Dosimetry, Quality.
riphery. Until recently, adequate peripheral coverage in higher risk patients was believed to depend on supplemental beam radiation. However, with the demonstration that EPE is typically limited to 3 mm, and that brachytherapy can achieve comparable treatment margins, it is possible that EPE can be adequately treated with brachytherapy alone (6 –10). Supplemental beam radiation presumably decreases the need to achieve wide TMs with brachytherapy. Although addition of supplemental beam irradiation may mitigate the effect of inadequate brachytherapy, it is likely that optimal cancer control rates will still require good quality brachytherapy, with high V100s, D90s, and wide TMs. In addition to V100 and D90, we have an interest in analyzing the effect of TMs, because TMs may add to implant quality assessment independent of the more tradi-
INTRODUCTION There is fairly strong evidence linking optimal brachytherapy-related prostate cancer control rates to dosimetric parameters. The V100, D90, and average treatment margin (TM) have all shown some correlation with cancer control rates (1–5). To date, a prognostic role for dosimetric parameters has only been shown for patients treated with I-125 or palladium (Pd)-monotherapy. When supplemental beam is used, Potters reported no relationship between dosimetric parameters and cancer control rates (1). Extraprostatic cancer extension (EPE) has also been a subject of interest regarding treatment modality optimization for early stage prostate cancer. Extraprostatic cancer extension, commonly identifiable in higher risk prostate cancers, calls for a cancericidal radiation dose at the prostatic peReprint requests to: Kent Wallner, M.D., Puget Sound Health Care System, Radiation Oncology (#174), Department of Veterans Affairs, 1660 S. Columbian Way, Seattle, WA 98108-1597. Tel: (206) 7685356; Fax: (206) 768 5331; E-mail:
[email protected]
Conflict of interest: none. Received May 22, 2006, and in revised form Aug 14, 2006. Accepted for publication Sept 2, 2006. 342
Dosimetry and prostate brachytherapy
●
P. ORIO et al.
343
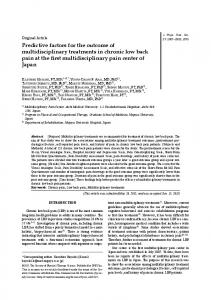
Fig. 3. Image taken from premarket Varian treatment margin software, with treatment margins measured at every 3.6° around the prostate periphery.
Fig. 1. Examples of patients with similar V100s and similar average treatment margins (TM), but with substantially different posterior TMs. The patient on the right has nearly complete posterior coverage, whereas the patient on the left has inadequate posterior coverage.
tional parameters (Figs. 1 and 2). In earlier studies, treatment margins were hand-measured from dosimetric printouts, making the process cumbersome and more error-prone (3). Subsequently, a treatment margin calculation program has been devised by Varian Medical Systems (Varian, Char-
lottesville, VA) to make treatment margin measurements more practical and flexible (Fig. 3). To better define the role of quality parameters in higher risk patients who receive supplemental beam radiation, we analyzed their cancer control rates in relationship to V100, D90, and TMs. METHODS AND MATERIALS As of November 2004, 566 patients with 1997 American Joint Commission clinical stage T1c-T2a prostatic carcinoma, Gleason Grade 7–10 or PSA 10 –20 ng/mL were randomized to a prospec-
Fig. 2. Lateral three-dimensional view of patients from Fig. 1, showing larger posterior treatment margin for the patient on the right.
344
I. J. Radiation Oncology
●
Biology
●
Physics
Volume 67, Number 2, 2007
Table 1. Clinical and dosimetric factors affecting biochemical control
Gleason score PSA D90 TM V100
Cancer-free
Recurrence
Univariate
7.0 (⫾ 0.52) 9.2 (⫾ 4.3) 105% (25) 2.5 mm (⫾ 2.5) 89% (⫾ 10)
7.3 (⫾ 0.91) 10.6 (⫾ 4.3) 100% (⫾ 23) 2.3 mm (⫾ 2.0) 88% (⫾ 8)
0.011 0.08 0.47 0.17 0.12
Multivariate* p p p p p
⫽ ⫽ ⫽ ⫽ ⫽
0.002 0.047 0.99 0.19 0.39
Abbreviations: PSA ⫽ prostate-specific antigen; TM ⫽ treatment margin. * Gleason score and PSA multivariates shown were calculated only with V100 (as the third variable). Multivariate values for D90, TM, and V100 were each calculated separately, with Gleason score and PSA as the first two variables. tive study comparing 20 Gy vs. 44 Gy supplemental beam radiation with 113 Gy and 86 Gy Pd-103 prostate brachytherapy, respectively. The details of the randomized study have been previously published (11). Preliminary analyses have shown no difference between the randomization arms, so that both supplemental beam dose levels were pooled for analysis here (11). Of the 566 patients randomized, 179 patients treated at the Puget Sound Veterans Administration have minimum 2 years follow-up PSA values and posttreatment CT scans available for this analysis. All patients underwent standard pretreatment evaluation, including a complete history and physical, serum PSA evaluation, transrectal ultrasound, and pretreatment CT scans. Two investigative pathologists reviewed all prostate biopsies for Gleason score determination. Pd-103 implantation of the prostate was performed with a standard modified peripheral loading pattern (12). The Pd-103 source strength ranged from 1.9 to 2.8 mCi (median, 2.5 mCi). The total number of seeds implanted ranged from 44 to 167 (median, 76). External beam radiation was designed to cover the prostate and seminal vesicles, with a 2.0 cm margin (reduced to 1.0 cm posteriorly). A postimplant computed tomography (CT) pelvic scan was obtained 1– 4 h after the implant procedure, using 3-mm interval slices. The contoured image and sources were entered into a Varian treatment planning system. A redundancy check was performed to ensure seeds were not duplicated. Dose–volume histograms of the prostate and rectum were calculated. Dosimetric parameters included the V100, defined as the percent of the postimplant volume covered by the prescription dose, and the D90, defined as the dose that covered 90% of the postimplant prostate volume. TMs were measured as the radial distance from the prostatic margin to the prescription isodose, using premarket software provided by Varian (Dose Calc Test Application; Varian) (3). Contoured images of the prostate, isodose distributions, and source locations were exported from the Varian treatment planning system to a software program capable of calculating treatment margins from the periphery of the prostate to the 100% isodose line (Fig. 3). The program calculates the TM at 100 rays around the prostate (at 3.6° intervals). In addition to calculating an average TM for the entire gland, the prostate was arbitrarily divided into seven TM regions. Three horizontal planes included the base (3 mm inferior to the most proximal plane), mid-prostatic plane, and the apex (3 mm superior to the most inferior apical plane). Treatment margins were also calculated for the anterior, posterior, and right and left lateral quadrants, extending from base to apex. Freedom from biochemical failure was defined as a serum PSA ⱕ0.5 ng/mL at last follow-up. Patients were censored at last follow-up if their serum PSA was still decreasing. Patients whose serum PSA nadired at a value ⬎0.5 ng/mL were scored as failures
at the time of their PSA nadir. The follow-up period for nonfailing patients ranged from 2.0 – 4.9 years (median, 2.9 years). Biochemical control rates could not be determined by American Society for Therapeutic Radiology and Oncology criteria because most veter-
Fig. 4. Biochemical control for patients with higher or lower dosimetric parameters. p values are univariate log–rank. Treatment margins are an average for the entire prostate.
Dosimetry and prostate brachytherapy
●
P. ORIO et al.
345
Fig. 5. Average treatment margins (TMs) around prostate for patients with or without biochemical control.
ans affairs patients had PSAs drawn only on an annual basis, starting 2 years after implantation (13, 14). Freedom-from-failure curves were calculated by the method of Kaplan-Meier (15). Differences between groups were determined by the log–rank method. With 179 patients and approximately 20% failure rate, there is approximately an 80% chance of detecting a 1.2 hazard ratio. Statistical analysis was performed using SPSS software (Chicago, IL). Differences between groups were calculated with the Student’s t test, Cox regression analysis, or log–rank method, as indicated.
RESULTS Freedom from biochemical failure was 79% at 3 years, with 92 of the 179 patients (51%) followed beyond 3 years. Forty patients (22%) developed biochemical failure. In comparing patients who did or did not achieve biochemical control, the most striking differences were in biologic factors of pretreatment PSA and Gleason score (Table 1). The V100, D90, and average TM all showed nonsignificant trend to higher values in patients with biochemical control (Table 1). Survival curves showed modest differences in biochemical control for all three dosimetric parameters, with patients divided into roughly equal groups (Fig. 4, Table 1). In Cox multivariate regression analysis, only Gleason score (p ⫽ 0.001) and PSA (p ⫽ 0.047) were statistically significant predictors of biochemical failure (Table 1). In multivariate analysis of each of the three dosimetric parameters against PSA and Gleason score, TM showed the strongest correlation with biochemical control (p ⫽ 0.19). Separate calculations for the seven TM regions showed
the greatest treatment margins laterally (mean, 4.1 mm ⫾ 2.6) and the tightest margins anteriorly (mean, 0.75 mm ⫾ 3.9) (Fig. 5). In univariate Student’s t test comparisons between patients with or without biochemical failure, there was a trend toward larger overall TMs in most directions in patients with biochemical control (p ⫽ 0.56), but the difference was inconsistent among different regions of the prostate. DISCUSSION The D90 and V100 have been shown to be moderately predictive for biochemical control by brachytherapy alone. Similarly, in the patients studied here, all dosimetric parameters showed a weak trend toward improved outcomes. That the differences in biochemical control are not statistically significant, however, does not mean that they are unimportant. The weak association between higher quality implants and outcomes may be due to a combination of factors. First of all, every patient received supplemental beam irradiation, which would likely soften the effect of inadequate implant. A second factor that may account for the small effect of implant quality on outcomes is that the majority of patients had relatively high V100 and D90 (86% of patients had a V100 of 80% or greater and 71% of patients had a D90 of 90% or greater). With the majority of patients having high values, determining the clinical effect of lower values would require a much larger sample size. A third reason for the small effect of implant quality may be overestimation of the cancericidal dose. If the dose needed to sterilize cancer is significantly lower than our current prescription dose, the
346
I. J. Radiation Oncology
●
Biology
●
Physics
volume treated and the treatment margins are greater than we have computed here. For instance, the 50% isodose volume extends 4 –5 mm beyond the Pd-103 prescription volume analyzed here. For these reasons, the contribution of implant quality to cancer control, may not be evident in series with good overall implant quality and supplemental beam radiation. Early efforts to quantify TMs were hampered by the tedium of hand measurements. The novel software employed in this study allowed for a more complete analysis of treatment margins as a way to predict for biochemical control. As with D90 and V100, treatment margins predict weakly for biochemical control. The precise contribution of TM calculations remains to be determined from larger pa-
Volume 67, Number 2, 2007
tient samples. The true importance of the posterior TM compared with other TM is unclear. The higher predictive power of the posterior TM could be a statistical artifact, or may represent its importance because of its minimization in the planning and implementation of our implants out of concern for excessive rectal doses. In higher risk patients treated with Pd-103 brachytherapy and supplemental beam radiation, biologic factors of PSA and Gleason score were the most important determinants of cancer eradication. However, there is a trend to better outcomes in patients with higher dosimetric parameters, suggesting that attention to implant quality can maximize the likelihood of cure.
REFERENCES 1. Potters L, Cao Y, Calugaru E, et al. A comprehensive review of CT-based dosimetry parameters and biochemical control in patients treated with permanent prostate brachytherapy. Int J Radiat Oncol Biol Phys 2001;50:605– 614. 2. Wallner K, Merrick G, True L, et al. I-125 versus Pd-103 for low risk prostate cancer: Preliminary biochemical outcomes from a prospective randomized multicenter trial. Int J Radiat Oncol Biol Phys 2003;57:1297–1303. 3. Choi S, Wallner KE, Merrick G, et al. Treatment margins predict biochemical outcomes after prostate brachytherapy. Cancer J (Scientific Am) 2004;10:175–180. 4. Papagikos M, deGuzman AF, Rossi P, et al. Dosimetric quantifiers for low-dose-rate prostate brachytherapy: Is V100 superior to D90? Brachytherapy 2005;4:252–258. 5. Stock RG, Stone NN, Cesaaretti J, et al. Biologically effective dose values for prostate brachytherapy: Effects on PSA failure and posttreatment biopsy results. Int J Radiat Oncol Biol Phys 2006;64:527–533. 6. Sohayda C, Kupelian PA, Levin JS, et al. Extent of extracapsular extension in localized prostate cancer. Urol 2000;55:382– 386. 7. Davis BJ, Pisansky TM, Wilson TM, et al. The radial distance of extraprostatic extension of prostate carcinoma: Implications for prostate brachytherapy. Cancer 1999;85:2630 –2637. 8. Merrick GS, Butler WM, Wallner KE, et al. Extracapsular
9.
10.
11.
12. 13. 14. 15.
dose distribution following permanent prostate brachytherapy. Am J Clin Oncol 2003;26:178 –189. Butzbach D, Waterman FM, Dicker AP. Can extraprostatic extension be treated by prostate brachytherapy? An analysis based on postimplant dosimetry. Int J Radiat Oncol Biol Phys 2001;51:1196 –1199. Stock RG, Stone NN, Dahlal M, et al. What is the optimal dose for 125-I prostate implant? A dose-response analysis of biochemical control, posttreatment prostate biopsies, and longterm symptoms. Brachytherapy 2002;1:83– 89. Wallner K, Merrick G, True L, et al. 20 Gy versus 44 Gy supplemental beam radiation with Pd-103 prostate brachytherapy: Early biochemical outcomes from a prospective randomized multi-center trial. Radiother Oncol 2005;75:307–310. Merrick GS, Butler WM. Modified uniform seed loading for prostate brachytherapy: Rationale, design, and evaluation. Techniques Urol 2000;6:78 – 84. Schwartz D, Billingsley K, Wallner K. Follow-up care for cancer: Making the benefits equal the cost. Oncology 2000; 14:1493–1505. Tralins K, Wallner K. Follow-up costs after external beam irradiation for low risk prostate cancer. Int J Radiat Oncol Biol Phys 1999;44:323–326. Kaplan EL, Meier P. Nonparametric estimation from incomplete observations. J Am Stat Assoc 1958;53:457– 481.