bDepartment of Medical Physics, Cookridge Hospital, Hospital Lane, Leeds LS16 6QB, UK. cOncology Physics, Western General Hospital, Crewe Road, ...
Radiotherapy and Oncology 73 (2004) 79–88 www.elsevier.com/locate/radonline
Dosimetric verification of a commercial collapsed cone algorithm in simulated clinical situations Andrew Nisbeta,*, Ian Beangea, Hans-Stephan Vollmara, Catherine Irvineb, Andrew Morganb, David I. Thwaitesc a
Department of Medical Physics and Bioengineering, Raigmore Hospital, Highland Acute Hospitals NHS Trust, Inverness IV2 3UJ, UK b Department of Medical Physics, Cookridge Hospital, Hospital Lane, Leeds LS16 6QB, UK c Oncology Physics, Western General Hospital, Crewe Road, Edinburgh EH4 2XU, UK Received 31 October 2003; received in revised form 22 May 2004; accepted 24 June 2004
Abstract Background and purpose: This work reports a detailed study carried out in two UK radiotherapy centres of the dosimetric accuracy of the collapsed cone algorithm of a commercial treatment planning system (Helax-TMS) in simulated clinical situations. Materials and methods: Initially the accuracy of the collapsed cone algorithm in homogeneous media is evaluated for an extensive set of simple and complex fields. Water, lung and bone substitute epoxy resin material were then used to assess the algorithm in inhomogeneous media and compare its accuracy with the pencil beam algorithm currently in clinical use. Finally a semi-anatomic phantom and an anthropomorphic phantom were employed to assess the dosimetric accuracy using simulated clinical set ups. Thermoluminescence dosimeter (TLD) measurements were made with the anthropomorphic phantom and ionisation chambers otherwise. Nominal 4, 6 and 15 MV photon beams were studied. Results: For most homogeneous cases agreement between measured and calculated dose is within G2% or G2 mm. In cases with heterogeneities and simulated clinical situations it is observed that the accuracy is also generally within G2% or G2 mm. Specific instances where the difference between measured and calculated values exceed this are highlighted. Conclusions: It can be concluded that in clinical treatment planning situations where lung is present the collapsed cone algorithm should be considered in preference to pencil beam algorithms normally used but that there may still be some discrepancy between calculations and measurement. q 2004 Elsevier Ireland Ltd. All rights reserved. Keywords: Dosimetric verification; Collapsed cone algorithm; Treatment planning systems
1. Introduction It is universally accepted that a high degree of accuracy in dose delivery is essential for the success of radiotherapy. Following consideration of clinical data ICRU Report 24 [24] recommended that G5% accuracy was required in the delivery of absorbed dose to the target volume, but that G2% may be desirable in some clinical situations. Other reviews have led to recommended levels of accuracy in dose delivery of G3.5 and G3%, respectively [34,10]. ICRU Report 50 [25] has summarised the above by suggesting that * Corresponding author. 0167-8140/$ - see front matter q 2004 Elsevier Ireland Ltd. All rights reserved. doi:10.1016/j.radonc.2004.06.007
‘in the best technical and clinical conditions the degree of heterogeneity in dose to the Planning Target Volume (PTV) should be C7 and K5% of prescribed dose’. It is therefore, important that the uncertainty in each step in the treatment process is minimised. The dose calculation algorithm is an essential element of the treatment process and therefore requires extensive testing before being used clinically. It has been recommended that the accuracy of a dose calculation algorithm be in the range G2% in a low dose gradient or G2 mm in a high dose gradient [23], similar to other derived guidelines [2,4]. Ahnesjo¨ and Aspradakis [4] have reviewed the formalisms and algorithms for photon beam dose modelling in
80
A. Nisbet et al. / Radiotherapy and Oncology 73 (2004) 79–88
external beam radiotherapy. A number of studies have examined the accuracy of pencil beam algorithms [6,7,15, 16,22,29,30,31,33,35,37,41], indicating limitations in calculating the dose delivered in inhomogeneous media. For collapsed cone algorithms, where improved accuracy in inhomogeneous media is to be expected, Weber and Nilsson [42] have carried out evaluations in homogeneous and heterogeneous media for the Helax-TMS treatment planning system (Nucletron, Veenendaal, The Netherlands). A number of other studies have examined other treatment planning systems (TPS), predominantly the collapsed cone convolution implementation in the Pinnacle TPS (ADAC Laboratories, Milpitas, CA) [9,11,12,19,20,32]. The recently released versions of the Helax-TMS treatment planning software included modifications to the existing pencil beam model [5] with improved head scatter modelling [3] and also implemented a collapsed cone superposition convolution algorithm [1,5,36] for external photon beam treatment planning. This work reports a detailed study of the dosimetric accuracy of the Helax-TMS treatment planning system (Versions 5.1A, 6.0 and 6.1) using simple slab phantoms and, uniquely, simulated clinical situations with semi anatomic and anthropomorphic phantoms to quantitatively verify the collapsed cone model. Initially the dosimetric accuracy of the collapsed cone algorithm is evaluated in homogeneous media for an extensive set of simple and complex fields. Water, lung and bone substitute epoxy resin material are then used to assess the dosimetric accuracy of the algorithm in inhomogeneous media. Finally a semianatomic phantom and an anthropomorphic phantom are employed to assess the dosimetric accuracy using simulated clinical set ups.
in water to compare against the dose calculation model using simple and complex field arrangements. Absolute dose measurements for the reference field were performed in a water phantom using a NE2571 graphite walled cylindrical chamber (NE Technology, Beenham, UK) with thin perspex sheath and NE2570/1 electrometer. Measurements in the solid phantoms were taken using either a NE2571 graphite walled cylindrical chamber with a NE2570/1 electrometer or a PTW 23344 0.2 cm3 parallel plate chamber with a PTW Unidos electrometer (PTW, Freiburg, Germany). All chamber and electrometers have calibrations traceable to a national standards laboratory (National Physical Laboratory, Teddington, UK). 2.2. Phantom materials
All measurements were performed on Elekta Precise SLi linear accelerators (Elekta Oncology Systems Ltd, Crawley, UK) with nominal photon energies of 4, 6 and 15 MV, having quality indices of 0.635, 0.679 and 0.683, and 0.758, respectively. These linear accelerators have a 608 motorised wedge. The upper jaws are the Multi Leaf Collimators (MLCs) and back up diaphragms with perpendicular jaws below. At collimator 08 the MLCs move in the IEC 1217 X direction (cross-plane) and the wedge is in the IEC 1217 Y direction (in-plane) [26]. Unless otherwise stated, all measurements were carried out at collimator 08.
Several epoxy resin tissue substitute materials were employed; water substitute materials (RMI457 and RW3), a lung tissue substitute material (LN10), and 3 bone substitute materials (RB1, SB5 and IB7). RMI457 is manufactured by Gammex RMI, Wisconsin, the others by Radiation Physics, St Bartholomew’s Hospital, London. A 10 cm thick Styrofoam slab was also employed for some measurements. RMI457 and RW3 both have a density of 1.04 g cmK3. LN10 has a density of 0.31 g cmK3. RB1, SB5 and IB7 have densities (1.79, 1.84 and 1.19) g cmK3 respectively. Styrofoam has a density less than 0.1 g cmK3. The water equivalency of RMI457 has been reported elsewhere [8]. Investigations showed that RW3 was not completely water equivalent. In terms of relative depth dose, the agreement was excellent, though in terms of absolute dose at the same depth in each material, differences were observed. A fluence correction factor for RW3 was determined by experiment and where necessary applied to results to convert to dose to water. The correction factor for RW3 to water was 1.017 at a depth of 15.0 cm for a 6 MV beam. A semi anatomic phantom constructed from epoxy resin water substitute material with lung and bone substitute material inserts, representing the lungs, spinal cord, ribs and sternum was employed to assess the dosimetric accuracy of the algorithm in a simulation of a thoracic treatment. The phantom was manufactured by Radiation Physics, St Bartholomew’s Hospital, London [38–40]. The phantom consists of a number of cavities, which can either be filled with rods of the appropriate phantom material or an ionisation chamber cavity. A male anthropomorphic ‘Rando’ phantom [29] was also used to simulate a mantle and a breast treatment. This phantom has cavities for holding thermoluminescence dosimeters (TLDs).
2.1. Dosimetry equipment
2.3. Experimental geometries
A Wellho¨fer Blue Water Phantom (Wellho¨fer Dosimetrie, Schwarzenbruck, Germany), WP700 software and Wellho¨ fer 0.13 cm 2 IC15 ionisation chamber were employed to collect a comprehensive set of measurements
Central axis depth doses and in-plane, cross-plane and diagonal profiles were measured in a large water tank for open and wedged fields with varying focus to surface distances (FSDs), oblique incidence, irregular field shapes
2. Materials and methods
A. Nisbet et al. / Radiotherapy and Oncology 73 (2004) 79–88
81
Table 1 List of experimental set-ups in homogeneous media (water tank) Field set-up (A) 100 cm FSD, 5!5, 15!15 and 30!30 cm field sizes (open and wedge) (B) 80 cm FSD, 15!15 cm field size (open and wedge) (C) 120 cm FSD, 30!30 cm (open and wedge) (D) Gantry 408, collimator 2708, 90 cm FSD, 5!5, 15!15 cm (open and wedge) (E) MLC shaped ellipse, 90 cm FSD, various field sizes (open and wedged) (F) MLC shaped dog leg, 90 cm FSD, (open only) (G) LMPA shaped dog leg, 90 cm FSD, (open only) (H) Mantle type field with MLC and LMPA, 100 cm FSD, 30!30 cm (open) (I) Asymmetric field (half beam blocked), 90 cm FSD, 20!20 cm, blocked in non-wedge direction (open and wedge) (J) Asymmetric field (half beam blocked), 90 cm FSD, 20!20 cm, blocked in wedge direction (open and wedge)
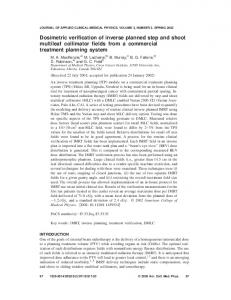
with MLCs and with low melting point alloy (LMPA) shaping, and asymmetric fields. The LMPA employed was MCP96 of 8-cm thickness (MCP, Wellingborough, UK). Table 1 lists the full set of measurements carried out. All relative measurements performed with the IC15 were normalised to the 10!10 cm reference field at 10 cm depth and 90 cm FSD to give absolute dose for direct comparison with calculation for 15 MV photons and 5 cm depth and 95 cm FSD (4 and 6) MV. Seven situations were designed to evaluate interface effects between different media, the effects of lack of backscattering material close to the beam exit side of a homogenous phantom and lack of side scattering material in a homogenous phantom for a tangential irradiation: (1) 12 cm of RMI457, (2) 9 cm of LN10 (lung tissue), (3) 9 cm of RB1, (4) sandwich of 5 cm RMI457, 5 cm LN10, 5 cm of RMI457, (5) sandwich of 5 cm RMI457, 5 cm RB1, 5 cm of RMI457, (6) sandwich of 5 cm RW3, 10 cm of styrofoam, 10 cm RW3 and (7) 5 cm RW3, 1 cm SB5 (hard cortical bone), 2 cm IB7 (inner bone), 1 cm SB5, 10 cm RW3. All of the above experimental setups were CT scanned with 5 mm spacings in order to enter density information within Helax-TMS. The parallel plate chamber was used to assess interface effects in RW3 immediately adjacent to lung and bone substitutes. Measurements to assess the effects of backscatter at the entrance surface of the bone substitute were carried out with the window of the parallel plate chamber facing this heterogeneity. This technique has previously been described by Hunt et al. [21]. Assessment of the modelling of lack of back and sidescatter due to missing tissue outside the patient contour was carried out using phantoms made of sheets of RW3 in 2 situations and planned using field sizes in the range 5.5–20 cm square. Beams were incident either normally or tangentially as shown in Fig. 1. The experimental set ups consisted of 16.5 cm of RW3, with the isocentre at a depth
Fig. 1. Experimental set-ups to study lack of back and side-scatter (a) beam incident normal to phantom (b) beam incident tangential to phantom.
of 15, 1.5 cm from the posterior (Fig. 1a) or the anterior (Fig. 1b) aspect of the phantom.. In both cases the FSD used was 85.0 cm. A simulation of a thoracic treatment was carried out with the semi anatomic phantom. In this test Helax-TMS generated dose distributions were based on CT data with 5 mm slice separation and 5 mm slice thickness. When phantoms are CT scanned and transferred to Helax-TMS a mapping of both density and tissue type is carried out based on the Hounsfield number [42]. If a standard conversion table is employed a systematic dose difference of up to 2% may be observed [13]. In order to ensure correct mapping the phantom materials were defined manually during outlining. In this instance 6 MV photon beams were used. A Mantle type treatment field was planned for the male anthropomorphic ‘Rando’ phantom.The phantom was CT scanned, using 5 mm slice thickness and 5 mm slice separation. As it was impractical to carry out manual outlining, automatic mapping was employed and checked for correctness. Single fixed field treatment plans for nominal 6 and 15 MV photons were generated using lung blocks combined with MLCs, to reduce the physical size of the blocks. The plans were normalised to the phantom’s midplane. A number of points (labelled A to I) within the phantom were selected for measurements. Fig. 2 illustrates the measurement points on the central slice. TLD measurements were carried out at these points using four 3!3!1 mm LiF Mg, Ti chips for each point. The TLD dose calibration was carried out, for each beam quality, by irradiating sets of TLDs to known doses over a suitable dose range. The reading to dose conversion was carried out using a linear interpolation after applying individual TLD element calibration factors and a background correction. A tangential breast treatment plan to treat chest wall was also calculated for the male anthropomorphic ‘Rando’ phantom. The phantom was again CT scanned using 5 mm slice thickness and 5 mm slice separation. A breast treatment using 6 MV photons and a matched plane technique with two tangential fields was employed. Fig. 3 illustrates the measurement points selected on the central slice. An uncertainty analysis has estimated the overall uncertainty as G3.5% for the TLD measurements (1 standard deviation (S.D.)).
82
A. Nisbet et al. / Radiotherapy and Oncology 73 (2004) 79–88
Fig. 2. Measurement points (A to G) on the central slice of the anthropomorphic phantom for a mantle type treatment.
2.4. Calculations For the collapsed cone algorithm with Helax-TMS Version 6.1 the agreement between calculated and measured dose in the buildup region is much improved compared with Version 5.1A, where significant discrepancies were present. The same input data set was used for both versions. The reason for this difference between versions is not known and indicates that upgrades of commercial software should be checked thoroughly prior to clinical use. With this exception dose distributions produced by Versions 5.1A and 6.1 are in general agreement and no distinction will be made between version in the following analysis. All dose calculations in the build up regions are done with the latest version. In addition
no systematic differences between measured and calculated dose with regard to photon energy were observed.
3. Results 3.1. Homogeneous media Table 1 lists the full set of measurements carried out in homogeneous media and describes the experimental set ups. The comparisons between calculated and measured doses are for point doses. In all cases central axis depth doses and in-plane, cross-plane and diagonal scans were measured for
Fig. 3. Measurement points (A to D) on the central slice of the anthropomorphic phantom for a breast type treatment.
A. Nisbet et al. / Radiotherapy and Oncology 73 (2004) 79–88
83
Table 2 Calculated doses versus measured doses for inhomogeneous media experimental set ups (slab phantoms) Set-up
Pencil beam
Collapsed cone
1. Solid water depth doses 5!5–20!20 cm 2. Solid lung depth doses 5!5 cm 3. Solid bone depth doses 5!5–20!20 cm 4. Water/lung/water 5!5–20!20 cm
Generally within G1.0% Overestimates by 3.0–9.0% Underestimates dose by approximately 2.0% In water generally within G2.0%. However in lung overestimates dose by 2–11% (increasing with field size) Underestimates by 3–4% in bone section and underestimates up to 3% in water Overestimates by up to 15% in lung section, and does not model rebuild up at lung/water interface
Generally within G1.5% Difference up to K4.5% Underestimates dose by approximately 3–7% In water generally within G2.0%. In lung underestimates by 1–6%. In second layer of water models build up slightly better than pencil beam In water generally within G2.0%. However underestimates dose in bone by 2.5–5.0% Underestimates by 2% at point measured in lung, and models rebuild up of dose beyond lung significantly better than pencil beam (within G2 mm) Underestimates region at water/bone interface by up to 8.5%. Models predicted dose within bone, and the rebuild up region beyond dose more accurately than pencil beam. However, overestimates dose in this rebuild up region by 3%
5. Water/bone/water 5!5–20!20 cm 6. Water/lung/water 10!10 cm
7. Water/hard bone/soft bone/hard bone/ water 10!10 cm
Underestimates region at water/bone interface by up to 6%. Does not model dose within bone, and overestimates dose at bone/water interface by w3%
The percentage differences are absolute percentages.
a variety of depths. For the asymmetric experimental set ups off-central axis depth doses and profiles were measured. All percentage differences are expressed in absolute terms in respect to the normalisation value inside the field. Set up A. In most cases agreement is to G2% or G2 mm, with smaller fields showing better agreement. The exceptions to this are for depth doses for wedged fields below 10 cm depth where calculated dose is less than measured dose by approximately 2.5–4%. The algorithm also underestimates the dose under the ‘hot’ end of the wedge by up to 4%. This discrepancy increases with field size. Set up B and C. In most cases agreement is to G2% or G 2 mm. However discrepancies are slightly larger than for set up (A) in the following two situations: depth doses with wedged fields below 10 cm; doses under the ‘hot’ end of the wedge. For the former case the differences are slightly larger than 4% and for the latter, calculated doses are less than measured by up to 4% for 6 and 15 MV and up to 8.5% for 4 MV. Set up D. For small fields agreement is within G2% or G2 mm. For larger fields’ wedge profiles the calculated dose under the ‘cool’ end of the wedge is less than measured by approximately 3% Set up E and F. Agreement is within G2% or G2 mm in all cases. Set up G. Agreement is within G2% or G2 mm in all cases, with the exception that the calculated dose is greater than measured under the blocks by 2–3%. Set up H. Agreement is within G2% or G2 mm in all cases. Set up I and J. Agreement is within G2% or G2 mm in all cases.
within G2%, although there are differences between calculation and measured values in the bone and lung equivalent material. Table 2 quantifies these differences. Fig. 4a illustrates a water/lung/water set up and shows that the collapsed cone algorithm is significantly better at predicting the interface build-up effects with
3.2. Inhomogeneous media There is generally good agreement between calculation and measured values in the water equivalent material, to
Fig. 4. Central axis depth dose curve for a 6 MV, 10!10 cm field through: (a) 5 cm RW3, 10 cm of styrofoam, 10 cm RW3 (b) 5 cm RW3, 1 cm SB5 (hard cortical bone), 2 cm IB7 (inner bone), 1 cm SB5, 10 cm RW3.
84
A. Nisbet et al. / Radiotherapy and Oncology 73 (2004) 79–88
Table 3 Difference between measured and calculated doses (%) showing effects of lack of back and side-scatter
Table 4 Differences between measured and calculated doses for the thoracic type treatment in the semi-anatomic phantom (%) for a 6 MV photon beam
Field size (cm)
PB
Point
PB
CC
Beam incident normal to 5.5!5.5 10!10 15!15 20!20
phantom K1.5 K1.2 K2.1 K2.7
A—Isocentre B—Target volume near lung C—Target volume D—Target volume E—Target volume near lung F—Spinal cord G—Outside target near field edge H—Outside target but in field
K1.9 K0.6 K2.1 K1.4 K0.2 C4.1 K5.0 C0.4
K1.9 K2.2 K2.0 K1.5 K1.4 C6.0 K4.4 C1.4
CC 0.0 0.2 K0.3 K0.5
Beam incident tangential to phantom 5.5!5.5 K1.1 10!10 K1.0 15!15 K1.9 20!20 K2.5
1.9 2.0 1.6 1.4
inhomogeneous media and the dose within the lung phantom material itself than the more commonly employed pencil beam algorithm. Das et al. [14] have indicated that for interface measurements of the beam qualities investigated in this study most plane parallel chambers can be used to measure dose accurately, although higher uncertainties will be present below 10 MV. Fig. 4b illustrates a water/bone/water set up. Close examination of the depth dose in RW3 before and beyond the SB5/IB7/SB5 composite where detailed build-up curves were obtained shows that both the collapsed cone and pencil beam models do not predict the interface zone well. In front of the bone substitute, both models underestimate the dose and beyond the bone, both models overestimate the dose. In areas remote from these interfaces, the agreement between collapsed cone, pencil beam and measured data is good. The results of the missing tissue scatter experiments (Table 3) demonstrate that the collapsed cone model
accounts correctly for lack of material behind the point of measurement, however there is little difference between the algorithms in terms of modelling missing tissue side scatter. 3.3. Semi-anatomic phantom Fig. 5 illustrates the dose distribution calculated by the collapsed cone model for the thoracic type plan. Table 4 quantifies the actual agreement between calculated and measured dose. For the thoracic plan the dose in the target volume was calculated to within G2.2%. The dose in the bone material at point F, representing the vertebral body, was overestimated by both algorithms by 6.0% for the collapsed cone. 3.4. Anthropomorphic phantom 3.4.1. Mantle type treatment Table 5 tabulates the difference between the calculated and measured doses for 6 and 15 MV.
Fig. 5. Collapsed cone distribution for 6 MV thoracic plan in semi anatomic phantom.
A. Nisbet et al. / Radiotherapy and Oncology 73 (2004) 79–88 Table 5 Difference between measured and calculated doses in the Rando phantom (%) Point A—Lung/mediastinum interface B—Mediastinum C—Lung D—Blocked lung E—Axilla F—Subcutaneous G—Spinal cord H—Midplane-10 cm sup I—Skin K—Midplane-12.5 cm inf. A—Near isocentre B—Lung C—Lung E—Mid chest wall F—Skin (chest wall) G—Medial entry I—Lung (outside field) K—5 cm superior of central axis
PB
CC
PB
position, this illustrates the high dose gradient region where tolerances of G2 mm are more appropriate, and which are met.
CC
Mantle 6 MV C4.9 K1.4
Mantle 15 MV C6.6 K2.1
C3.2 C7.9 K1.9 C5.4 K2.4 C0.8 C2.7 K4.1 C2.4
K0.2 C7.8 K3.7 K0.9 K1.6 K1.8 K2.5 K22.4 K3.0
C0.3 K0.3 C0.1 C1.0 K4.6 K1.9 C0.2 K47.6 K1.2
85
K2.7 K5.6 K0.3 K4.0 K0.7 K4.2 K4.2 K14.0 K5.4
Breast 6 MV 4.1 0.8 5.1 K1.6 4.9 K0.9 2.6 K2.3 17.3 K17.1 5.3 K7.9 K1.0 K2.8 2.1 K0.1
For 6 MV it is observed that the collapsed cone algorithm gives better agreement with measurement. With the exception of the points close to the surface, agreement with measured results is within G2%. The calculated skin dose is significantly higher than measured, however this is in a high dose gradient region and a more appropriate tolerance to be applied is G2 mm, which is met. The difference between pencil beam algorithm calculated doses and measured dose in and near the lung region and near the axilla, is from C4.9 to C7.9%, although the difference is within G3% in the middle of large soft tissue volumes. For 15 MV photons the difference between collapsed cone algorithm calculated doses and measured dose to soft tissue is K2.7% to K5.4%. The difference in dose to bone is K4.2%. The difference between calculated and measured dose to lung is K5.6%. The difference between pencil beam model calculated dose and measurement in and near lung is C6.6 to C7.8%. 3.4.2. Breast treatment Table 5 also illustrates the results for the breast treatment. It can be seen that in the breast tissue at depth the calculated to measured differences for the collapsed cone algorithm are from K0.1 to K2.3%, with the pencil beam algorithm the respective differences are C2.1 to C2.6%. In the lung tissue the calculated to measured differences for the collapsed cone algorithm are K0.9 to K2.8%, and with the pencil beam algorithm K1.0 to C5.1%, respectively. The dose calculation values for the skin are subject to large variations with small changes in
4. Discussion Discrepancies between measurement and calculation may arise due to inaccuracies in input measurements for the TPS which are used to characterise a model, inaccuracies in the verification measurements of the output of the TPS and inaccuracies in the dose calculation algorithm itself. Even with these sources of uncertainty it can be seen that for most homogeneous cases the doses calculated with the collapsed cone algorithm agrees within G2% or G2 mm of the measurements. There are exceptions to this even for homogeneous media and such instances should be considered during treatment planning. Subtle differences between different versions of the same software, e.g. build up dose with collapsed cone algorithm were noted following a software upgrade. As the same input data was employed to characterise the models it is assumed that this is due to modifications in the software. Such changes may not be explicitly stated by the manufacturer and thorough testing of software upgrades is required. The results from the simple slab phantoms demonstrate some interesting phenomena. The collapsed cone models the dose within lung, and the secondary build-up, which occurs beyond a lung-soft tissue interface much more accurately than the pencil beam model. At distances remote from the interface, the differences between both algorithms are less pronounced as noted by Engelsman [18], though the collapsed cone algorithm still exhibits a better agreement with measured data. It should be noted that styrofoam was used as a lung phantom material in this experiment. Styrofoam has a physical density of !0.1 g cmK3. The physical density of lung is generally taken to be 0.25 g cmK3. However, this is based on an average density of tissue found in the lung. In regions away from the mediastinum towards the pleura, the physical density drops. Examination of several CT studies of the thorax showed that in this region the CT number of lung may decrease to K890 to K900, as opposed to K700 to K750 in areas closer to the main bronchi. The CT number of styrofoam used in this case was K950 which was considered a suitable approximation for minimum tissue densities likely to be irradiated during thoracic radiotherapy. The agreement of the collapsed cone algorithm with measured data within 2–3 mm of a water/bone interface is not as good as in the region of a water/lung interface. The dose in the region of soft tissue immediately in front of the bone is not well modelled by either algorithm as they do not take account of electrons back-scattered from the bone equivalent material which result in an increase in dose on the entrance side of the interface. At the exit side of
86
A. Nisbet et al. / Radiotherapy and Oncology 73 (2004) 79–88
the bone, there is again a noticeable difference between measured and calculated data, which extends approximately 8–10 mm into soft tissue. There appears to be a small build up region in RW3 beyond the bone. This phenomena was described by Dutreix and Bernard [17], and is due to the pattern of dose deposition from electrons originating in bone and those originating from tissue immediately adjacent to the bone. The number of electrons originating from bone decreases with depth and the number of electrons originating in tissue increases. These two effects are not mutually compensating as electrons originating from bone will have undergone wider angle scattering in a higher Z material and be ejected from the bone in a more isotropic manner. Hence, there is an observed build up of dose. The collapsed cone algorithm models the transport of energy along fixed axes in the patient geometry, by scaling energy deposition in pre-determined cubic voxels according to the physical properties of the materials along the axis. For regularly spaced CT studies, the length of the voxel side is equal to the CT slice separation. The point dose kernels which the collapsed cone uses are pre-determined for unit density materials and then scaled according to the physical properties of the voxels in which energy is deposited. If the material involved is of a higher atomic number, then electrons released will be scattered through wider angles due to higher angular scattering power and the shape of the kernel will change. It is therefore not surprising that the model breaks down in these conditions. For lung substitute material of the approximately equivalent atomic number, the kernels are similar in shape and will be scaled correctly. It should be noted that phenomena which occur over a range which is less than the distance between the centres of two adjacent voxels may not be recorded [28]. For this reason, the smallest practicable CT slice spacing should be used for collapsed cone calculations. The collapsed cone dose within the bone material, though not measured, appears to follow the trend predicted in standard references, such as Johns and Cunningham [27]. The dose within bone drops due to a slight reduction in the number of electrons per gram found in bone compared to water/soft tissue. The effects of lack of scattering material demonstrate that the collapsed cone model accounts correctly for lack of material behind the point of measurement. The discrepancy between measured and calculated doses using the pencil beam model increases with increasing beam size. This is expected as the pencil beam model simply terminates the calculation at the exit contour, ignoring the contribution of effects of back-scattered photons and electrons, which will increase with increasing beam size. The collapsed cone model appears to correctly model the lack of radiant energy due to missing tissue beyond the beam exit side of the patient, though this may be of limited clinical meaning in many cases. The measurements in the epoxy resin slab phantom materials can be seen to be qualitatively similar to measurements in the semi-anatomic and anthropomorphic
phantom and are indicative of the dosimetric accuracy in inhomogeneous media. With regard to the accuracy in typical clinical situations it is observed that the accuracy in soft tissue substitute material is generally within G2%. However there are differences between calculation and measurements in lung and bone equivalent media. Within lung substitute material the pencil beam algorithm overestimates the dose to lung by up to 15% under the conditions investigated. The collapsed cone algorithm is closer to measurement, however underestimates of up to 6.0% are observed in some instances. It can be concluded that in clinical treatment planning situations where lung is present the collapsed cone algorithm should be considered in preference to the pencil beam algorithm but that there may still be some uncertainty in the collapsed cone calculations.
5. Conclusion This work has attempted to validate the accuracy of a newly available dose calculation model, the collapsed cone algorithm, on a commercial treatment planning system with dose measurements using simple and complex phantoms and by comparison with an established pencil beam model in simulated clinical set ups. It has been shown that the collapsed cone algorithm models the effects of lack of back-scatter material outside the patient contour and dose distributions in the region of lung/soft tissue substitute material more accurately than the pencil beam model. In the region of bone/soft tissue substitute interfaces, both models perform inadequately. This work suggests that the use of this algorithm in the clinic may reveal noticeable differences in tumour statistics in treatment plans for thoracic tumours. Poor modelling in the presence of bone poses a question over the added value of the collapsed cone algorithm relative to the pencil beam model in pelvic treatment planning. In its current implementation, collapsed cone calculation times are greater than desirable for routine clinical use. As an example based on currently available hardware, the calculation time to produce a treatment plan for an oesophageal tumour, using 60 CT slices and three fields takes approximately 6 min using the pencil beam model. This time increases by a factor of 5 when using the collapsed cone model. Nevertheless, it represents a significant advance in algorithm development. It is a valuable teaching tool, which highlights the kinds of differences in relative dose distribution and absolute dose accuracy found using newer generation dose models, which will eventually be dominated by Monte Carlo methods.
Acknowledgements The authors gratefully acknowledge the comments received on the manuscript revision by Dr Anders Ahnesjo¨
A. Nisbet et al. / Radiotherapy and Oncology 73 (2004) 79–88
and Dr Lars Weber. We would also like to acknowledge a paper by the Regional Medical Physics Group, Newcastle, UK, which complements the work of this paper and was published during revision of this manuscript (Aspradakis, MM, Morrison, RH, Richmond, ND and Steele, A. Experimental verification of convolution/superposition photon dose calculations for radiotherapy treatment planning. Phys Med Biol. 48 (2003) 2873–2893).
References [1] Ahnesjo¨ A. Collapsed cone convolution of radiant energy for photon dose calculation in heterogeneous media. Med Phys 1989; 16:577–92. [2] Ahnesjo¨, A. Dose calculation methods in photon beam therapy using energy deposition kernels. PhD Thesis, University of Stockholm; 1991. [3] Ahnesjo¨ A. Analytic modelling of photon scatter from flattening filters in photon therapy beams. Med Phys 1994;21:1227–35. [4] Ahnesjo¨ A, Aspradakis MM. Dose calculations for external photon beams in radiotherapy. Phys Med Biol 1999;44:R99–R155. [5] Ahnesjo¨ A, Saxner M, Trepp A. A pencil beam model for photon dose calculation. Med Phys 1992;19:263–73. [6] Ahnesjo¨ A, Saxner M, Thorslund I. Modelling of photon beam spectral variations. In: Schlegel W, Bortfield T, editors. Proceedings of the International Conference On the Use of Computers in radiation Therapy, XIII ICCR (Heidleberg, Germany, 2000). Berlin: Springer; 2000, p. 227–8. [7] Alam R, Ibbot GS, Pourang R, Nath R. Application of AAPM radiation therapy committee task group 23 test package for comparison of two treatment planning systems for photon external beam radiotherapy. Med Phys 1997;24:2043–54. [8] Allahverdi M, Nisbet A, Thwaites DI. An evaluation of epoxy resin phantom materials for megavoltage photon dosimetry. Phys Med Biol 1999;44:1125–32. [9] Arnfield MR, Siantar CH, Siebers J, Garmon P, Cox L, Mohan R. The impact of electron transport on the accuracy of computed dose. Med Phys 2000;27:1266–74. [10] Brahme¨ A. Dosimetric precision requirements in radiation therapy. Acta Radiol Oncol 1984;23:379–91. [11] Butson MJ, Elferink R, Cheung T, Yu PK, Stokes M, Quach KY, et al. Verification of lung dose in an anthropomorphic phantom calculated by the collapsed cone convolution method. Phys Med Biol 2000;45: N143–N149. [12] Butts JR, Foster AE. Comparison of commercially available three dimensional treatment planning algorithms for monitor unit calculations in the presence of heterogeneities. J Appl Clin Med Phys 2001; 2:32–41. [13] Cozzi L, Fogliata A, Buffa F, Bieri S. Dosimetric impact of computed tomography calibration on a commercial treatment planning system for external radiation therapy. Radiother Oncol 1998;335–8. [14] Das IJ, Kase KR, Meigooni AS, Khan FM, Werner BL. Validity of transition zone dosimetry at high atomic number interfaces in megavoltage photon beams. Med Phys 1990;17:10–16. [15] Davis JB, Pfafflin A, Cozzi AF. Accuracy of two- and threedimensional photon dose calculation for tangential irradiation of the breast. Radiother Oncol 1997;42:245–8. [16] Dunscombe P, McGhee P, Lederer E. Anthropomorphic phantom measurements for the validation of a treatment planning system. Phys Med Biol 1996;41:399–411. [17] Dutreix J, Bernard M. Dosimetry at interfaces for high energy X and gamma rays. Br J Radiol 1966;39:205–10.
87
[18] Engelsman M, Damen EM, Koken PW, van’t Veld AA, van Ingen KM, Mijnheer BJ. Impact of simple tissue inhomogeneity correction algorithms on conformal radiotherapy of lung tumours. Radiat Oncol 2001;60:299–309. [19] Francescon P, Cavendon C, Reccanello S, Cora S. Photon dose calculation of a three dimensional treatment planning system compared to the Monte Carlo code BEAM. Med Phys 2000;27: 1579–87. [20] Gifford KA, Followhill DS, Liu HH, Starkschall G. Verification of the accuracy of a photon dose calculation algorithm. J Appl Clin Med Phys 2002;3:26–45. [21] Hunt MA, Kutcher GJ, Buffa A. Electron backscatter corrections for parallel plate chambers. Med Phys 1988;15:96–103. [22] Hurkmans C, Kno¨o¨s T, Nilsson P, Svahn-Tapper G, Danielson H. Limitations of a pencil beam approach to photon dose calculations in the head and neck region. Radiother Oncol 1995; 37:74–80. [23] Institution of Physics and Engineering in Medicine and Biology (IPEMB). In: Shaw JE, editor. A guide to commissioning and quality control of treatment planning systems. New York: IPEMB; 1994. [24] ICRU (International Commission on Radiological Units) Report 24. Determination of absorbed dose in a patient irradiated by beams of X or gamma rays in radiotherapy procedures. Washington DC: ICRU; 1976. [25] ICRU (International Commission on Radiological Units) Report 50. Prescribing, Recording, and Reporting Photon Beam Therapy. Washington DC: ICRU; 1993 [26] International Electrotechnical Commission (IEC). Radiotherapy equipment, co-ordinates, movements and scales. IEC Report 1217; 1996. [27] Johns HE, Cunningham JR. The physics of radiology, 4th ed 1983 pp. 457–463. [28] Keall P, Hoban P. Accounting for primary electron scatter in X-ray beam convolution calculations. Med Phys 1995;22:1413–8. [29] Kleck JH, Smathers JB, Holly FE, Myers LT. Anthropomorphic radiation therapy phantoms: a quantitative assessment of tissue substitutes. Med Phys 1990;17:800–6. [30] Kno¨o¨s T, Ahnesjo¨ A, Nilsson P, Weber L. Limitations of a pencil beam approach to photon dose calculations in lung tissue. Phys Med Biol 1995;40:1411–20. [31] Kno¨o¨s T, Ceberg C, Weber L, Nilsson P. The dosimetric verification of a pencil beam treatment planning system. Phys Med Biol 1994;39: 1609–28. [32] Lydon JM. Photon dose calculations in homogeneous media for a treatment planning system using a collapsed cone superposition convolution algorithm. Phys Med Biol 1998;43:1813–22. [33] Malisan MR, Del Frate S, Foti C. dosimetric verification of a pencil beam algorithm for photon dose calculations in the presence of low density inhomogeneities. Phys Med Suppl 1997; 13:122–5. [34] Mijnheer BJ, Battermann JJ, Wambersie A. What degree of accuracy is required and can be achieved in photon and neutron therapy? Radiother Oncol 1987;8:237–52. [35] Ramsey CR, Cordrey IL, Spence KL, Oliver AL. Dosimetric verification of two commercially available three-dimensional treatment planning systems using the TG 23 test package. Med Phys 1999; 26:1188–95. [36] Saxner M, Ahnesjo¨ A. Implementation of the collapsed cone method for clinical beam qualities. Med Phys 1998;25:A185. [37] Shahine BH, Al-Ghazi MSAL, El-Khatib E. Experimental evaluation of interface doses in the presence of air cavities compared with treatment planning algorithms. Med Phys 1999;26: 350–5. [38] Thwaites DI. External audit in radiotherapy dosimetry. In: Faulkner K, Harrison RM, editors. Radiation incidents. London: BIR; 1996.
88
A. Nisbet et al. / Radiotherapy and Oncology 73 (2004) 79–88
[39] Thwaites DI, Powley, SK, Nisbet A, Allahverdi M. The UK radiotherapy dosimetry audit network. IAEA Proceedings Series. Standards and codes of practice in medical radiation dosimetry. IAEA-CN-96/81. (ISSN 0074-1884) Vol. 2, 183–190; 2003. [40] Thwaites, DI, Allahverdi, A, Nisbet, A. Ten years practical experience of the operation of a radiotherapy dosimetry audit system. Radiother. Oncol. Submitted for publication
[41] Van’t Veld AA. Analysis of accuracy in dose and position in calculations of a treatment planning system for blocked photon fields. Radiother Oncol 1997;45:245–51. [42] Weber L, Nilsson P. Verification of dose calculations with a clinical treatment planning system based on a point kernel dose engine. J Appl Clin Med Phys 2002;3:73–87.