Halina Kaczmarek, Sebastian Tyszkowski
GEOMORPHOLOGIA SLOVACA ET BOHEMICA 2/2009
THE USE OF THE AERIAL AND GROUND PHOTOGRAMMETRY IN THE JEZIORSKO RESERVOIR SHORE ZONE MONITORING (THE WARTA RIVER, CENTRAL POLAND) HALINA KACZMAREK*, SEBASTIAN TYSZKOWSKI** Halina Kaczmarek, Sebastian Tyszkowski: The use of the aerial and ground photogrammetry in the Jeziorsko Reservoir shore zone monitoring (the Warta River, Central Poland). Geomorphologia Slovaca et Bohemica, 9, 2009, 2, 2 figs., 9 refs. The Jeziorsko Reservoir was created between 1986-1992 on the Warta River, and it is one of the largest reservoirs on the Polish lowlands. The reservoir is 16 km long and its capacity exceeds 202.3 mln m3, the coast line has over 44.3 km. The banks are built with Quaternary glacial sediments (tills, sands and clays), and in a few places with Pliocene clays. Since 1992, when the filling was completed, the coast line has started the evolution of accumulation, abrasion and erosion processes. The high water level fluctuations during the exploitation of the reservoir amount to 5 m·y-1. Additionally, they intensify the natural coast transformations. The main goal of the researchers is to create a model of the coastal line evolution on the reservoir high water fluctuations. The paper aims at presenting the contemporary research methods based on the Geographical Information Systems (GIS), which may be used for supporting and analyzing the morphodynamic processes (geomorphological and fluvial) of reservoirs. Due to the fact there had been no earlier research, it was necessary to use a method which would give a competent quality and credibility measure of the changes. Authors have aimed to reconstruct the conditions of the bank dynamics since 1986. The following cartographic and photogrammetric materials were used: a topographic maps at a scale of 1:5000, 1:10000 aerial photographs taken in 1991 and 2004 and an orthophotomap from 2005 at 1:5000 scale. The ground photogrammetry was used to record the current processes in the coastal zone such as mass movements (topples, landslides) and bank erosion. Other data from field studies were collected by means of the Global Positioning System (GPS). The changes in the reservoir coastal zone detected on the aerial photographs were mainly situated in the highest bank zone. The ground photogrammetry is being used for current coast and abrasion monitoring. Images are working as stereopairs, are taken for stereoscopic analysis and as individually for the seasonal metric measurement. Thanks to the use of the GIS, the achieved horizontal mean accuracy was below 0.5 m for photogrammetry and 0.3-1.0 m for ground photogrammetry. At present, the database makes use of a mobile as well as a desktop GIS. Key words: photogrammetry, water reservoir, monitoring
INTRODUCTION
STUDY AREA
A very serious constraint on the research of the transformations ocurring within the artificial reservoir shore zone is the impossibility of the exact reconstruction of the shore zone initial condition. This prevents the evaluation of the shore zone change stage during the reservoir exploitation period as well as the changeability of its activity. A good solution to the above problem is a combination of the archive photogrammetric material analysis i.e. aerial photographs with field geodetic and GPS measurements in the GIS software environment. In the present article a few selected methods of the indirect and direct measurements, including their accuracy and aim, which have been used by the authors in the Jeziorsko Reservoir shore zone research will be presented.
The Jeziorsko Reservoir has been created as the result of the up-lifting of the Warta waters. The preliminary reservoir filling commenced in 1986, yet the full up-lifting range was not achieved until 1992 (STACHÝ ed. 1986, ORŁOWSKI 1999 and SZEWCZYK 2007). It is fourth in terms of capacity and second in terms of area artificial water reservoir in Poland. The Jeziorsko Reservoir lies within the Sieradz Basin and occupies the meridionally running section of the Warta valley. The direct surrounding of the basin includes up to 150 m a. s. l. (above sea level) - quaternary uplands (BANACH and GROBELSKA 2003). The territory lies in the edge zone of the Łódź Basin and the Przedsudecka Monoklin (KLATKOWA and ZAŁOBA 1992). Here the oldest formations include severely crushed upper-
———————– * Polish Academy of Sciences, Institute of Geography, Department of Geomorphology and Hydrology of Lowland, Kopernika 19, 87 - 100 Toruń, Poland, e-mail:
[email protected] ** Polish Academy of Sciences , Institute of Geography, Department of Geomorphology and Hydrology of Lowland, Kopernika 19, 87 - 100 Toruń, Poland, e-mail:
[email protected] 7
Halina Kaczmarek, Sebastian Tyszkowski
cretaceous marls which remain 5-40 m, locally 2-3 m, underneath. Cretaceous formations constitute a direct basis of Pleistocene formations that cover the area. They mainly include glacial and fluvioglacial forms of the Warta stadial Middle-Polish glaciation. Their thickness reaches 20 m. The forms remain under older fluvioglacial formations or directly on the clay of the maximum range of the stadial. The formations are frequently disturbed glaciotectonically. Only the maximum stadial local clays occur directly on the surface of the territory (KLATKOWA and ZAŁOBA 1992 or ZAŁOBA 1996). The reservoir shore zone consists mainly of boulder clays and Middle-Polish glaciation fluvioglacial forms as well as vistulian river silts. Locally they are accompanied with glaciolimnic sediments, clay slope washes and active slide colluviums. At low water levels on the reservoir the Warta slope washes are washed away by the waves. The process occurs at the top and middle part of the reservoir (BANACH and GROBELSKA 2003). After (SZEWCZYK 2007) the Jeziorsko Reservoir occupies the entire flat plain of the Warta. Depending on the water level the reservoir length varies from 16 up to 7 km given the 2.5 km width; the average depth equals 1.7 up to 5.2 m. At maximum up-lifting coordinate the reservoir area reaches 42.3 km2, whereas its capacity comes to 202.3 mln m3. At minimum levels the area reaches 19.6 km2 (at 17.6 km2 absolute minimum) and the capacity equals merely 36,4 mln m3 (at 30.2 mln m3 absolute minimum). This causes that, at allowed minimum water levels, over half of the basin area is periodically uncovered. The total length of the Jeziorsko reservoir shores at the maximum water level amounts to 44.3 km, of which more than 63 % unreinforced reservoir shores is active, i.e. it has got abrasive (56 %) or accumulative (7.0 %) character (BANACH and GROBELSKA 2003). METHODS So far the Jeziorsko Reservoir shore zone research had been quite irregular and had not embraced the initial stage of its formation. First study was done in 1999, i.e. after seven years since the beginning of the reservoir exploitation. Then M. Banach together with the author carried out a single cartography of the shore zone (BANACH and GROBELSKA 2003). The study was not resumed until 2008 and it is still being continued. The lack of the initial reservoir functioning period research prevented a direct analysis of the transformations which took place within its shore zone as a result of 8
GEOMORPHOLOGIA SLOVACA ET BOHEMICA 2/2009
the reservoir functioning as well as its present activity. In order to supplement the missing data, the authors carried out the analysis of the archive photogrammetric materials i.e. aerial photographs, combined with the field geodetic and GPS measurements taken in the GIS software environment. Below the applied methods, accuracy of the achieved figures as well as the evaluation of their usefulness in such research have been presented. In principle two measurement groups have been used in the research. The indirect measurements, based upon the image analysis, which enabled the reconstruction of the shore zone initial range and parameters and the direct measurements taken at present, directly in the field by means of a variety of geodetic devices as well as Trimble GPS-equipment. DIRECT MEASUREMENTS Geodetic measurements One of the most frequently applied methods in such research are traditional geodetic measurements by means of levellers, theodolites or, used for a dozen years, electronic tachymeters. The advantage of the former is the in-built electronic memory. This allows to read the achieved figures without the necessity of arduous reading calculations. Geodetic methods allow to achieve a few millimetre accuracy of the vertical and horizontal measurements, even in the big distance. Their advantage is the possibility of a simple tying to the existing geodetic network. The logistics of the measurement conduct, however, remains a problem. This requires the cooperation of at least two people. Equally problematic and often very burdensome is the transport of the equipment of considerable dimensions and weight frequently to inaccessible regions. The method, due to the high measurement accuracy, turns out to be perfectly useful in the case of the bench mark installation in places of a little dynamics, even such as slowly moving slides in the edge zones. GPS measurements Second of the applied direct measurement methods is the measurement of the current cliff edge position by means of an accurate GPSreceiver like the one used by the authors i.e. Trimble GeoXT GPS which makes use of the differential global positioning system (DGPS) signal corrections. At present on the majority of the Polish territory a free of charge reception from the ground reference station network is possible. A receiver which makes use of the DGPS corrections allows to eliminate the sate-
Halina Kaczmarek, Sebastian Tyszkowski
llite clock errors, ephemerae, ionospheric and trophospheric delays. Yet, before the measurement commencement it is advisable to check the time at which the satellite constellation will be most favorable (so-called PDOP value). The function is available in the standard receiver software as well as on numerous websites. The indisputable merit of the method is the quickness and easiness of the measurement. Within merely a dozen hours one person can easily place a few kilometer long section of the reservoir shore in the geographic coordinate system. The method enables to determine its location with the 0.3 - 0.7 metre accuracy. The „overlap” of the achieved measurements with the aerial photographs enabled the authors to evaluate the height of the existed transformations within the shore zone since the reservoir formation up to now. INDIRECT MEASUREMENTS Aerial photogrammetry Next of the applied methods in the hereby research was the aerial photogrammetry (KURCZYŃSKI and PREUSS 2000, BERNASIK 2000). The first stage of the work with aerial photographs includes their scanning. This is directly made on the source materials – photographic films. The scanning frequency equals 1800 pixels/inch which allows to transfer the entire information without the loss of data. The images are saved in TIFF-files, due to the lack of compression which does not contribute to the deterioration of their quality after consecutive savings and filterings. This, however, evokes the enlargement of images size to approx. 250 MB in case of black and white images and 700 MB in case of colour images. In the further edit stage the images are framed in order to decrease their size and consequently accelerate the software work. Taking into consideration the average size of the photographic film and the scan optical frequency, after the conversion into actual values, one pixel size equals 0.25 - 0.30 m. This is the value which determines the entire progress of further proceedings and the accuracy scale of the achieved figures in decimetre values. The factor which determines the usefulness of this method is the availability of the archive materials. In case of the Jeziorsko Reservoir the authors had two series of aerial photographs at disposal: – aerial photographs from 1991, taken in 1:27 000 scale. The images were taken a month after the first reservoir filling, which allows to fully reconstruct its shore zone in the initial period of the reservoir functioning, – aerial photographs from 2004, taken in 1:26 000 scale.
GEOMORPHOLOGIA SLOVACA ET BOHEMICA 2/2009
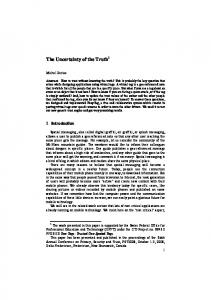
It must be emphasized that the orthophotomap is the best possible material at this stage of the analysis. A good quality material of this kind is deprived of errors resulting from the image inclination and deformation in the field shape. Thereafter, the image is fitted in the given geographical coordinate systems. Unfortunately, materials of such kind are uncommon, exist only for the selected areas and frequently apply to merely one raid. The next stage of the analysis is the image rectification. If it is possible, at this stage orthophotomap coordinates are used, for instance the GEOPORTAL (2009), to which, on the basis of the convergence of the characteristic points further photogrammetric materials are matched. If the orthophotomap is inaccessible the fitting can be done on the basis of the surmeasurements to the geodetic plans, or after determining the coordinates of the characteristic points directly in the field. For this the geodetic measurements with tachymeters or GPS receivers are used. The rectification is carried out by means of the GIS software. During the rectification the information about the root square mean errors (RMSE) material fitting is achieved. The RMSE represents the difference between the original control point and the new control point locations calculated by the transformation process. The error achieved by a good operator – by means of a dozen rectification points, should not wander from a pixel size that is 0.3 metre in the analysed case. Aerial photographs often constitute the only possibility of the studied shore zone reconstruction and allow to evaluate its dynamics in a long time period. Furthermore, the method enables to evaluate the transformations on vast areas. During the observation additional information, inaccessible or difficult to grasp in case of the traditional cartography, about the field is revealed. The method allows to analyse the bay overgrowing (vegetation) tempo, the ephemeral form presence, and the lifted water level influence (changing) on the vegetation. The aerial photographs, however, bring about some inadequacies. One should pay a peculiar attention to the location of the studied area modelled on the image in respect of the camera centre. The adjoining territories remain unchanged, yet the extreme image fragments, especially the inclined areas (steep shores, cliffs) might undergo a seeming transformation (Fig. 1). Yet, the greatest constraint resulting from the aerial photograph use is a different time span of the analysed periods. It is completely dependent on the existing aerial photographs 9
Halina Kaczmarek, Sebastian Tyszkowski
GEOMORPHOLOGIA SLOVACA ET BOHEMICA 2/2009
Fig. 1 Aerial photogrammetry connections with camera axis on whose „take-time” we usually have no influence. The ordinary image are taken at various time intervals and in different seasons. Due to the fact, it is difficult on their basis to determine the process tempo (cm/year) in a specific period, e.g. a month because the intervals between consequent image series reach a few years and the studied process has got irregular character – that is why one should especially remember that the achieved value, e.g. the cliff edge movement, is thus the arithmetical average value of the given analysed period. Furthermore, the images taken during the vegetation period also make the exact determination of the shore zone details difficult or even impossible. Each time one should also have at one’s disposal the relation of the reservoir water levels (height in metres above sea level) with the dates of the taken images. The information should be taken into account and compared with the earlier introduced hypsometric base. This enables to determine the abrasion or accumulation pace, and at an image of high qua-lity, also indicate the characteristic forms in the shore zone. A very serious problem in the research of big water reservoirs is their size. A personal penetration of the shore zone to its full extent frequently requires a dozen day-field study and in case of extremely vast objects it is implausible. When the analyzed photogrammetric materials embrace a vast area (a territory of a considerable extent) there exists a way to automate the recognition of the initial stage of active zones. The attention is then drawn to the distinguishing of the active zones i.e. the areas cha10
racterized by a respectively light photofone, which are typical of inter alia active cliffs that are subject to abrasion. The method is based on the grey tone balance (0 — 255) within the shore zone on two consequent aerial photograph series. The value ranges might change during the filtering, yet for the entire image series they should be proportional. The software functions for the raster analysis used indicatorily to calculate the field shape changes might be set in such a way so that they would show the movement of the active shore section. The inactive area, covered with vegetation, is characterized by a grey-moderate photofone, in grey tones with 110-130 values, whereas fresh cliffs and slides represent 58 - 85 values. One should then automatically search the pixels on the rasters where the tone change equals 25 up to 40. The method is still worked on by the authors, yet it potentially augurs huge possibilities. However, a definite condition here is keeping an appropriate accuracy, the source material quality and the operator precision, especially in the process of the rectification. SUPPLEMENTARY WORKS During the field work documentation the authors also applied one of the ground photogrammetric methods i.e. the anaglyph image taken by means of digital cameras. This is based on the registration of the image of the same object (cliff, shore fragment, slide) on two consequent images, keeping parallel target axes, simultaneously moving the camera perpendicularly to the target axis at 0.2 — 0.5 metre. In
Halina Kaczmarek, Sebastian Tyszkowski
GEOMORPHOLOGIA SLOVACA ET BOHEMICA 2/2009
Fig. 2 Abrasion of banks from 1991 to 2008 y, Jeziorsko Reservoir + – DGPS measure the achieved in this way images respectively, blue (RGB) canal in the left and red canal in the right image is deleted. Next they are overlapped to create an anaglyph. While observing such a mosaic through glasses with blue and red filter a three-dimensional effect is achieved. The method, though, does not allow to take measurements, still constitutes a very precious and quick documentation enabling tracing the shore zone transformations in camera conditions. Making such documentation takes a similar amount of time as the traditional photography, yet after interpretation it allows a distinctly greater perception. RESULTS The information achieved as a result of the above method application as well as the measurement figure both indirect and direct have been collected in the GIS database and subjected to further edit. The overlap of the archive cartographic materials, topographic maps and aerial photographs, as well as contemporary field measurements allowed to reconstruct the transformations within the Jeziorsko Reservoir shore zone since its formation up to now and in two sub periods: 1991-2004 and 2004 2009 (Fig. 2). The accuracy of the shore zone transformation readings by means of the above mentioned techniques practised by the authors, at high security tolerance and evident objects, reaches 0.5 up to 1.5 metre. In specific cases the accuracy equals even 0.2 to 0.3 metre. The values for the Jeziorsko Reservoir analysis are completely sufficient. The created measurement database might easily be extended with new field measurements in the forthcoming years.
CONCLUSION The applied by the authors methodology of combining the indirect and direct measurements and their study in the GIS software environment gives satisfactory effects in the research of the Jeziorsko Reservoir shore zone development. The above study course might be successfully used on different, larger objects of such kind. The indisputable advantage of the method applied by the authors is the easiness of the information exchange among other users of the materials. This concerns both the scientific workers doing research and observations as well as the administration and technicians taking care of the service and exploitation of reservoirs. Common GIS platforms save time of the information transfer and allow to extend the databases and membership to the geographical space. ACKNOWLEDGMENTS The work has been done under financial support of Ministry of Science and Higher Education, Project No. N N306 0330 33. REFERENCES BANACH, M., GROBELSKA, H. (2003). Stan dynamiki brzegów zbiornika Jeziorsko [The dynamics of Jeziorsko Reservoir shore zone]. Słupskie Prace Geograficzne, 1, 91 – 106. BERNASIK, J. (2000). Elementy fotogrametrii i teledetekcji [Elements of photogrammetry and remote sensing]. Uczelniane Wydawnictwa Naukowo-Dydaktyczne, Wydawnictwa 11
Halina Kaczmarek, Sebastian Tyszkowski
Naukowe: Akademia Górniczo-Hutnicza im. Stanisława Staszica, Kraków, 93 p. GEOPORTAL (2009). On-line [December 8th 2009]. KLATKOWA, H., ZAŁOBA, M. (1992). Szczegółowa mapa geologiczna Polski [Comments for Detailed Geological Map of Poland] 1:50 000, arkusz Warta. Państwowy Instytut Geologiczny, Warszawa. KURCZYŃSKI, Z., PREUSS, R. (2000). Podstawy fotogrametrii [Photogrammetry elements]. Oficyna Wydawnicza Politechniki Warszawskiej, Warszawa. ORŁOWSKI, W. (1999). Techniczna charakterystyka zbiornika retencyjnego Jeziorsko na Warcie [Enginery description of Jeziorsko Reservoir on the Warta River]. Konferencja Naukowo-Techniczna „Eksploatacja i oddziały-
12
GEOMORPHOLOGIA SLOVACA ET BOHEMICA 2/2009
wanie dużych zbiorników nizinnych (na przykładzie zbiornika wodnego Jeziorsko)“. (Uniejów, Poland, 20-21 May 1999), 7 – 17. STACHÝ, J., ed. (1986) Atlas hydrologiczny Polski [Hydrological Atlas of Poland]. Wyd. Instytutu Meteorologii i Gospodarki Wodnej, Warszawa. SZEWCZYK, G. (2007). Zbiornik Jeziorsko. Regionalny Zarząd Gospodarki Wodnej, Poznań. ZAŁOBA, M. (1996). Ślady oscylacji lądolodu warciańskiego we wschodniej częsci międzyrzecza Warty i Prosny [Traces of the Wartian ice sheet oscillation in the eastern part of the region between the Warta and Prosna Rivers]. Acta Geographica Lodziensia, 71, 275 – 287.