Mar 31, 2015 - Drought indicators: monitoring, forecasting and early warning at the case study scale ..... availability of data and the choice of drought indicators ...
Technical Report No.33
DROUGHT INDICATORS: MONITORING, FORECASTING AND EARLY WARNING AT THE CASE STUDY SCALE 3
Standardised index Índice estandarizado
2
1
0
-1
-2
Precipitation (SPI) Precipitación
Streamflow (SWI) Aportación
Volume Stored in Reservoirs (SRI) Nivel de almacenamiento
Red levelRojo Nivel
Orange level Nivel naranja
Oct-04
Oct-03
Oct-02
Oct-01
Oct-00
Oct-99
Oct-98
Oct-97
Oct-96
Oct-95
Oct-94
Oct-93
Oct-92
Oct-91
Oct-90
Oct-89
Oct-88
Oct-87
Oct-86
Oct-85
Oct-84
Oct-83
Oct-82
Oct-81
Oct-80
Oct-79
Oct-78
Oct-77
Oct-76
Oct-75
Oct-74
Oct-73
Oct-72
Oct-71
Oct-70
-3
Black level Nivel negro
Reservoir volume (Hm3)
1600 1400 1200 1000 800 600 400 200 0 100
90
80
70
60
50
40
Non‐exceedance probability (%)
30
20
10
0
Author names: Joaquín Andreu, David Haro, Abel Solera, Javier Paredes, Dionysis Assimacopoulos, Wouter Wolters, Henny A.J. van Lanen, Eleni Kampragou, Carlo Bifulco, Alessandro de Carli, Susana Dias, Itziar González Tánago, Antonio Massarutto, Dario Musolino, Francisco Rego, Irmi Seidl, Lucia De Stefano, Julia Urquijo Reguera
Date: 31 March 2015
DROUGHT-R&SPI (Fostering European Drought Research and Science-Policy Interfacing) is a Collaborative Project funded by the European Commission under the FP7 Cooperation Work Programme 2011, Theme 6: Environment (including Climate Change, ENV.2011.1.3.2-2: Vulnerability and increased drought risk in Europe (Grant agreement no: 282769). The DROUGHT-R&SPI project started 01/10/2011 and will continue for 3 years.
Title: Authors:
Drought indicators: monitoring, forecasting and early warning at the case study scale Joaquín Andreu, David Haro, Abel Solera, Javier Paredes, Dionysis Assimacopoulos, Wouter Wolters, Henny A.J. van Lanen, Eleni Kampragou, Carlo Bifulco, Alessandro de Carli, Susana Dias, Itziar González Tánago, Antonio Massarutto, Dario Musolino, Francisco Rego, Irmi Seidl, Lucia De Stefano, Julia Urquijo Reguera
Organisations:
Universidad Politecnica de Valencia, Spain (UPVLC) National Technical University of Athens (NTUA) University Complutense of Madrid, Spain (UCM) Universita Commerciale ‘Luigi Bocconi’ Italy (UB-CERTeT) Instituto Superior de Agronomia, Portugal (ISA-CEABN) ALTERRA, The Netherlands Wageningen University, The Netherlands (WU) Eidgenössische Forschungsanstalt (WSL)
Submission date:
31 March 2015
Function:
This report is an output from Work Package 2 Drought impacts, vulnerabilities, risk reduction and response options: small scale (case studies), Task 2.7 Identification of relevant indicators at CS scale, monitoring, forecasting and early warning
Deliverable
DROUGHT-R&SPI deliverable D2.8 Drought indicators for drought early warning - case study scale.
Technical Report No. 33
- ii -
Preface Task 2.7 concerned Objective 5 of WP 2, which comprised the “assessment of the applicability of drought monitoring and early warning indicators at different scales (local, river basin and national), and the development of recommendations for their refinement to support decision‐making”. The implementation of Task 2.7 is strongly linked to Work Packages 1 and 3 (WPs 1 and 3). These work packages seek to define guidelines and appropriate indicators for drought monitoring and early warning at the European scale (e.g. D1.4 and D3.6). On this regard, Task 2.7 strives to associate monitoring guidelines and indicators proposed by WP 1 and WP 3 with monitoring requirements at the level of the individual Case Studies. It should also suggest ways through which European drought monitoring data can be used to produce drought monitoring indicators at the Case Study level (see also D1.5). In the above context, three main Activities were distinguished for Task 2.7:
Activity 1 referred to the mapping of monitoring requirements at the Case Study level, including a review of the monitoring systems and indicators already in place; Activity 2 referred to the screening of indicators and monitoring recommendations suggested by WP 1 and WP 3 to identify those that are most relevant and can complement/be useful for drought monitoring at the Case Study level; Activity 3 referred to development of recommendations for drought early warning at the Case Study scale, combining the outcomes of Activities 1 and 2.
The report discusses methodological aspects and proposes a roadmap for the task implementation. Several countries/river basins have a long tradition in drought monitoring; in others, the establishment of monitoring indicators and systems is being pursued, as a result of the increased awareness on drought impacts. Given the large number of available indicators, Activity 1 first reviewed the monitoring systems that are already in place or are foreseen in forthcoming Drought Management Plans, developed as part of the WFD implementation process. This involved the collection of data and information on:
Indicators used for drought monitoring (meteorological, hydrological and agricultural drought), and the relevant thresholds (triggers) set to identify drought severity levels; Information systems put in place for the collection of appropriate data; Operational rules in place and responses foreseen according to the measured drought severity levels.
The final outcome of the activity was a document summarizing existing monitoring schemes and requirements for each Case Study (DROUGHT‐R&SPI Technical Report No. 6). Activity 2 was aimed at analyzing whether the Guidelines for drought monitoring and early warning (WP 1 output – Deliverable 1.4) and the Recommendations for indicators for monitoring and early
Technical Report No. 33
- iii -
warning (WP 3 – Deliverable 3.6) can support/be associated with drought monitoring at the Case Study scale. For this purpose, the following needed to be considered:
Case Study specificities (T2.1, T2.2 and Activity 1 output), i.e. whether the proposed indicators can address the main issues of concern in the Case Studies in terms of drought characteristics and impacts, and whether relevant information can be linked to the existing drought monitoring schemes. Data requirements, i.e. whether proposed indicators can be measured or calculated in the Case Studies.
In addition to the preliminary screening, which was performed by the local Case Study leaders in each particular task of the project, suggested indicators also need to be discussed with local decision‐makers and risk experts, in order to i) identify any further issues, such as human and technical capacity constraints, and ii) judge the usefulness of the WP 1 and 3 suggestions. This latter was done through the Case Study specific Drought Dialogue Fora. Finally, Activity 3 was aimed at synthesizing the outcomes of Activities 1 and 2, in order to produce recommendations for drought monitoring at the Case Study level, while linked to European‐wide monitoring suggestions. In this regard, the final output addresses the following aspects:
Drought monitoring and early warning requirements at the Case Study scale (i.e. which type of indicators, what type of data, ways through which information should be presented to decision‐ makers and the public); Organizational framework requirements, in case that no drought monitoring system is in place or system enhancement is required; Which drought monitoring data at the European scale can be used for drought monitoring at the Case Study level, and vice versa (depending on whether local‐scale events can be correlated to larger scale ones).
Recommendations stemming from Activity 3, in combination with the review of existing drought monitoring systems will form the final output of the task.
Technical Report No. 33
- iv -
Table of contents Preface ..................................................................................................................................................... iii List of figures ........................................................................................................................................... vi List of tables ........................................................................................................................................... vii 1.
Introduction ..................................................................................................................................... 1 1.1.
Drought, aridity, and water scarcity. ....................................................................................... 1
1.2.
Drought as a natural hazard .................................................................................................... 3
1.3.
Environmental impacts of droughts ........................................................................................ 4
1.4.
Human dimension and Impacts of droughts ........................................................................... 4
1.5.
Time scales and the space factor in the analysis of operative droughts................................. 7
1.6.
Data availability and suitability. .............................................................................................. 8
2.
Review of current drought monitoring systems and identification of monitoring requirements .. 9
3.
Screening of WP1 & WP3 guidelines and suggestions on drought monitoring and early warning 11
4. Applicability of indicators for drought monitoring, forecasting and early warning at the basin and regional scale ......................................................................................................................................... 13 4.1.
Examples of application of drought indicators at the Jucar River Basin Case of Study ........ 14
4.1.1.
Use of drought vulnerability criteria for water resources planning .............................. 15
4.1.2.
Use of standardized indices and runs theory for drought characterization ................. 16
4.1.3. Use of the Spanish Standard Operative Drought Monitoring Indicators for the Jucar River Basin ..................................................................................................................................... 22 4.1.4. Drought Monitoring Maps and integration in the Spanish National Drought Monitoring System 23 4.1.5.
Use of AQUATOOL DSSS for Real Time drought management ..................................... 25
4.1.6.
Latest advances in Real Time Drought monitoring and scenario definition based on Risk 27
4.2. 5.
Conclusions and final recommendations ...................................................................................... 40 5.1.
6.
Examples of application of drought indicators at the Netherlands Case of Study ............... 31
General Recommendations ...................................................... Error! Bookmark not defined.
References ..................................................................................................................................... 44
Technical Report No. 33
-v-
List of figures Figure 1. Evolution of drought from natural to human related. Source: Villalobos (2007) .................... 5 Figure 2. Drought monitoring and early warning is a trade‐off between the monitoring objective, the availability of data and the choice of drought indicators (Gudmundsson et al 2014) .......................... 12 Figure 3. Drought vulnerability calculation process used in the Jucar River Basin ............................... 16 Figure 4. Conceptual model of PATRICAL (adapted from Villalobos 2007) ........................................... 17 Figure 5. Spatial distribution of the Jucar River Demarcation for the calculation of standardized drought indices .................................................................................................................................................... 18 Figure 6. Regional distribution of Jucar River Demarcation .................................................................. 18 Figure 7. Standardized drought indices for an aggregation period of 6 months in the Jucar River Basin ............................................................................................................................................................... 19 Figure 8. Standardized drought indices for an aggregation period of 12 months in the Jucar River Basin ............................................................................................................................................................... 20 Figure 9. Standardized drought indices for an aggregation period of 24 months in the Jucar River Basin ............................................................................................................................................................... 20 Figure 10. Standardized drought indices for an aggregation period of 48 months in the Jucar River Basin ............................................................................................................................................................... 20 Figure 11. Correlation coefficient between Standardized Precipitation Index (SPI) and Soil Moisture Content (SSMI) ...................................................................................................................................... 21 Figure 12. Correlation coefficient between Standardized Precipitation Index (SPI) and Streamflows (SWI) ...................................................................................................................................................... 21 Figure 13. Correlation coefficient between Standardized Precipitation Index (SPI) and Water Storage (SRI) ....................................................................................................................................................... 21 Figure 14. Evolution of the State Index of the Jucar River basin from October 2001 to September 2009 (source: self‐elaboration with data provided by CHJ) ........................................................................... 23 Figure 15. SODMI for the CHJ basins corresponding to March 2006, January 2007 and March 2009 (from left to right). (Source: Andreu et al, 2013) ............................................................................................ 24 Figure 16. Spanish Drought Monitoring System maps for selected dates. (Source: Andreu et al, 2013) ............................................................................................................................................................... 24 Figure 17. Scheme of the risk assessment methodology used in the Jucar River basin (SIMRISK) ....... 26 Figure 18. Deterministic (above) and probabilistic (below) forecasts for the reservoir storage evolution in 2006 campaign. (source: andreu et al, 2013) .................................................................................... 27 Figure 19. Water storage probability distribution for the month of September calculated from the previous October ................................................................................................................................... 28 Figure 20. Water Storage probability distributions for the month of September calculated from all the previous months (source: Haro, 2014) .................................................................................................. 29 Figure 21. Risk based monitoring methodology (source: Haro, 2014) .................................................. 30 Figure 22. Evolution of the state index in the Jucar River system calculated from the simulated volumes (blue), from OPTIRISK results (dashed black), and official CHJ values (black), compared to the drought scenario thresholds. (source: Haro, 2014) ............................................................................................ 31
Technical Report No. 33
- vi -
List of tables Table 1. Drought monitoring and declaration in the Case Studies (adapted and updated from Assimacopoulos et al 2013 and updated) ............................................................................................... 9 Table 2. Recommendations for further improving drought monitoring in Case Studies (Assimacoppoulos et al 2013) ............................................................................................................... 10 Table 3. Percentile and SPI equivalent values to the CHJ drought status ............................................. 19
Technical Report No. 33
- vii -
1. Introduction Even though Task 2.7 is a at the final confluence of other tasks included in WP1, WP2 and WP3, and many terms and concepts related to drought definition, characterization, monitoring, early warning, planning, management, and mitigation, as well as to vulnerability and risk, have been used through the work developed in DROUGHT R&SPI project and reports and deliverables produced, it is necessary, and convenient to further review and tint some of those terms and/or concepts in order to reflect the adaptation needed in reality to produce and explore the way from research and science to policy making, and to drought planning and management at the case study level. In the next sections, an attempt is made to illustrate the difficulties inherent to the task of identification of relevant indicators at Case Study (CS) scale, for monitoring, forecasting and early warning, and relating these indicators to Pan EU indicators, and to future drought vulnerability. In addition, an attempt is made to provide a basis for a systematic assessment that could lead to recommendations on drought indicators for drought monitoring and early warning at the case study scale.
1.1.
Drought, aridity, and water scarcity
Sometimes, simple concepts tend to be difficult to be framed by science and mathematics. This is indeed the case for drought. If we look into a dictionary, we find a short description, which somehow catches quite well the concept: "a period of dryness especially when prolonged; specifically: one that causes extensive damage to crops or prevents their successful growth" But, as we try to study and characterize droughts, we find difficulties trying to address the different types of droughts in regions with different climate, different geology, and different land uses. Also difficult are the integration of different scales of study and the inter‐comparison of droughts in different regions, which usually are information that policy makers at supra‐regional levels (for instance, mid to large size countries, and EU) would like to have available in order to take decisions. Moreover, the studies and the practices related to drought are interacted and maybe confused with other water related concepts, such as aridity and water scarcity. Again, simple definitions of aridity and scarcity can be found in a dictionary: ‐ "Arid: excessively dry; specifically: having insufficient rainfall to support agriculture". ‐ "Scarce: deficient in quantity or number compared with the demand: not plentiful or abundant (Examples of Scarce: '...Food was getting scarce during the drought ...')". From the dictionary, a drought is clearly an event (... a period of time...) with impacts, but aridity and scarcity are features. Nevertheless, in the definition of scarcity, nothing is said about if it is permanent or temporary. And, interestingly enough, the given example refers to scarcity during drought. Therefore, it is not strange that general public, policy makers, and even some scientists and Technical Report No. 33
-1-
practitioners, mix up the concepts of water scarcity and drought, since it is legitimated by the use of the language. Having said this, many scientists like to make a distinction between those three concepts in order to separate the time dimension, from the climate dimension, and from the human demand dimension, as already stated in documents provided by the project. Droughts are consequence of time (and space) variability of hydro‐meteorological elements, while aridity is a quasi‐permanent (long term) characteristic due to climate. And the use of "water scarcity" that is made in DROUGHT R&SPI project is also as a quasi‐permanent (long term but could also be mid‐ term) related to human activities dependent on water availability. These distinctions are necessary, since they constitute essential characteristics of some of the cases of study, and as shown in previous reports of the project, characteristics of droughts are different within regions, depending on statistical characteristics such as frequency, intensity, and duration of below normal water availability. Also, in the work and reports produced in WP 2, and particularly in Task 2.7, and Deliverable 2.8, it is shown that, even though the three concepts can be distinguished, aridity and water demand (and hence, water scarcity) can be tied to some characteristics of natural droughts and to characteristics and management of socio‐economic droughts. For instance, droughts in arid and semi‐arid regions, like some parts of Portugal, the Jucar River Basin, and Syros island cases of study considered in DROUGHT R&SPI project, are distinguished by their long duration (up to several years), and high intensity. In addition, their impacts are exacerbated by high water exploitation indices (i.e., water scarcity) (Andreu et al., 2013). Scientific literature has traditionally classified droughts into four main categories (Wilhite and Glanz, 1985; Tallaksen and Van Lanen, 2004; Mishra and Singh, 2010) including:
Meteorological droughts, defined as abnormally low precipitation over a region for a period of time.
Agricultural droughts occur when there is a moisture deficit in the soil to meet the growing needs of a particular crop at any stage of growth.
Hydrological droughts, related to the decrease in water flows and storages, including also artificial reservoirs, and groundwater, so they are not adequate to provide water resources to established water uses.
Socio‐economic droughts occur when the water shortage affects people and economic activities.
But, in our opinion, it is better to separate natural droughts from human related droughts in order to give more consistency to the definition and use of drought indicators and indices, and drought monitoring, as we explain in the following sections. Technical Report No. 33
-2-
1.2.
Drought as a natural hazard
A commonly used definition of drought relates to below average precipitation (meteorological drought). The impacts of meteorological drought depend on spatially varying soil moisture holding capacity and vegetation characteristics. And therefore, on river basin characteristics (Peters et al., 2003; Mishra el al., 2011; Van Lanen et al., 2013) As a result, meteorological drought is transformed by nature into soil moisture anomalies (soil moisture droughts) and into hydrological droughts (below normal flows in rivers and springs, below normal storage in natural lakes and aquifers). This can affect riparian vegetation and ecosystems related to river, springs, lakes, or wetlands environments. So far, we can define and study all these types of droughts (meteorological, soil moisture, and hydrological) without introducing the human dimension. And we also can investigate about the impacts of these droughts on natural ecosystems. But, in theory, no action is necessary from mankind, since these droughts are used by nature to shape ecosystems. WP 1 of DROUGHT R&SPI project has studied drought as natural hazard, and the main outcomes that can be of interest to Task 2.7 and Deliverable 2.8 are the following (Tallaksen et al., 2015):
The two main meteorological indicators that allow comparisons across climate regimes and seasons are the Standardized Precipitation Index (SPI; McKee et al. 1993), as a meteorological drought index, and the Standardized Precipitation‐Evapotranspiration Index (SPEI; Vicente‐ Serrano et al., 2010), as a measure of anomalies in the climatic water balance (precipitation minus potential evapotranspiration). The SPEI provides an improved identification of drought in drier, southern Europe, whereas SPI events tend to be located in wetter, northern regions where precipitation is a larger driver of drought than temperature (Kingston et al., in press). Event‐based composite analysis of the most widespread European droughts revealed that a higher number are identified by the SPEI‐6 than by the SPI‐6, with SPEI‐6 drought events showing a greater variety of locations and start dates. Most drought events in Europe are caused by a prolonged deficit in precipitation, but in cold climates, temperature anomalies also play a role in the development of hydrological drought (Van Loon & Van Lanen, 2012). Catchment properties are as important for hydrological drought development as climate characteristics (Van Lanen et al., 2013). Seasonal climate predictions of drought have shown significant skills over the tropics, but tend to have less predictive power in mid‐latitudes regions, and currently no seasonal drought forecast system of terrestrial water variables exists for Europe.
Also, relevant conclusions from WP 1 for Task 2.7 and Deliverable 2.8 are that:
More knowledge is needed on the key drivers of drought and on the application of this knowledge to drought forecasting in different regions within Europe in order to support drought preparedness and management. An efficient drought monitoring and early warning system further requires clearly defined monitoring objectives.
Technical Report No. 33
-3-
The overall high uncertainty in the simulations reflects the inherent difficulty of drought quantification and the uncertainty of drought projections, requiring further research.
In Task 2.7, and Deliverable 2.8, the current and/or the potential use of SPI and SPEI in the cases of study is investigated, either for drought characterization, for drought monitoring, or as part of early warning systems.
1.3.
Environmental impacts of droughts
The impacts of natural droughts in natural ecosystems are not in the main scope of Drought R&SPI project, since, as mentioned before, in theory, no action is needed in natural droughts, and therefore, no policy making should be needed. But, since nature is providing valuable ecosystem services, it can be interesting to look at least at the impacts of natural droughts on the ecosystems that provide these services. Moreover, when a basin is providing waters services for humans, and depending on the water stress (related to water scarcity) imposed by water use, impacts can happen (and for sure will happen in medium to highly water stressed basins) that go beyond the environmental impacts that would be produced in ecosystems in pristine conditions. Therefore, in the frame of WP 3 and WP 2, the impacts of drought in the environment have been quantified for some cases of study, as it can be seen in the Technical Report No. 9, Section 5. The evaluation was mainly addressed by applying a descriptive approach. A further step involved modelling the relationships between some meteorological variables associated with drought (e.g. precipitation, temperature) and observed (quantified) impacts on some key environmental components. But the quantification of environmental drought impacts resulted to be not straightforward since it relies on data availability to compare the evolution of a specific aspect in a drought period and in non‐drought situation. Such kind of data are lacking for most of the topics that were reported for all the case‐ studies. Furthermore, drought environmental impacts quantification is hampered by the fact that impacts may persist over a period not included in the drought evaluations. The majority of the environmental impacts shared by the case‐studies regarded direct impacts on aquatic ecosystems (e.g. water quality reduction, fish dieback). When long‐term data are available it is possible to model the relationship between variables or drought indicators and environmental impacts, such as area burned by wildfires or reduction in productivity and ultimately in bird diversity in vulnerable habitats. A further development of the models presented can be commonly applied at case‐study level to compare impact significance and vulnerabilities.
1.4.
Human dimension and Impacts of droughts
Human dimensions of drought are introduced when any type of the previously mentioned natural system droughts affects human activities, and also, of course, when human activities influence the natural regime. As a consequence of meteorological drought and soil moisture drought, a rain‐fed agricultural drought can develop; and, as a consequence of hydrological drought, a water supply drought can develop (affecting irrigated agriculture and/or urban supply, among others), or other types of drought depending on the activity sector affected (for instance, a ‘‘navigation drought’’ is one of the main issues Technical Report No. 33
-4-
in the Netherlands case of study). We will either use the general term "socio‐economic droughts" for this, or specific terms to distinguish the main issue addressed, as just mentioned. Also, in developed water resource systems (WRS) the ability to manage water resources, makes the impacts of drought on human demands relying not exclusively upon the flowing flows in rivers and streams, but also on the volume of water stored in reservoirs and aquifers, this means the way in which these reserves are managed. Hence the definition is linked to the management system. In regulated systems, when hydrological drought lasts several months or years, occurs a significant reduction of storage in reservoirs, causing problems to supply water to meet demands on the system. This situation is sometimes referred as operational drought (Andreu et al, 2006). It manifests itself as a supply deficit. This kind of drought represents the link between nature‐related droughts and the next type. So, we can see socio‐economic droughts as running in parallel to natural droughts due to impacts on human activity from the natural droughts, rendering anomalies in water availability, or any other features related to water. This is why we insist on maintaining the concept of hydrological drought separated from human activities, and keep it for the natural systems (Andreu et al, 2013).
Figure 1. Evolution of drought from natural to human related (Source: Villalobos, 2007).
Also, as mentioned in a previous section, for the purposes of Task 2.7, we find very convenient to distinguish between different types of space divisions, either administrative of physically based, and of different affected sectors, or even different policy and decision making levels, in order to relate what we called "natural droughts" to their impacts on human activity. Technical Report No. 33
-5-
As found in the work performed in WP 3, the improvement of Europe’s resilience to drought impacts requires a better understanding of impact‐relevant indicators to be monitored. But drought impacts are more diverse and even a direct and exclusive link to the drought hazard is often difficult to make (Ding et al., 2010). WP 3 has addressed this need by investigating the diversity of impacts across different European countries and geo‐climatic regions using three approaches based on a number of different data sets and methods, including participatory techniques (stakeholder involvement), categorized data on drought impacts derived from a variety of text sources, and quantitative drought impact data reported by member states, such as reported and modeled annual crop yields, and area‐burned by forest fire (Stahl et al., 2015). Also, in WP 2, Task 2.2, the analysis of historic drought events in terms of socio‐economic impacts has been performed for the cases of study (see Technical report No. 9), using different methodologies and analytical tools, given the different disciplines and competencies involved, but encompassed in a unique framework designed to identify, collect and analyse the relevant data, with the objective to evaluate the impacts on the most relevant and sensitive economic sectors (in particular, agriculture and energy) in monetary terms, following and applying a methodological approach based on theoretical elements, such as the consumer surplus theory. The analysis of the economic impacts produced in some cases relevant results, at least as regards agriculture and energy power sector. Moreover, according to the findings, the socio‐economic costs of the drought in some case study areas were socially differentiated: consumers and producers are affected differently by the drought events. The first group can even earn from the drought, because of the price effects caused by the scarcity of the goods produced; the second group always loses, because both of the quantity effect and the price effect. These results obtained in WP 2, Task 2.2, reported in Technical Report No. 9, confirm the findings of WP3 about the difficulty or relating droughts ant its impacts. In fact, it seems impossible to establish simple relationships between hazard and impacts, given the multiple dimensions and facets of the latter. Therefore, impacts of droughts have to be described and/or assessed in multiple manners, as it was done in WP3 of this project, in order to show the vulnerability to drought of different regions in Europe. Up to 15 impact categories representing different sectors and related sub‐types have been defined (“Agriculture and livestock farming” and “Public water supply” comprising the largest fraction in most countries). All these lead to the following conclusions reported in WP 3 relevant for Task 2.7 (Stahl et al., 2015).
The large variety of impact types and the varying relevance of particular impacts found across Europe supports the often‐repeated concern that one drought index will not be sufficiently useful. Suitable impact‐related indicators for agriculture, for example, will depend whether agriculture in the respective region is rain‐fed (short‐term deficits) or irrigated (long‐term deficits); impact‐ related indicators for energy production will depend on whether hydropower reservoirs (fill‐ season deficit) or thermal power plants requiring cooling water (including air and water temperature) dominate (Stagge et al., in rev).
Technical Report No. 33
-6-
Precipitation and soil moisture based indicators currently used in many of the continental to global scale monitoring and early warning systems may need to be complemented by indicators that use observations and forecasts of surface and groundwater quantity (river discharge, lake level, snow water equivalent, groundwater levels, etc.). In fact, for complex multi‐purpose water resources systems, with multi annual storage capacity (i.e., reservoirs and aquifers) it has been found that specific drought indicators can be very useful for monitoring droughts, as well as early warning systems to predict the impacts, and to define scenarios that can trigger measures to be applied in an anticipated way in order to increase resilience (Andreu et al., 2013). Hence, at the scale of Europe, indices for a consistent cross‐comparison will always remain in conflict with usefulness ‘on the ground’. The analyses on pan‐European drought impacts, however, elucidate some of the patterns and may thus help the decisions for the standardization of various sets of indices that perhaps have a wider relevance than locally, while still allowing inter‐comparisons at EU level.
1.5.
Time scales and the space factor in the analysis of operative droughts
We must draw attention to the fact that drought analysis gives different results for different scales of time and space. For an analysis to give relevant information for the taking of decisions, the choice of these scales is important. In an arid or semi‐arid region, prolonged periods without rain are frequent (i.e. days or even months without precipitation). But, both the ecosystem and the agricultural and commercial activities in these regions have adapted themselves to these circumstances, so that to analyze a meteorological drought on a daily or weekly scale does not usually give useful information. The scale of the analysis must be at least monthly, and the most appropriate may even be yearly, depending on the type of drought and on the storage capacity of the system. But, as the annual scale is not suitable for the recording of most of the hydrological phenomena that, as we shall see, it will be necessary to model, the monthly scale gives a compromise between the quantification of the results and the realistic recording of the phenomena. In a developed water resource system an action at any point in the basin may have a direct or indirect influence at other points of the same basin, so that, apart from a few exceptions, the most appropriate spatial scale is that of the complete basin. The analysis of individual elements of the system or sub‐ systems may give rise to erroneous conclusions due to the inter‐dependence among the sub‐systems, both in resources (e.g. the relation between surface water and underground water) and in uses (e.g. return of used urban water capable of being re‐used). Therefore, it is essential to consider as a whole all sources of supply, water requirements, and any other elements that go to make up the system existing in the basin. It could even be necessary to analyze a space larger than a basin, if there were connections among different basins or if the supply for a certain use was to come from more than one basin.
Technical Report No. 33
-7-
1.6.
Data availability and suitability
The propagation of drought in time and within the water system will show its effects in different ways depending on the aspect of the hydrological cycle observed. This means that, to detect the state of drought of a system, it will be necessary to monitor an important amount of variables. But direct measures of the variables are often not available. This complicates drought analysis and drought monitoring. Moreover, the effect of anthropogenic disturbances on the environment makes that the development of droughts, or at least how they affect the system, is more difficult to detect than in undisturbed systems. In fact, the analysis of natural hydrological droughts in disturbed systems requires the "re‐ naturalization" of flow data prior to any statistical analysis. This is done systematically in the Jucar River Basin Case of Study. Some of these inconveniences can be overcome by means of the use of adequately calibrated and validated models of water balance, as done in the Jucar River Basin Case of study (Andreu et al., 2007), as shown later in Chapter 4.
Technical Report No. 33
-8-
2. Review of current drought monitoring systems and identification of monitoring requirements The first activity in Task 2.7 was reviewing the existing drought monitoring systems in the different Case Studies within the DROUGHT‐R&SPI project in order to describe these monitoring systems and indicators already in place, and identifying gaps and further monitoring requirements. Technical Report No.6 (Assimacopoulos et al. 2013) collected the contributions of all Case Studies. Table 1, adapted and updated from Technical Report No.6 (Assimacopoulos et al., 2013), summarizes the use of indicators in each one of the cases of study. Table 1. Drought monitoring and declaration in the Case Studies (adapted and updated from Assimacopoulos et al., 2013) Case Study
Drought Indicators Monitoring
Monitoring Public related to reports on drought impacts conditions No, but Yes (water modeled system impacts conditions) different sectors
Netherlands Yes
River discharge Evaporation surplus River temperature Groundwater levels
Portugal
No SPI PDSI % Soil moisture content Regional drought distribution model Streamflow, reservoirs water storage and groundwater storage Water quality parameters
Yes
No
Yes
Yes
Switzerland
Yes
Jucar River Yes Basin
Syros
No
No
SPI Streamflow percentiles Soil moisture anomalies Stored volume in reservoirs Piezometric levels in aquifers Naturalized streamflow Rainfall SODI‐ Standardized Operational Drought Indicator based on combination of the above variables
Yes (since Yes SODMI has been calibrated to define different drought scenarios, from normal to emergency, related to the impacts) No No
Drought process
declaration
No (The National Committee on Water Distribution starts to meet when river flow and temperature reach certain thresholds), but water allocation according to Priority ranking. Yes (not official)
No (each user is responsible for the appropriate interpretation of the information) Yes
Yes (not official)
Technical Report No. 33
-9-
The spatial scale and distribution of the different Case Studies across Europe makes easy to understand that each one of them is going to use/need case‐specific drought indicators, selecting those that better suit their needs with regard to drought awareness and risk perception. Regarding the monitoring needs or improvement of the existing systems, Table 2 shows the final outcomes for the DROUGHT‐R&SPI cases of study as compiled by Assimacopoulos et al. (2013) in Technical Report No. 6. Table 2. Recommendations for further improving drought monitoring in Case Studies (Assimacopoulos et al., 2013)
Case Study Netherlands Portugal
Switzerland Jucar River Basin
Syros
Recommendations • Definition of thresholds for drought severity levels • Use of water quantity and quality indicators in monitoring • Identification of the required structural measures to limit drought impacts • Establishment of monitoring programs with well-structured information networks (particularly for trans-boundary waters) • Development of permanent system for drought forecasting, early-warning and monitoring • Improvement of monitoring of on available water resources, particularly for groundwater • Linking drought indices with drought impacts to develop a global drought indicator • Development of a drought monitoring system (on-going consultation with stakeholders on the development of a drought information platform) • Review of thresholds for the Alert and Emergency scenarios • Review of the indicator’s system (variables & weights) improve the anticipation process • Development of special indicators for water resource systems • Elaboration of monthly reports on the hydro-meteorological state of the basin • Elaboration of reports of the future conditions of the water system in case of an operative drought • Establishment of a drought monitoring network/process that will adequately consider water scarcity issues, groundwater storage and use.
All the cases have in common that there is a need for the development of monitoring systems, if they did not exist (as in the recent case of Switzerland), and improving the already existing ones by solving their gaps and limitations. It is also necessary to define, or redefine, the thresholds that indicate when a drought event is going on. In addition, according to literature (Mishra & Singh, 2011), it is also important to define when a drought starts and when it finishes. Finally, there is a need for linking the monitoring results with the impacts of drought for improved early warning. In any case, as observed in Technical Report No. 6, the existence of at least one supporting organization to the monitoring system is a common aspect in all the cases of study. The contribution of these organizations may vary from providing observational data to the system to host the information for public access.
Technical Report No. 33
- 10 -
3. Screening of WP1 & WP3 guidelines and suggestions on drought monitoring and early warning Along the development of the project DROUGHT‐R&SPI, attention has been paid to drought also to the pan‐European scale in Work packages 1 and 3, as natural hazard and its impacts respectively. Part of the work developed in both of them was devoted to explore monitoring possibilities at the pan‐EU and national level, something that can be easily translated to the regional or local scale. This section summarizes the outcomes of these two work packages with regard to indicators for drought monitoring and early warning. Work package 1 (WP 1) studied drought as a natural hazard and, in Technical Report No. 21 (Gudmundsson et al., 2014), provided final guidelines for monitoring and early warning in Europe. It discusses on the need of defining appropriate monitoring objectives for each case, on the variables needed to be observed in order to achieve the objectives set and on the availability of these data, and on the indicators and triggers available in literature. Figure 2 summarizes the discussed options in Technical Report No.21. The main conclusions extracted from this document are that there cannot be a general recommendation on the design of a drought monitoring system given the diversity of needs and potential applications. Instead, according to Stähli (2013) it is recommended that stakeholders’ needs are considered in the design of a specific drought monitoring system. Figure 2 shows the three blocks in which Gudmundsson et al. (2014) recommend observing for the development of a drought monitoring and early warning system at the pan‐European and national scale. On the other hand, among the objectives of Work Package 3 (WP 3) were to improve the knowledge on links between drought indicators that can be monitored and predicted and a range of drought impacts (incl. crop loss, water supply shortage, low flow, energy production loss, forest fire, heat waves, user conflicts, etc.) in different geo‐climatic regions in Europe; and to provide recommendations for impact‐related drought indicators and indices that will complement and expand existing Pan‐European hazard assessment, vulnerability monitoring, and early warning suitable to inform risk reduction measures in EU policies. The final recommendations from WP 3 regarding drought monitoring and early warning are synthetized in Deliverable 3.6 (Stahl et al., 2015a):
Drought impacts should be monitored in addition to the commonly used drought hazard indicators. The impact information should be used routinely to test the validity and usefulness of drought indicators, particularly when new indicators are developed.
Impact‐relevant DMEW appears most promising for a resolution at the scale of countries (for small countries) or regions (ca. NUTS‐2) for the purpose of Pan‐European overview.
Drought indicators used in Pan‐European DMEW need to consider short (3‐6 months) as well as long‐term (>12 months) precipitation and climatic water deficits due to their differing relevance to different impacts (sectors).
In addition to the currently common precipitation deficits, long‐term water deficits should ideally be based directly on hydrological variables (river flow, lakes, reservoirs and groundwater levels), which in Europe are heavily influenced by human regulation and hence differ. Such variables need to be monitored and made available directly.
Technical Report No. 33
- 11 -
Impact‐informed composites that are specific to different sectors can and should be developed based on adequate data. Alternatively, a set of indicators and a customized ”menu” and guidance to create impact‐relevant indicators could be developed to support regional research and technical development of DMEW.
Also, according to Stahl et al. (2015b): “Indices for a consistent cross‐comparison will always remain in conflict with usefulness ‘on the ground’. The analyses on pan‐European drought impacts, however, elucidate some of the patterns and may thus help the decisions for the standardization of various sets of indices that perhaps have a wider relevance than locally, while still allowing inter‐comparisons at EU level.”
Figure 2. Drought monitoring and early warning is a trade‐off between the monitoring objective, the availability of data and the choice of drought indicators (Gudmundsson et al., 2014)
Technical Report No. 33
- 12 -
4. Applicability of indicators for drought monitoring, forecasting and early warning at the basin and regional scale In order to study the applicability of the different existing indicator for drought monitoring, forecasting and early warning, it is necessary first to distinguish between two types of drought above the traditional types usually addressed when talking about this hazard. The first distinction that needs to be made is between droughts affecting natural systems and droughts affecting human influenced systems. And the study of drought as a natural hazard, although similar in the practice, must be done from a different perspective. On the one hand, droughts are an intrinsic feature of natural systems and contribute to the shaping of the system’s environment itself together with other climatic, territorial and natural characteristics. They will not represent an impact on the system by themselves. On the other hand, human activities modify the effects of droughts on the systems, giving these essential features of the system a character of natural hazards. Anthropic influence distorts to a great extent the variables of the hydrological cycle. Irrigation modifies the natural soil moisture content cycle along the year, making that there are high amounts of water in the soil during usually dry periods. In order to augment the revenue from water resources, men alter water storage bodies such as lakes and aquifers, and even create new one with the construction of dams. Finally, and related to the previous, human activities also modify river flows by stopping them at reservoirs or extracting them from their natural courses with the construction of intakes and diversions. As a consequence of all this, humans also aggravate the impacts that droughts have on the environment, and droughts generate impacts on human activities. Therefore, there is an increasing interest on relating drought indices with the impacts produced by these natural events. Unaltered variables of the hydrological cycle (precipitation, soil moisture, storage in lakes and aquifers, and river flows) can be easily measured directly or estimated with the use of indirect measurement methods (remote sensing) or models (water balance) when considering an unaltered system. It is extremely important that, when considering regulated systems, the variables used for the calculation of drought indices correspond to those that would occur in an unaltered system, making a primary priority the estimation of all variables in the hydrological cycle in their naturalized form. The use of standardized drought indicators (e.g. SPI, SPEI, SMAI, SGWI, SRFI) on unaltered variables will provide valuable insight on the characteristics of drought as natural hazard and will allow comparing them between different systems, regions and periods of time. Together with the application of runs theory, they represent powerful tools for description and comparison. They are even very useful for model validation, allowing us to develop stochastic models of natural variables for later scenario definition. Standardized indices can also be used for monitoring, since they are capable of determining the current drought situation, although some of them may yield different results depending on the way to determine some of the variables needed for their compilation, limiting their use for monitoring purposes. However, most of these indices have limited use for further uses. First, there has been little success in correlating them with the occurrence of impacts and their intensities. Some of them correlate better than others but the overall results are far from satisfying expectative from water users and managers. Second, because of the very standard nature of the indices, their use in different Technical Report No. 33
- 13 -
climatic regions (e.g. humid, arid, semi‐arid), where drought impacts may differ for a similar kind of drought event, may difficult the comparison between them due to the apparent comparability that will in the end be not completely real. In addition, changes in drought management along time also introduce bias in the relationship between indices and impacts. Impacts that occurred in a system during a certain drought period might not occur or be as intense in a second drought episode with similar characteristics simply due to a change in the management of both cases, and vice versa. It is also necessary to consider impacts at the global and at the sectorial scale. Another aspect in drought monitoring and early warning is the interest in determining how much the measures envisaged to minimize the impacts of drought will affect the drought situation itself, improving it or having no effect. For that, it is interesting to develop indicators that vary according to the effectiveness of the measures defined. Here is where decision support systems shells (DSSS) and models associated to them enter into play. While the calculation of indices related to hydrological variables may tell us the natural situation of drought, they cannot communicate the possible impacts nor the efficiency of the measures addressed at minimising these. With models of the systems under study, it is possible to estimate impacts in the sectors considered into them. The feeding variables such as precipitation or streamflows may come from other models that use the very drought characteristics detected for the unaltered system in order to validate the generated data, as commented above. Therefore, for practical purposes, and in order to provide a better perception of reliability, risk, vulnerability, and resilience in front of drought it is very convenient to use the outcomes of models (desirably integrated in Decision Support Systems ‐ DDS). In fact, this is done in the Jucar case at two time horizons. For long term (basin and drought planning), indicators are used to assess the vulnerability to drought (acceptable or not acceptable) of different water uses, and therefore, to propose long term proactive measures to lower vulnerability and increase resilience. And for the short term (real time drought management) DSS are used to predict the short term (12 to 24 months) impacts of the ongoing drought, in deterministic and probabilistic fashion, using flow forecasts. This provides an excellent indicator of risk, which is used in participative meetings of the drought commissions in order to define and refine the degree of application of the measures contemplated in the plan for each scenario, testing their effectiveness by means of the DSS. In this report, two cases of study, namely the Jucar River Basin and The Netherlands, are the cases which are used to explore the applicability of suggested indicators for drought monitoring, forecasting and early warning, given that they are the cases which have a wider background in the development and use of indicators in close collaboration with local and national water managers, users in different sectors, and stakeholders and with the objective to use them for policy and decision making related to drought across scales.
4.1.
Examples of application of drought indicators at the Jucar River Basin Case of Study
At the Jucar River basin, the use of drought indices is spread along the whole water resources planning and management process. From the very planning phase to the real time management of the system, Technical Report No. 33
- 14 -
drought is considered one of the main issues to solve and different drought indices are used for different purposes depending on the use required for their results. 4.1.1. Use of drought vulnerability criteria for water resources planning The DROUGHT‐R&SPI project understands vulnerability to drought as: “The characteristics and circumstances of a community, system or asset that make it susceptible to the damaging effects of the hazard”. In the case of the Jucar River Basin Case of Study, this term has been translated as to: “The degree to which a water resources system is unable to cope with the impacts suffered due to a drought episode”. As mentioned above, droughts are an essential asset of water resources planning and management in the Jucar River basin. From the beginning of exploitation of resources in this basin, users and managers have been concerned about the amount of situations in which the system would not be able of fulfilling their needs. These situations were mostly related to the occurrence of drought periods in which the amount of available resources would be dramatically decreased. In the making of River Basin Plans, the Jucar RB stakeholders and managers have agreed to consider that a particular demand has a LOW (Acceptable) or HIGH (Unacceptable) vulnerability to drought using the following reliability/vulnerability criteria:
In the case of urban demands, the criterion defines the vulnerability as HIGH if: o The expected maximum deficit in one month exceeds 10% of the monthly demand o The expected maximum deficit accumulated in 10 years exceeds 8% of the annual demand On the other hand, for agricultural demands, the vulnerability is HIGH if: o The expected maximum deficit in one year exceeds 50 % of annual demand o The expected maximum deficit in 2 consecutive years exceeds 75 % of annual demand The expected maximum deficit of 10 consecutive years cannot exceeds 100 % of annual o demand Otherwise, the demand has a LOW vulnerability.
The evaluation of the vulnerability criteria is done with the aid of simulation models of the system management developed with Aquatool DSSS (Andreu et al., 1996). The normal procedure is feeding the model with a set or sets of streamflow scenarios and water demand scenarios. The resulting flows along the system will be related to its management rules and the failures of supply represented as water shortages in the different demands will determine whether the system is capable of complying with the vulnerability criteria or not (Figure 3). This same procedure can be used to assess future drought vulnerability by using projected streamflow values, or obtained from rainfall‐runoff modeling from forecasted precipitation and evapotranspiration values as was done in Assimacopoulos et al. (2014b)
Technical Report No. 33
- 15 -
Streamflows scenarios
Demands scenarios
WRSM model
Water shortages LOW (Acceptable)
Vulnerability HIGH (Unacceptable)
Figure 3. Drought vulnerability calculation process used in the Jucar River Basin.
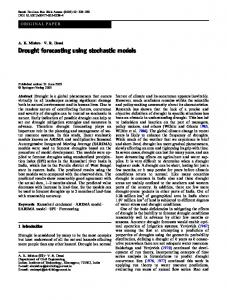
4.1.2. Use of standardized indices and runs theory for drought characterization Villalobos (2007) did a probabilistic analysis, both parametric and non‐parametric, of the monthly series of precipitation, soil moisture, streamflows and storage volumes, with the purpose of obtaining the characterization of the different types of drought for the entire Jucar River territory, by means of standardized indexes and percentiles to different time and space scales. He established that the two more important droughts showed up at the beginning of eighty and ninety, respectively; being this last one of higher intensity and duration (the last episode between 2005 and 2008 was still going on). He showed how droughts were intense at the regional level but lost intensity and coverage as long as the temporal and spatial aggregation increased, demonstrating that it is very unlikely that the whole area of study shows drought conditions in a continued form. Rainfall‐runoff simulation models were used to obtain the monthly series of the hydroclimatic variables of interest. Also, a simulation model of the water resources system management was used to obtain the series of storage volumes when applying a standard operation rule, fed with the results of the hydrological model. In this investigation model PATRICAL and SimGes were used, respectively.
Technical Report No. 33
- 16 -
Figure 4. Conceptual model of PATRICAL (adapted from Villalobos 2007).
The SPI calculation methodology as enunciated by McKee et al. (1993) was applied to all the components of the hydrological cycle for the probabilistic characterization of the different types of drought. The runs theory (Yevjevich, 1967) was also used to complement the results of the probabilistic approach. In this investigation 6 values were used in the temporary scale: 1, 3, 6, 12, 24 and 48 months, which were analysed at four different spatial scales: local, with more than 43000 data points that correspond to the cells of the hydrological model (Figure 5); regional, using 18 regions within the Jucar River Demarcation Territory (Figure 6); the Jucar river basin; and the complete territory of the Jucar River Demarcation.
Technical Report No. 33
- 17 -
Figure 5. Spatial distribution of the Jucar River Demarcation for the calculation of standardized drought indices.
Figure 6. Regional distribution of Jucar River Demarcation.
For each type of drought different severity levels were established according to the values of their indicators: yellow level, level orange, red level and black level that correspond to the accumulated probability of 50, 30 15 and 5 percent, respectively: incipient drought, moderate drought, severe drought and critical drought (Table 1Table 3).
Technical Report No. 33
- 18 -
Table 3. Percentile and SPI equivalent values to the CHJ drought status
Drought Level/Intensity
State Index (Is) 1.00 0.50 ≤ Is