Perception & Psychophysics 2003, 65 (5), 801-816
Dual-task interference with equal task emphasis: Graded capacity sharing or central postponement? ERIC RUTHRUFF NASA Ames Research Center, Moffett Field, California HAROLD E. PASHLER University of California, San Diego, La Jolla, California and ELIOT HAZELTINE NASA Ames Research Center, Moffett Field, California Most studies using the psychological refractory period (PRP) design suggest that dual-task performance is limited by a central bottleneck. Because subjects are usually told to emphasize Task 1, however, the bottleneck might reflect a strategic choice rather than a structural limitation. To evaluate the possibility that central operations can proceed in parallel, albeit with capacity limitations, we conducted two dual-task experiments with equal task emphasis. In both experiments, subjects tended to either group responses together or respond to one task well before the other. In addition, stimulus– response compatibility effects were roughly constant across stimulus onset asynchronies (SOAs). At the short SOA, compatibility effects also carried over onto response times for the other task. This pattern of results is difficult to reconcile with the possibility that subjects share capacity roughly equally between simultaneous central operations. However, this pattern is consistent with the existence of a structural central bottleneck.
When people are presented with multiple tasks at the same time, each involving a rapid choice of actions, substantial interference usually occurs. In the laboratory, this interference between tasks is often measured using the psychological refractory period (PRP) design, where two different stimuli requiring speeded responses are separated in time by a variable stimulus onset asynchrony (SOA). As the SOA becomes shorter, responses to the second stimulus are slowed dramatically, even with seemingly very easy tasks (e.g., choice response time [RT] tasks involving trivial perceptual discriminations). This slowing, known as the PRP effect, is very robust; it has been found in numerous experiments using various combinations of tasks, input modalities, and output modalities (see Welford, 1952). Several different converging measures point toward the conclusion that the PRP effect is due largely to a central bottleneck; that is, as shown in Figure 1, only one central operation takes place at a time (for recent reviews, see Lien & Proctor, 2002, and Pashler & Johnston, 1998; for a contrary view, see Meyer et al., 1995). Central operations This research was supported by grants from the National Research Council and the National Aeronautics and Space Administration. The research was also supported by Grant MH45584 from the National Institute of Mental Health to H.E.P. We thank James Johnston, David Meyer, Mei-Ching Lien, and Roger Remington for helpful comments. Correspondence should be addressed to E. Ruthruff, NASA Ames Research Center, Moffett Field, CA 94035 (e-mail:
[email protected]. nasa.gov).
include response selection and perhaps also memory retrieval (Carrier & Pashler, 1995), memory consolidation (Jolicœur & Dell’Acqua, 1998), mental rotation (Ruthruff, Miller, & Lachmann, 1995), and lexical processing (McCann, Remington, & Van Selst, 2000), but generally do not include input/output operations such as stimulus identification and response execution. Although the evidence for a central bottleneck appears to be strong, it has primarily come from PRP experiments that emphasized Task 1 over Task 2. There are two ways in which PRP studies emphasize Task 1. First, the Task 1 stimulus is almost always presented before the Task 2 stimulus (hence the labels Task 1 and Task 2). Subjects might therefore infer that Task 1 is more important than Task 2. Second, PRP instructions often place explicit emphasis on the speed of Task 1. For example, subjects might be told to “respond to Task 1 as fast as possible.” These instructions are intended to encourage subjects to emit their Task 1 response as soon as it has been selected. Absent these instructions, subjects often withhold their Task 1 response until their Task 2 response is also ready. This responsegrouping strategy (Borger, 1963) is undesirable from the experimenter’s point of view because it makes it difficult to determine when the critical Task 1 operations actually finished. The emphasis on Task 1 raises the question of whether the central bottleneck revealed by PRP studies is obligatory (i.e., due to some structural limitation) or merely voluntary. Subjects might have the latent ability to overlap
801
Copyright 2003 Psychonomic Society, Inc.
802
RUTHRUFF, PASHLER, AND HAZELTINE
central operations, but instead choose a bottleneck strategy because it is the easiest way to satisfy the Task 1 emphasis instructions (see McLeod, 1977; Meyer & Kieras, 1997a, 1997b; Meyer et al., 1995; Pashler, 1994a; Ruthruff et al., 1995). There is, in fact, some reason to believe that people have the latent potential to overlap central operations. Several recent studies have shown that Task 2 processing can influence RT to Task 1 (RT1), which is sometimes called a backward compatibility effect. Of particular interest are cases in which backward compatibility effects on RT1 appear to stem from Task 2 stages at or beyond the central stage (Hommel, 1998; Lien & Proctor, 2000; Logan & Schulkind, 2000; for a review, see Lien & Proctor, 2002). Although the evidence is indirect, such effects are consistent with the hypothesis that Task 2 central stages can be carried out (although not necessarily to completion or with adequate accuracy levels) in parallel with Task 1 central stages. In addition, a few recent studies have provided evidence for parallel central processing in dual-task paradigms after considerable practice (i.e., over 1,000 trials per task; Hazeltine, Teague, & Ivry, 2002; Schumacher, Seymour, Glass, Kieras, & Meyer, 2001; but see also Levy & Pashler, 2001; Ruthruff, Johnston, & Van Selst, 2001; Ruthruff, Johnston, Van Selst, Whitsell, & Remington, 2003; Van Selst, Ruthruff, & Johnston, 1999). Schumacher et al., for instance, found very small dual-task costs (,10 msec) after subjects had performed five sessions of an auditory– vocal task (saying “1,” “2,” or “3” to low-, medium-, and high-pitched tones, respectively) and a visual–manual task (making a compatible keypress to the spatial position of a circle). A limitation of these studies, however, is that practice tends to dramatically reduce single-task RT; consequently, little dual-task interference would be expected even if a bottleneck were still present (for a thorough discussion of “latent” bottlenecks, see Ruthruff et al., 2003). Furthermore, even if the central bottleneck were eliminated in these studies, it might reflect the automatization of one or both tasks with prolonged practice. For instance, people might develop “jumper-cable” paths directly between stimulus- and response-related areas (Johnston & Delgado, 1993). This explanation seems particularly plausible given the simplicity of the tasks typically used in these studies—only a few stimuli mapped directly to a few responses (often with high stimulus–response [S–R] compatibility). The purpose of the present paper is to determine whether parallel processing of central stages is possible even without thousands of practice trials, when the instructions encourage it. There have been a few previous attempts to address this issue empirically. In particular, Ruthruff, Pashler, and Klaassen (2001) found substantial central interference between tasks even when subjects were asked to group responses together, which provided an incentive to carry out the tasks concurrently. These results argue strongly against the possibility that subjects performed both tasks together with no central interference. However, the existence of central interference does not necessarily imply that there was a central bottleneck. A viable alternative possibility is
that central operations proceeded in parallel, but relatively slowly due to capacity limitations (e.g., Kahneman, 1973; McLeod, 1977). The present paper addresses this possibility, which we call graded capacity sharing. GRADED CAPACITY SHARING According to the graded capacity-sharing model considered in this paper, all stages on the two tasks (including central stages such as response selection) can proceed in parallel. Due to capacity limitations, however, some of these stages might proceed more slowly under dual-task conditions than under single-task conditions. In this paper we focus on a version of this model in which capacity sharing occurs only in central stages (see McLeod, 1977), with the input and output stages generally free from capacity limitations. This model can easily explain the great bulk of PRP experiments simply by assuming that most of the available capacity is allocated initially to Task 1. This assumption is certainly plausible given the typical PRP instructions to emphasize Task 1. Two recent papers (Navon & Miller, 2002; Tombu & Jolicœur, 2003) appraised the merits of capacity-sharing models and reached very similar conclusions. Unfortunately, few existing data speak to the question of whether graded capacity sharing is or is not possible. One exception, however, is a study by Pashler (1994a) in which subjects were instructed to place equal emphasis on each of two tasks (a tone classification task and a letter classification task). In that study, the SOA between the tone and the letter was 21,000, 2500, 0, 500, or 1,000 msec, so that each task was equally likely to come first. Thus, unlike in the PRP paradigm, there was no implicit or explicit encouragement for subjects to strategically impose a voluntary processing bottleneck. To determine whether central operations were performed in series (as predicted by the central bottleneck model) or in parallel (as predicted by capacity-sharing models), Pashler (1994a) examined the time between the responses to the tone and letter tasks, also known as the interresponse interval (IRI). If central operations are performed serially, then the response to Task A should generally be emitted well before the response to Task B, or vice versa. That is, the IRIs should be relatively large. In addition, there might be a modest proportion of trials where subjects group responses together, producing an IRI close to zero. Thus, there should be three distinct patterns of response. On the other hand, if central operations are performed in parallel with roughly equal capacity allocation, then one might expect a broad, unimodal distribution of IRIs centered roughly near zero. The data showed the response patterns predicted by the central bottleneck model rather than that predicted by roughly equal capacity sharing. The data from Pashler (1994a) indicate that a bottleneck can arise even when the two tasks are given equal emphasis. However, an important limitation of this study is that both tasks required manual responses (left hand for
DUAL-TASK INTERFERENCE WITH EQUAL TASK EMPHASIS the tone task, right hand for the letter task). Therefore, it is possible that the bottleneck was not in central processing, but rather in response initiation or execution (De Jong, 1993; Keele, 1973; but see also Sommer, Leuthold, & Schubert, 2001). THE PRESENT STUDY The present study was designed to determine whether graded central capacity sharing is possible when subjects are encouraged to overlap performance of the two tasks and when each task uses distinct input and output modalities. We chose to study tasks with novel (i.e., not highly practiced) S–R mappings, which clearly require central processing and should produce relatively long RTs (ensuring that a central bottleneck, if present, could be easily detected). Experiment 1 used the basic design of Pashler (1994a), with both positive and negative SOAs and equal task emphasis. However, in the present Experiment 1 we used a tone task with a vocal response and an alphanumeric character-identification task with a manual response (see below for details). The use of different response modalities on the two tasks greatly reduces the likelihood of a response initiation/execution bottleneck. Thus, if we still find evidence for a bottleneck, we can more confidently conclude that the locus of the bottleneck is in central processing. We used two different approaches to test between the central bottleneck model and the graded central capacitysharing model. The first approach was to examine the distribution of IRIs across trials. Experiment 1 tests the bottleneck model predictions outlined by Pashler (1994a). Experiment 2 tests these predictions as well as a novel prediction from the bottleneck model (discussed later) regarding the effects of a slight SOA manipulation (250 or 150 msec) on the IRIs. Specifically, SOA should influence which task’s central operations are performed first, but should not affect the shape of the underlying IRI distribution. The second approach to testing these models (used only in Experiment 1) involved manipulating the duration of central processing on the character task using a S–R compatibility manipulation. As discussed below, the central bottleneck model makes very specific predictions regarding (1) how this compatibility manipulation will affect the character task itself and (2) how these effects will carry over onto the tone task. The capacity-sharing model makes much less specific predictions for each of these effects, because the outcome depends critically on how capacity is divided between the two tasks. However, it does make specific predictions for the joint values of these two effects. Central Bottleneck Model Predictions In this section, we develop the logic underlying the predictions of the central bottleneck model. We first discuss predictions regarding IRI distributions and then discuss predictions regarding the effects of S–R compatibility. Interresponse intervals. To be consistent with our definition of SOA (character onset time minus tone onset
803
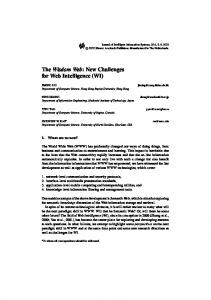
time), we define the IRI as the time of the character-task response minus the time of the tone-task response. Thus, positive numbers indicate that the tone-task response was emitted first, and negative values indicate that the charactertask response was emitted first. As noted by Pashler (1994a), the central bottleneck model implies that on each trial subjects can perform central operations on the tasks in one of two possible orders (i.e., tone-before-character or character-before-tone). If subjects select a response to the tone task first and promptly execute that response (i.e., without delays due to response grouping), then the tone-task response will be emitted well before the character-task response, producing a large positive IRI. The left panel of Figure 1 shows processing time diagrams for this central processing order; the top panel corresponds to the compatible condition and the bottom panel corresponds to the incompatible condition. Under the simplifying assumptions that a bottleneck is always encountered at the 0-msec SOA and that the output stages on the two tasks are roughly equal in duration, the IRI on such trials should simply be equal to the duration of central processing on the character task (plus any taskswitching time; see Lien, Schweickert, & Proctor, 2003). On the basis of previous studies (e.g., Pashler, 1994b), we can roughly estimate that this stage will take 300– 400 msec, on average; of course, this stage time should vary considerably from trial to trial, as does the overall RT. When subjects select responses in the other order— character before tone—and promptly execute responses (i.e., without response grouping), the character-task response will be emitted well before the tone-task response (see the right panel of Figure 1). Given our IRI definition, these trials produce negative IRI values. If we ignore the negative sign (which merely indicates that the character response came first), we see that these IRIs should be roughly equal to the duration of central processing on the tone task (again, 300–400 msec on average). A third possibility (not shown in Figure 1) is that subjects will perform central operations in one of the two possible orders, but then emit responses in close temporal synchrony (“response grouping”; Borger, 1963); that is, they will withhold the response selected first until they are ready to make the response selected second. In this case, the IRI should be relatively small (perhaps between 2150 and 1150 msec). There should still be some variability in IRIs, but this variability should be far smaller than that observed when responses are not grouped (Pashler & Johnston, 1989). Together, these predictions suggest that the distribution of IRIs aggregated across subjects should have three distinct and identifiable components.1 One component (corresponding to the case where tone-task central operations are performed before character-task central operations, without response grouping) should have a mode in the 300– 400 msec range and should depend strongly on character-task S–R compatibility. Another component (corresponding to the case where character-task central operations are performed before tone-task central operations, without response grouping) should have a mode in
804
RUTHRUFF, PASHLER, AND HAZELTINE
Tone Before Character
Character Before Tone
Compatible Character Task Tone
Perceptual Processing
Character
Perceptual Processing
Response Selection
Compatible Character Task Response Execution
Response Selection
Response Execution
Perceptual Processing
Character
Perceptual Processing
Response Selection
Perceptual Processing
Character
Perceptual Processing
Response Selection
Response Selection
Response Execution
Response Execution
Incompatible Character Task
Incompatible Character Task Tone
Tone
Response Execution
Response Selection
Response Execution
Tone
Perceptual Processing
Character
Perceptual Processing
Response Selection
Response Selection
Response Execution
Response Execution
Figure 1. Example processing time diagrams for a central bottleneck model of the 0-msec SOA condition of Experiment 1. The left panel corresponds to trials where tone-task central operations are performed first; the right panel corresponds to trials where character-task central operations are performed first. The top panel corresponds to the compatible stimulus–response mapping on the character task; the bottom panel corresponds to the incompatible mapping.
the 2300 to 2400 msec range and should not depend on character-task S–R compatibility. The third component (corresponding to response grouping) should have a mean near zero with an especially low variance and should not depend on S–R compatibility. Compatibility effects on the character task. For the character task, letters were mapped compatibly onto responses but digits were not (for half the subjects), or vice versa (for the other half of the subjects). Because S–R compatibility was manipulated within blocks, subjects did not know in advance of each trial whether the character task would be compatible or incompatible. According to the central bottleneck model, the effects of character-task S–R compatibility on the character task itself should be roughly additive with the effects of SOA (see McCann & Johnston, 1992; Pashler, 1984; Pashler & Johnston, 1989; Schweickert, 1978; Schweickert & Townsend, 1989). In brief, the reason is that the start of the central stage may be delayed at short SOAs (due to the bottleneck), but after this delay it proceeds at full speed. Because this stage proceeds at the same speed in all conditions (and is on the “critical path”), the effect of S–R compatibility should remain unchanged. Carryover of compatibility effects onto tone-task RT. The central bottleneck model also makes specific predictions regarding the effects of the character-task S–R compatibility manipulation on the tone task at the short SOA (0 msec). If tone-task central operations are performed before character-task central operations and the responses are not grouped (see the left panel of Figure 1), then tone-task RT should not be influenced by the S–R compatibility manipulation on the character task; that is, no carryover should occur. A different result is expected, however, when character-task central operations are performed before tone-task central operations (see the right
panel of Figure 1). In this case, prolongation of central operations in the character task (due to the incompatible S–R mapping) should delay the start of central operations on the tone task and thus increase tone-task RT as well. In fact, it should increase by roughly the same amount as the character task RT increases; that is, there should be full carryover of the compatibility effect onto tone-task RT. Carryover should also occur when responses are grouped together, regardless of the central processing order. These carryover predictions can also be expressed in terms of the effects on the IRI distributions. Full carryover (predicted when character-task central operations are performed first or when responses are grouped together) implies that the IRIs should not be influenced by the compatibility manipulation. However, zero carryover (predicted when tone-task central operations are performed first, without response grouping) implies that the IRIs should be strongly influenced by character-task S–R compatibility. Summary of central bottleneck model predictions. In summary, the central bottleneck model makes several clear predictions. First, the distribution of IRIs should have three distinct and identifiable components: tone before character, character before tone, and response grouping. Second, character-task compatibility effects on the character task itself should not depend on the SOA. Third, at the 0-msec SOA, these character-task compatibility effects should not carry over onto tone-task RT when the tonetask response is emitted well before the character-task response, but should carry over fully when the charactertask response is emitted well before the tone-task response. Capacity-Sharing Model Predictions To derive useful predictions from this class of models, it is necessary to first specify in more detail what is meant by “capacity sharing.” As a starting point, we adopt the
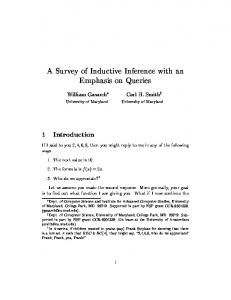
DUAL-TASK INTERFERENCE WITH EQUAL TASK EMPHASIS model proposed by McLeod (1977; see also Tombu & Jolicœur, 2003), which is reasonably well specified and plausible, and which can account for most previous PRP findings. As in the central bottleneck model, processing is decomposed into three stages: perceptual processing, central processing, and response execution. The perceptual and response execution stages are assumed to operate in parallel with any other stages with no capacity limitations (provided there are no conflicts for a particular input or output modality). The central stages can also operate in parallel with other stages, as shown in Figure 2A, but require a share of a fixed, limited pool of resources. Capacity can be allocated to each of two tasks (Y, Z) in any arbitrary combination in order to meet the current task demands, provided that the values are positive and sum to 1 (i.e., there is no unused capacity while a central stage is under way). Capacity can be dynamically reallocated as soon as a new task needs central processing or an old task completes central processing.2 Figure 2B shows a possible allocation of capacity to central operations on Tasks Y and Z over time; in this case central operations on Task Y finish first, at which point Task Z instantaneously receives the entire capacity.3 McLeod (1977) did not specify exactly how the rate of central processing depends on capacity, but here we make the most straightforward assumption, which is that processing rate is proportional to capacity (see also Pashler, 1984). This capacity-sharing model is similar in many respects to the central bottleneck model, except for the critical assumption that central operations can proceed in parallel. In fact, this model includes the central bottleneck model
A Task Y
Perceptual Processing
Task Z
Perceptual Processing
Central Processing
Central Processing
Response Execution
Response Execution
CAPACITY
B Task Y Task Z
TIME Figure 2. (A) Example processing time diagram for the capacitysharing model. (B) Central operations on Tasks Y and Z share a limited pool of capacity over time.
805
as a special case where capacity allocation is always allor-none (i.e., [0,1] or [1,0], where the two numbers in brackets correspond to the proportion of capacity allocated to Tasks Y and Z, respectively). Thus, this capacitysharing model can explain existing PRP data (which appear to support the central bottleneck model) simply by asserting that PRP experiments encourage all-or-none capacity allocation. The key issue is whether, under instructions that encourage task sharing, we will continue to see all-or-none allocation (i.e., a bottleneck) or instead see evidence of actual capacity sharing (e.g., allocations such as [.5,.5]). Interresponse intervals. The present experiments, unlike most PRP experiments, did not emphasize one task over the other. Subjects were encouraged to respond to both tasks quickly and accurately. In addition, each task was equally likely to appear first. Thus, if capacity sharing is possible, these instructions would appear to encourage a roughly even split of capacity between the two tasks (later we will consider more complicated possibilities). If so, one should expect a unimodal distribution of IRIs. This distribution should be fairly broad due to variation in the completion times of the two tasks. Given similar mean single-task RTs to the character and tone tasks, one might expect the center of this distribution to be located somewhere near zero (though it could be shifted away from zero if one task generally receives more capacity than the other). Response grouping might also occur on some trials. If the decision to group responses is random (in the General Discussion we consider more exotic possibilities), then grouping should simply increase the height of the IRI distribution near 0 msec. As noted by Pashler (1994a), on trials where grouping occurs it is difficult to discriminate capacity sharing from central postponement; thus, wherever possible, our analyses focus on subsets of the data not influenced by response grouping. Compatibility effects. At long SOAs (21,000 and 11,000 msec), where the first task can generally be completed prior to the arrival of the stimulus for the second task, each task should receive the entire capacity. At the 0msec SOA, however, capacity is likely to be shared. The reduced capacity should slow the central stages and thus magnify the compatibility effects relative to the 21,000and 11,000-msec SOAs (see Pashler, 1984). The exact size of the increase in compatibility effects at the 0-msec SOA depends on the amount of time during which tone-task central operations overlap with charactertask operations. If there is no temporal overlap, then no increase should occur. If there is temporal overlap, which seems likely given that the mean RTs to the tone and character tasks were similar, then an increase in compatibility effects should occur. In this case, the size of the increase depends on the allocation of capacity. Let Ctone and Cchar represent the proportions of capacity allocated to the tone task and character task, respectively. As shown in the Appendix, the maximum possible increase in the charactertask compatibility effect at the short SOA is Ctone/C char times the baseline (long SOA) compatibility effect. For
806
RUTHRUFF, PASHLER, AND HAZELTINE
example, with equal capacity sharing [0.5,0.5] and maximum temporal overlap, the compatibility effect at the 0msec SOA would be twice the size of the baseline compatibility effect at long SOAs. Carryover of compatibility effects onto tone-task RT. The predicted carryover of character-task compatibility effects onto tone-task RT depends on the amount of overlap between the central operations of the two tasks and on the capacity allocation. If there is no overlap, then no carryover should occur. If there is complete temporal overlap, then there should also be complete carryover; that is, the carryover should be equal to the baseline (long SOA) compatibility effect on character-task RT (see the Appendix for details). Because the amount of temporal overlap and the exact capacity allocation are unknown, the capacity-sharing model considered here does not make specific predictions about the effects of compatibility on the character task itself and the carryover onto the tone task, when considered individually. However, the model does make specific, testable predictions about these effects when considered jointly. As discussed in the Appendix, these effects should be linearly related. The reason is that both effects depend on the exact same set of variables (temporal overlap and capacity allocation). Figure 3 shows the predicted carryover effect plotted against the predicted increase in the effect of compatibility on the character task at the short SOA, expressed as a proportion of the baseline (long SOA) compatibility effect. Predictions are shown for several different allocations of capacity to the two tasks. The predictions for each allocation are represented by a line. The exact location along this line depends on the degree of
temporal overlap: Points on the lower left (indicating no increase in compatibility effects and no carryover) correspond to the case where there is no temporal overlap, and points on the right correspond to cases where there is substantial temporal overlap. Also shown in Figure 3, on the far left, are two points corresponding to cases in which the central operations are processed strictly serially ([0,1] and [1,0]), as predicted by the central bottleneck model. The dashed line connecting these two points represents possible mixtures (across trials) of the two strictly serial processing orders. Note that each possible capacity allocation is consistent with only a limited range of combinations of compatibility and carryover effects. Thus, by examining the values for these two effects from an experiment, we can estimate the capacity allocations used in that experiment.4 Summary of capacity-sharing predictions. If capacity is shared roughly equally between tasks, then one would expect a broad, unimodal distribution of IRIs. In addition, the effects of character-task S–R compatibility on the character task itself should be larger at the 0-msec SOA than at the long SOAs. Furthermore, these compatibility effects should partially carry over onto tone-task RT. Jointly, the effects of character-task S–R compatibility on the character task itself and on the tone task (i.e., carryover) can be used to estimate how capacity was allocated to the two tasks (Figure 3). If this estimate indicates extreme capacity allocations ([0,1] or [1,0]), then there is no evidence for graded capacity sharing. EXPERIMENT 1 The goal of Experiment 1 was to test the predictions of the central bottleneck and the capacity-sharing model. To ensure that subjects were familiar with the tasks before we began collecting data, the first four blocks (a total of 152 trials) were considered practice. Method
Figure 3. Capacity-sharing model predictions. Shown are the predicted increases in the effects of the compatibility manipulation on RT to the character task itself at the short SOA relative to the long SOA and the predicted carryover of compatibility effects onto tone-task RT at the short SOA. Predictions are shown for several possible allocations of capacity to the two tasks: [0,1], [.7,.3], [.5,.5], [.3,.7], and [1,0], where the first and second numbers in brackets indicate the capacity initially allocated to the character and tone tasks, respectively. The asterisk represents the results from Experiment 1 (with standard error bars).
Subjects. Thirty-two undergraduates at the University of California, San Diego, participated in exchange for partial course credit. Stimuli. Tone stimuli were presented at 100, 800, or 3000 Hz and lasted for 150 msec. Character stimuli (A, B, C, 1, 2, 3), subtending 1.4º horizontally 3 1.9º vertically, were white against a black background. Procedure. Subjects responded to the 100-, 800-, and 3000-Hz tones by saying “low,” “medium,” and “high,” respectively. The experimenter taped the session and later verified with a spot check that tone-task accuracy was greater than 90% for each subject. Subjects responded to character stimuli (A, B, C, 1, 2, 3) by pressing the “j,” “k,” or “l” key. For half the subjects, the letters A, B, and C were mapped in alphabetic order onto the three response keys from left to right (i.e., compatibly), but the numbers were mapped in a scrambled order (3, 1, 2) onto the same three response keys, producing an incompatible mapping. For the remaining subjects, numbers were mapped compatibly (1, 2, 3) but letters were mapped incompatibly (C, A, B). Subjects completed 12 blocks of 38 trials each (2 warmup trials plus 36 test trials). Each trial began with the presentation of a fixation cross for 1,000 msec, followed by a blank field for 500 msec, followed by the tone and/or character stimuli. Three different SOAs between the tone and character were used: 21,000, 0, and 1,000 msec. Positive SOAs indicate that the tone sounded before the character
DUAL-TASK INTERFERENCE WITH EQUAL TASK EMPHASIS appeared, whereas negative SOAs indicate that the character appeared before the tone sounded. If an error was detected, an error message was displayed for 1 sec. The next trial began 1 sec later. At the end of each block of trials, subjects received performance feedback (RT and percent correct) and were allowed to take a short break. Subjects were asked to respond to both tasks as quickly and accurately as possible. Both tasks were given equal emphasis. The instructions neither encouraged nor discouraged any particular response pattern.
Results Subjects with character-task error rates greater than 15% in either the compatible or the incompatible condition were eliminated from the analyses (n 5 3), as were subjects who tended to group responses even at the 21,000 and 1,000 msec SOAs (n = 3). In addition, trials with an error, an RT less than 200 msec (,1% of all trials), or an RT greater than 3 sec (,1% of all trials) were excluded from the analyses. Main effects. Mean tone-task and character-task RTs, as well as character-task error rates, are shown in Table 1 as a function of SOA and character-task response compatibility. There was a significant main effect of SOA on both the character task [F(2,50) 5 84.1, p , .001] and the tone task [F(2,50) 5 116.9, p , .001], reflecting substantial dual-task slowing at the 0-msec SOA. There was also a significant main effect of compatibility on the character task [F(1,25) 5 63.2, p , .001]; RTs were 174 msec longer, on average, in the incompatible condition than in the compatible condition. Error data on the character task showed a small but significant main effect of SOA [F(2,50) 5 3.7, p , .05]. In addition, errors were much less frequent in the compatible condition (0.4%) than in the incompatible condition (4.9%) [F(1,25) 5 72.4, p , .001]. IRI distributions. Figure 4A shows the distribution of IRIs for the 0-msec SOA condition. Plotted are the proportion of responses, averaged across subjects, in each 60msec bin; the open squares represent the compatible condition and the filled circles represent the incompatible condition. Qualitatively, the aggregate IRI distributions appear to match the predictions of the central bottleneck model. That model predicts that there will be one high-
variance component with a mode between 2300 and 2400 msec (where tone-task central operations are performed first) that should depend on character-task compatibility and another high-variance component with a mode between 300 and 400 msec (where character-task central operations are performed first) that should not depend on character-task compatibility. There is also apparent evidence for the third predicted component (corresponding to grouped responses) with relatively low variance and a mean near zero. Although the aggregate data show three components, individual subjects often show evidence for only one or two of the predicted components (e.g., some do not group responses, others prefer one response order over the other). This point is evident in Figure 4B, which shows the histogram of IRIs (averaged across the compatible and incompatible conditions) for two subgroups, one with extensive response grouping and one with relatively little response grouping. To make this classification we counted the number of responses for each subject in the bin extending from 230 to 130 msec (which, according to the bottleneck model, should consist primarily of trials where response grouping occurred). The subjects suspected of extensive grouping (n 5 8) all had 10 or more responses in this bin, whereas the remaining subjects (n 5 18) all had 7 or fewer responses in this bin. The 18 “nongroupers” (diamond symbols connected by a solid line) clearly show bimodality and the two modes fall just where the bottleneck model predicts they would fall ( plus or minus 300– 400 msec). The 8 subjects suspected of grouping (plus symbols connected by a dotted line) also show evidence for these same two components in the same places. However, these subjects also produced a narrow spike of IRIs near 0 msec. The narrowness of this spike suggests response grouping (i.e., an effort to synchronize responses). Thus, the data are consistent with a bottleneck model combined with the reasonable proviso that a minority of subjects frequently grouped responses. The most straightforward prediction from the capacitysharing model with roughly equal sharing is a unimodal distribution of IRIs. This prediction was not confirmed. The dip in response proportion in the bins between 90 and
Table 1 Response Time (RT, in Milliseconds) and Error Rate (ER) for Each Task as a Function of Stimulus Onset Asynchrony (SOA) and Character-Task Stimulus– Response Mapping (Compatible vs. Incompatible) in Experiment 1 SOA 21,000
(Char. Then Tone) Task Tone Compatible Incompatible Character Compatible Incompatible
RT
ER
759 793 740 900
0 (Simultaneous) RT
ER
1,051 1,118 0.2 4.3
807
996 1,157
11,000 (Tone Then Char.) RT
ER
891 869 0.7 3.9
668 869
0.1 6.6
808
RUTHRUFF, PASHLER, AND HAZELTINE
Figure 4. Experiment 1: Proportion of interresponse intervals (IRIs) in each 60msec bin. Positive IRIs indicate that the subject responded to the tone task before the character task; negative IRIs indicate that the subject responded to the character task before the tone task. (A) Compatible (open squares) versus incompatible (filled circles) mapping. (B) Nongroupers (diamonds) versus groupers (plus signs).
210 msec was not predicted by this model, nor was the high proportion of responses in extreme positive or negative IRI bins (e.g., beyond 2450 or 1450 msec). Compatibility effects 3 SOA. Consistent with the central bottleneck model, the data showed no significant interaction between compatibility and SOA on charactertask RT [F(2,50) 5 1.47, p . .2]; the effect of compatibility was 160 msec at the 21,000-msec SOA, 161 msec at the 0-msec SOA, and 201 msec at the 1,000-msec SOA. The capacity-sharing model, however, incorrectly predicted an increase in compatibility effects at the 0-msec SOA. Neither model provides an obvious explanation for the somewhat larger compatibility effects at the 1,000-msec SOA (where the letter task was performed second) relative to the 21,000-msec SOA (where the letter task was performed first). However, this difference was not significant [F(1,25) 5 2.27, p . .1] and might simply be due to sampling error.
Carryover of response compatibility effects onto tone-task RT. At the short SOA (0 msec), we observed significant effects of character-task compatibility on the tone task. Overall, this carryover effect was 67 msec. The central bottleneck model predicts no carryover when the tone-task response is emitted well before the charactertask response, but predicts full carryover (i.e., roughly equal in size to the compatibility effects on the character task itself) onto tone-task RT when the character-task response is emitted well before the tone-task response. Thus, the 67-msec average carryover effect would reflect a mixture of two states, one producing no carryover and one producing full carryover (as noted, response grouping also produces full carryover). To evaluate this prediction, trials with an IRI more negative than 2210 msec were assigned to the tone-before-character category, whereas trials with an IRI greater than 1210 were assigned to the character-before-tone category. Because not all subjects produced adequate numbers of responses in each category
DUAL-TASK INTERFERENCE WITH EQUAL TASK EMPHASIS to permit a meaningful estimate of carryover, each estimate was based only on data from subjects with at least 5 trials in both the compatible and incompatible conditions. With this approach, the carryover of compatibility effects onto tone-task RT in the tone-before-character category was 221 msec (based on 17 subjects, with an average of 11.6 compatible trials and 13.1 incompatible trials), but carryover in the character-before-tone category was 170 msec (based on 18 subjects, with an average of 13.2 compatible trials and 11.6 incompatible trials). The latter carryover effect (170 msec) on the tone task is roughly equal to the 161-msec compatibility effect observed for the character task itself at this SOA, indicating full carryover. Thus, we observed no carryover in the tone-beforecharacter category and full carryover in the characterbefore-tone category, just as predicted by the central bottleneck model. The lack of an increase in compatibility effects on the character task at the short SOA, combined with the substantial carryover onto the tone task, argues against equal or approximately equal capacity sharing. Figure 3 shows the predicted combinations of values for these two effects as a function of the capacity allocation; the asterisk shows the values observed in Experiment 1 along with standard error bars.5 This data point fell within the range predicted from all-or-none capacity allocations ([0,1] and [1,0]); hence the data are consistent with a mixture of the two possible orders of sequential central processing predicted by the central bottleneck model (tone-before-character and character-before-tone). Meanwhile, the data are inconsistent with the predictions based on a roughly equal allocation of capacity to the central operations on the two tasks. Near-Zero IRIs: Grouping or Capacity Sharing? Although the data suggest that subjects often chose extreme allocations of capacity to the central stages, consistent with the bottleneck model, it is nevertheless conceivable that capacity sharing occurred on a subset of trials. In particular, there were a substantial number of trials with IRIs close to zero (at least for a small subset of subjects) that might have resulted from roughly equal capacity sharing. According to the bottleneck model, however, these trials resulted from response grouping (i.e., intentional deferment of one response until the other response has also been selected). There are two findings that support this responsegrouping interpretation. First, these trials show a very tall, narrow peak (see Figure 4B), just as one would expect if responses were occasionally produced as a couplet (Pashler & Johnston, 1989). Second, if there is a central bottleneck and responses are grouped, then the character-task compatibility effect should carry over fully onto tone-task RT (regardless of the order of the central operations). Indeed, for IRIs between 1150 and 2150 msec, the mean effect of compatibility on the character task was 123 msec and the mean carryover onto the tone task was 116 msec. Because the data with IRIs near 0 closely follow the pre-
809
dictions from the central bottleneck model plus response grouping, they do not constitute evidence for capacity sharing. Nevertheless, a primary goal of Experiment 2 will be to replicate these IRI results in a design that produces less response grouping, yielding cleaner data. Discussion The results were generally consistent with the central bottleneck model. First, the distribution of IRIs was consistent the predicted three-component pattern. The central mode (with a peak near 0-msec IRI) is assumed to correspond to trials in which subjects grouped responses. The two extreme modes (with peaks near 1350 and 2350 msec) correspond to the two possible orders in which central processes can be executed (without response grouping). A second finding supporting the central bottleneck model concerns the effects of the character-task S–R compatibility manipulation. The effects of this manipulation on character-task RT were roughly constant across SOAs. In addition, these effects did not carry over onto tone-task RT when the tone-task response came first, but carried over fully when the character-task response came first. The results, however, did not match the predictions of the capacity-sharing model outlined in the introduction. According to this model, central operations operate in parallel but must share a limited pool of resources. First, this model predicts a unimodal distribution of IRIs, contrary to our observations (Figure 4). There was a tendency for subjects to respond to one task well before the other (e.g., by 300– 400 msec) or nearly simultaneously. Meanwhile, there were relatively few responses in intermediate IRI bins (e.g., the IRI bins centered at 60 and 120 msec). The capacity-sharing model also has difficulty accounting for the observed effects of character-task S–R compatibility. As can be seen in Figure 3, the lack of an increase in compatibility effects on the character task at the short SOA combined with the substantial carryover onto the tone task is inconsistent with roughly equal capacity sharing between simultaneous central operations. Instead, it suggests the use of the extreme capacity allocations predicted by the central bottleneck model ([0,1] and [1,0]). EXPERIMENT 2 Experiment 2 had two main purposes. One purpose was to replicate Experiment 1 in a design that produces less response grouping and another purpose was to test a novel prediction regarding the IRI distributions. We adopted a design that has recently been used by several investigators to determine whether dual-task interference can be eliminated after practice (Hazeltine, Ruthruff, & Remington, 2001; Hazeltine et al., 2002; Levy & Pashler, 2001; Schumacher et al., 2001). In this design, there are three conditions: one dual-task condition and two single-task conditions (one for each task). The single- and dual-task conditions are mixed together randomly within a block, so subjects cannot know which combination of tasks will be presented on the upcoming trial. The particular tasks we chose were the
810
RUTHRUFF, PASHLER, AND HAZELTINE
ones used by Hazeltine et al. (2001). One task (auditory– vocal) required a tone classification (as in Experiment 1) and the other task (visual–manual) required the classification of a word as a “bug,” “food,” or “tree.” We had two reasons for adopting this particular design. First, there have been several recent reports that, after several sessions of practice in this paradigm, subjects can sometimes learn to perform two tasks together with very little interference and no sign of a bottleneck. In fact, Hazeltine et al. (2001) found such a result after practice using essentially the same tasks and design as the present Experiment 2. Thus, there is reason to believe that this paradigm is conducive to the overlap of central processing. Second, the use of single-task conditions seems especially likely to discourage the response-grouping strategy (indeed, grouping is not even possible on the singletask trials). By deterring response grouping, we should be able to determine the true central processing modes (serial vs. parallel) adopted by a greater proportion of the subjects. Because there was no compatibility manipulation in this experiment, we will focus only on the distribution of IRIs. The central bottleneck model again predicts that this distribution will have three specific components. We also tested a new prediction of the bottleneck model regarding the effects of SOA in the dual-task condition. We used a slight SOA manipulation (the tone was presented either 50 msec before or 50 msec after the word), because it was generally not noticed by the subjects (the stimuli appear to be simultaneous) and therefore was unlikely to influence any strategic choices made by the subjects. According to the bottleneck model, the task presented first should have a slight head start and therefore should tend to engage the central bottleneck first. The processing order would probably not be strictly first-come-first-served, because subjects faced with variable task orders from trial to trial have a bias toward using the same central processing order used on the previous trial (e.g., De Jong, 1995). Nevertheless, the slight difference in SOAs should still cause a noticeable shift in the proportions of the two processing orders. Although the overall frequency of each of the three components of the IRI distribution will change, the basic shape of each component should stay the same. Consequently, the SOA manipulation should primarily cause a vertical shift in the two components corresponding to nongrouping trials (i.e., the proportion of responses in each bin should be shifted up or down by a constant factor). The predictions of the capacity-sharing model for the effects of the small SOA manipulation are less clear. However, the most straightforward prediction is that the task presented first will receive the total pool of capacity for 50 msec, before roughly equal sharing begins. The effect would be to shift the IRI distributions 50 msec to the left or the right (depending on whether the SOA was positive or negative). Thus, the IRI distributions in the 250 and 150 msec SOAs might differ primarily by a combined horizontal shift (rather than the vertical shift predicted by the central bottleneck model) of about 100 msec.
Method
Subjects. Twelve students from community colleges in the Mountain View, California, area participated in exchange for money or partial course credit. None had participated in Experiment 1. Stimuli. Tone stimuli were presented at 220, 880, and 3520 Hz and lasted for 300 msec. Word stimuli, subtending 1.4º horizontally 3 1.9º vertically, were white against a black background. There were four bug words (ANT, FLEA, APHID, BEETLE ), four food words (EGG, SOUP, CANDY, COOKIE ), and four tree words (OAK , PINE , CEDAR , SPRUCE). The words remained visible until a response was made. Procedure. Subjects responded to the 220-, 880-, and 3520-Hz tones by saying “one,” “two,” or “three,” respectively. Subjects responded to bug, food, and tree words by pressing the “j,” “k,” and “l” keys, respectively. Subjects were first allowed to study the words for each category. They then completed 15 blocks of 63 trials each (including three warmup trials). The first five blocks were considered practice. Each block contained a mixture of 36 dual-task trials (18 trials at each of the two SOAs), 12 single-task tone trials, and 12 single-task word trials. Because subjects did not know which task(s) would appear, they presumably prepared for both of them. Subjects were asked to respond quickly and accurately to both tasks. Both tasks were given equal emphasis. Each trial began with the presentation of a fixation cross for 500 msec, then a blank field for 300 msec, followed by the tone and/or words. If an error was made, an error message was displayed for 2,000 msec. The next trial began 500 msec later. At the end of each block of trials, subjects received performance feedback (RT and percent correct) and were allowed to take a short break.
Results Trials with an error, an RT less than 200 msec (,1% of all trials), or an RT greater than 3 sec (,1% of all trials) were excluded from the analyses. Main effects. Mean tone-task and word-task RTs, as well as error rates, are shown in Table 2 as a function of trial type (single vs. dual) and SOA. Dual-task RTs were significantly slower than single-task RTs for both the word task [F(1,11) 5 58.5, p , .001] and the tone task [F(1,11) 5 28.4, p , .001]. Thus, we again found evidence of dual-task interference. IRI distributions. Figure 5A shows the IRI distribution, averaged across subjects. Plotted are the proportion of responses in each 60-msec bin; the open circles represent the 250-msec SOA condition and the filled squares represent the 150-msec SOA condition. These data clearly show the trimodal pattern predicted by the central bottleneck model. These results replicate those of Experiment 1, but with far fewer responses near zero. Thus, the data confirmed our expectations that this design, which includes a substantial of number of single-task trials, would reduce the incidence of response grouping. Table 2 Response Time (RT, in Milliseconds) and Error Rate (ER) for Each Task as a Function of the Number of Tasks (Single, Dual) and SOA (250 msec, 150 msec) in Experiment 2 Dual Single
Word–Tone (250 msec)
Tone–Word (150 msec)
Task
RT
ER
RT
ER
RT
ER
Tone Word
722 755
5.5 4.8
905 1,013
6.8 6.5
871 1,042
7.4 6.3
DUAL-TASK INTERFERENCE WITH EQUAL TASK EMPHASIS
811
Figure 5. Experiment 2: Proportion of interresponse intervals (IRIs) in 60-msec bins as a function of SOA (250 vs. 150 msec). Positive SOAs indicate that the tone sounded before the character appeared, and negative SOAs indicate that the character appeared before the tone sounded. Likewise, positive IRIs indicate that the subject responded to the tone task before the character task; negative IRIs indicate that the subject responded to the character task before the tone task. (A) Actual data. (B) Data conditionalized on response order.
One of the most striking features of the IRI distributions relates to the effect of SOA. Changing the SOA appears to primarily influence the proportion of trials in the two extreme components of the IRI distribution, without noticeably changing the shapes of those distributions. The shift was in the predicted direction—subjects tended to respond to the tasks in the order in which they were presented. Note that the vertical shift was not as large as one would expect from a strict first-come-first-served policy for central processing. De Jong (1995) presented evidence that central processing order is partially determined in advance of the trial; specifically, subjects are biased toward repeating the central processing order used on the previous trial. This bias was also apparent in the present experiment. When subjects responded in one order (without grouping) on a trial, they usually (70% of the time) responded in the same order on the next trial as well.
To facilitate comparisons between the shape of the positive and negative components of the IRI distribution between SOAs, Figure 5B shows the same IRI data conditionalized on response order for each SOA. This procedure serves to equalize the average height of each component for each SOA so that their shapes can be compared more directly. First, we removed data from bins near zero (2210 to 1210 msec), where response grouping was likely to have occurred. Then we divided the proportion of IRIs in each positive IRI bin at the 50-msec SOA by the total proportion of positive IRIs at that SOA, and we divided the proportion of IRIs in each negative bin by the total proportion of negative IRIs at that SOA. This procedure was then repeated for the 250-msec SOA as well. Conditionalizing the data on response order clarified that the shapes and locations of the IRI distributions are very similar for each SOA (see Figure 5B). This finding supports the cen-
812
RUTHRUFF, PASHLER, AND HAZELTINE
tral bottleneck model, which assumes that SOA partially determines which central processing order is used, but does not influence the IRI distribution produced by that processing order. On the other hand, the IRI histogram is inconsistent with the capacity-sharing model, in which central operations on the two tasks share capacity roughly equally. In particular, note the sharp dip in response proportion in the bins close to zero and the large number of responses in extreme IRI bins (beyond 2450 or 1450 msec). Also, as discussed earlier, the most straightforward prediction for the effect of SOA on the IRI distributions is a horizontal shift of roughly 100 msec. Figure 5, however, shows a vertical shift, not a horizontal one. Quantitative test. The arguments just presented for the central bottleneck over the capacity-sharing model were based primarily on a qualitative analysis of the IRI histograms. To provide a quantitative test between these models, we compared the number of trials with IRIs near zero with the number of trials with extreme IRIs. Specifically, we compared the number of responses in the 90– 210 msec IRI bins (both positive and negative) to the number of responses in the 270–390 msec bins (positive and negative). According to the capacity-sharing model, the frequency of responses should be highest in IRI bins near zero and decline at more extreme IRIs. Thus, bins near zero clearly should have more responses than the bins further from zero. According to the bottleneck model, however, there should be relatively few responses in the 90– 210 msec range, because such IRIs are longer than one would expect on trials with response grouping and somewhat shorter than one would expect on trials without response grouping; meanwhile, the bottleneck model predicts that there should be many responses in the 270– 390 msec range, which is close to the mode that one would expect from serial central processing (without grouping). In Experiment 2 the extreme IRI bins had roughly twice as many responses as the bins near 0 msec (.18 vs. .09); this difference was statistically significant [F(1,11) 5 5.0, p , .05]. Eleven of the 12 subjects showed this pattern; the remaining subject appeared to have grouped responses together in close temporal synchrony (54% of responses fell between 2150 and 1150 msec). Thus, this quantitative analysis confirmed the predictions of the central bottleneck model, but not those of the capacity-sharing model. Discussion The IRI distributions obtained in Experiment 2 provide clear evidence for the three components predicted by the central bottleneck model, rather than the unimodal distribution predicted by the capacity-sharing model with roughly equal sharing between tasks. In addition, the effect of SOA was mainly to shift the proportion of trials within each of the three components of the IRI distribution (i.e., a vertical shift), without any apparent change to the position or shape of these components. This finding confirms the predictions of the central bottleneck model,
but is contrary to the straightforward prediction of the capacity-sharing model (a horizontal shift in the distributions of IRIs). GENERAL DISCUSSIO N In this article we considered the possibility that there is graded capacity sharing between central stages, rather than a strict (all-or-none) central bottleneck. Specifically, we evaluated the possibility that subjects can perform central operations in parallel, albeit more slowly than when they perform each central operation in isolation. Our basic approach (unlike that of traditional PRP experiments) was to emphasize each task equally and to encourage subjects to overlap the two tasks as much as possible. Despite conditions that encouraged the overlap of central operations, subjects appeared to perform central operations sequentially. First, the IRI distributions appeared to consist of three distinct components; this trimodal pattern was evident most clearly in Experiment 2 (Figure 5). Thus, we replicated the basic findings of Pashler (1994a) using a different pair of tasks (an auditory–vocal task and a visual–manual task) that minimized the possibility of response conflicts. This finding is consistent with the central bottleneck model, which asserts that subjects must choose one of two possible orders for sequentially performing central operations. The pattern is not consistent, however, with the model outlined in the introduction, in which subjects divide a limited pool of resources roughly equally between central operations on the two tasks. According to the most straightforward version of that model, the IRIs should have a broad, unimodal distribution. The effects of character-task S–R compatibility (Experiment 1) also indicated that central operations were performed sequentially. According to the central bottleneck model, the effects of compatibility on the character task itself should be constant across SOAs. In addition, at the 0-msec SOA, character-task compatibility effects should carry over fully onto tone-task RT when charactertask central operations are performed first but not when they are performed second. These predictions were verified in Experiment 1. According to the capacity-sharing model, however, the effects of character-task S–R compatibility on the character task itself should be larger at the 0-msec SOA than at the long SOAs. The reason is that the tasks must share capacity at the 0-msec SOA. The reduced capacity allocation should prolong central operations, magnifying the effects of the compatibility manipulation on the character task (see Pashler, 1984). Contrary to this prediction, compatibility effects were roughly additive with SOA (Table 1). One could attempt to reconcile the capacity-sharing model with the observed compatibility effects by arguing that tone-task central operations generally finished well before character-task central operations, so that there was little temporal overlap between these central operations. However, this explanation is unsatisfactory for two reasons. First, the tone-task response was often emitted after
DUAL-TASK INTERFERENCE WITH EQUAL TASK EMPHASIS the character-task response (and vice versa). Second, if there was no temporal overlap then there should also have been no carryover of compatibility effects onto tone-task RT (see the Appendix). Thus, the substantial carryover effects combined with no increase in compatibility effects on the character task itself at the short SOA is incompatible with roughly equal capacity sharing between central operations. Figure 3 shows the predictions of the capacitysharing model under various allocations of capacity, along with the observed results (indicated by the asterisk). The observed data are consistent only with very extreme capacity allocations, such as the [0,1] and [1,0] allocations predicted by the central bottleneck model. Revised Capacity-Sharing Model How might the capacity-sharing model described in this paper be revised in order to account for the present data? To account for the compatibility effects described here, one could postulate that more capacity is allocated to the character task on incompatible trials than on compatible trials. For example, a subject assigned to the compatible mapping of digits onto the three response keys (1, 2, 3) and the incompatible mapping of letters onto the three response keys (C, A, B) might allocate more capacity to the character task when a letter is presented than when a digit is presented. Relative to the original capacity-sharing model, this revised model would predict a smaller increase in compatibility effects at the short SOA and would predict more carryover of compatibility effects on to the tone task. In other words, the predicted results would be more in line with the observed results. Even if capacity allocation is adjusted dynamically depending on the category of the present stimulus, this revised capacity-sharing model still cannot easily account for the IRI distributions (Figure 5), which appear to consist of three distinct components. Capacity sharing plus random response grouping could create a spike in the center of the IRI distribution, but would not produce the dip in the proportion of responses at IRIs near 200 msec. To explain the dip one could further propose that response grouping is not random, but occurs primarily on trials that would have produced an IRI of about plus or minus 200 msec. This selective response grouping would take trials away from bins near 200 msec and redistribute them to bins near 0 msec. Although this revised capacity-sharing model might appear to explain the aggregate data from Experiment 1, it incorrectly predicts that the dip should be the smallest for the subjects with the smallest number of grouped responses. In fact, Figure 4B shows that the subset of participants (n = 18) who rarely grouped responses actually showed a much more pronounced dip than did those (n = 8) who appeared to frequently group responses. Likewise, Experiment 2 produced very little response grouping overall, yet the drop in the frequency of IRIs was near 2200 msec and 1200 msec (see Figure 5). To explain the IRI data, a capacity-sharing model would need to add some further provision—for example, that subjects tend to use extreme capacity allocations (e.g.,
813
[.2,.8] and [.8,.2]) while rarely adopting intermediate allocations. It is not clear, however, why subjects capable of graded capacity sharing would primarily utilize extreme allocations (see Tombu & Jolicœur, 2003, for one possible explanation). In contrast, the central bottleneck model provides a clear rationale for the appearance of two distinct allocations because it states that those two allocations ([0,1] and [1,0]) are the only feasible choices. It is conceivable, of course, that subjects did share capacity between simultaneous central operations on a small proportion of trials. The present data cannot rule out this hypothesis. At the same time, there appears to be little evidence in favor of it, either. The central bottleneck model with occasional response grouping can explain the present findings extremely well without the additional assumption that there was a subset of trials where capacity was shared. Therefore, parsimony would seem to favor the straightforward bottleneck model. Of course, we cannot rule out the possibility that capacity sharing can occur under conditions not investigated in the present experiments. For example, central capacity sharing might occur after extensive practice, with greater incentives, or with much easier tasks. Further work, perhaps using the same techniques as those employed in the present study, is needed to evaluate these possibilities. Structural Versus Voluntary Bottlenecks It has been noted that the central bottleneck observed in the PRP paradigm might occur as a result of the Task 1 emphasis instructions (e.g., Meyer & Kieras, 1997a, 1997b); that is, subjects might have the latent ability to perform central operations in parallel with no interference, but instead voluntarily adopt a bottleneck strategy (to satisfy the Task 1 emphasis instructions). If so, one might expect the central bottleneck to be eliminated when both tasks are given equal emphasis. There are now several studies, including the present one, that contradict this prediction (Carrier & Pashler, 1995; Levy & Pashler, 2001; Pashler, 1994a; Ruthruff et al., 1995, Experiment 3; Ruthruff, Pashler, & Klaassen, 2001; Tombu & Jolicœur, 2000). It remains to be seen whether the central bottleneck can be eliminated under even more extreme pressure to overlap central processing. In any case, it seems clear that the central bottleneck cannot be attributed to PRP instructions. Our results instead support the hypothesis that the central bottleneck is due to the cognitive architecture. The bottleneck might occur because humans have insufficient capacity to carry out more than one central operation at a time. Alternatively, the bottleneck might be imposed by executive control mechanisms to maintain a coherent course of action (e.g., to avoid selecting two conflicting responses). Although the central bottleneck cannot easily be eliminated at relatively low practice levels, there is recent evidence suggesting that it can sometimes be eliminated after considerable practice (Hazeltine et al., 2001; Hazeltine et al., 2002; Levy & Pashler, 2001; Schumacher et al., 2001). It remains to be seen whether the apparent elimination of the central bottleneck occurs because central op-
814
RUTHRUFF, PASHLER, AND HAZELTINE
erations are performed in parallel or because practice in some cases eliminates the need for central operations. For instance, it is possible that there are two processing routes to activate a response code (see Lien & Proctor, 2002), one of which (response selection) comprises the central bottleneck and one of which (automatic response activation) does not. Perhaps early in practice subjects must rely on the route that does comprise the central bottleneck, but with practice they learn to rely on the processing route that does not comprise the central bottleneck (see Ruthruff, Johnston, & Van Selst, 2001). Summary Previous dual-task studies have generally indicated that, at relatively low levels of practice, subjects perform central operations in series rather than in parallel. However, these studies might have discouraged parallel central processing (e.g., because of instructions emphasizing one task over the other). The purpose of the present study was to see whether subjects can perform central operations on two novel tasks in parallel under more favorable conditions. These conditions include the use of relatively simple tasks, equal task emphasis, and explicit encouragement to perform the tasks in parallel. Substantial dual-task interference was obtained, which, a priori, could be due to a central bottleneck (serial performance of central stages) or to central capacity sharing (parallel performance of central stages, albeit with interference). The observed IRI distributions and S–R compatibility effects, however, suggest that subjects generally did not share capacity roughly equally between tasks. Instead, it appears that subjects first devoted all (or at least the vast majority) of their capacity to the central operations of one task and then devoted their entire capacity to the central operations of the other task. Thus, the only way a capacity-sharing model can fit our data is to mimic the sequential processing assumed by the central bottleneck model. Given the evidence that central bottlenecks occur even under favorable conditions for parallel central processing, it appears that central bottlenecks might be widespread in the real world. REFERENCES Borger, R. (1963). The refractory period and serial choice-reactions. Quarterly Journal of Experimental Psychology, 15, 1-12. Carrier, M., & Pashler, H. (1995). Attentional limitations in memory retrieval. Journal of Experimental Psychology: Learning, Memory, & Cognition, 21, 1339-1348. De Jong, R. (1993). Multiple bottlenecks in overlapping task performance. Journal of Experimental Psychology: Human Perception & Performance, 19, 965-989. De Jong, R. (1995). The role of preparation in overlapping-task performance. Quarterly Journal of Experimental Psychology, 48A, 2-25. Hazeltine, E., Ruthruff, E., & Remington, R. W. (2001, November). Dual-task costs depend on the pairings of stimulus and response modalities. Paper presented at the annual meeting of the Psychonomic Society, Orlando, FL. Hazeltine, E., Teague, D., & Ivry, R. B. (2002). Simultaneous dualtask performance reveals parallel response selection after practice. Journal of Experimental Psychology: Human Perception & Performance, 28, 527-545.
Hommel, B. (1998). Automatic stimulus–response translation in dualtask performance. Journal of Experimental Psychology: Human Perception & Performance, 24, 1368-1384. Johnston, J. C., & Delgado, D. F. (1993, November). Bypassing the single-channel bottleneck in dual-task performance. Paper presented at the annual meeting of the Psychonomic Society, Washington, DC. Jolicœur, P., & Dell’Acqua, R. (1998). The demonstration of shortterm consolidation. Cognitive Psychology, 36, 138-202. Kahneman, D. (1973). Attention and effort. Englewood Cliffs, NJ: Prentice-Hall. Keele, S. W. (1973). Attention and human performance. Pacific Palisades, CA: Goodyear. Levy, J., & Pashler, H. (2001). Is dual-task slowing instruction dependent? Journal of Experimental Psychology: Human Perception & Performance, 27, 862-869. Lien, M.-C., & Proctor, R. W. (2000). Multiple spatial correspondence effects on dual-task performance. Journal of Experimental Psychology: Human Perception & Performance, 26, 1260-1280. Lien, M.-C., & Proctor, R. W. (2002). Stimulus–response compatibility and psychological refractory period effects: Implications for response selection. Psychonomic Bulletin & Review, 9, 212-238. Lien, M.-C., Schweickert, R., & Proctor, R. W. (2003). Task switching and response correspondence in the psychological refractory period paradigm. Journal of Experimental Psychology: Human Perception & Performance, 29, 692-712. Logan, G. D., & Schulkind, M. D. (2000). Parallel memory retrieval in dual-task situations: I. Semantic memory. Journal of Experimental Psychology: Human Perception & Performance, 26, 1260-1280. McCann, R. S., & Johnston, J. C. (1992). Locus of the single-channel bottleneck in dual-task interference. Journal of Experimental Psychology: Human Perception & Performance, 18, 471-484. McCann, R. S., Remington, R. W., & Van Selst, M. (2000). Automaticity in visual word processing: A dual-task investigation. Journal of Experimental Psychology: Human Perception & Performance, 26, 1352-1370. McLeod, P. (1977). Parallel processing and the psychological refractory period. Acta Psychologica, 41, 381-396. Meyer, D. E., & Kieras, D. E. (1997a). A computational theory of executive cognitive processes and multiple-task performance: Part 1. Basic mechanisms. Psychological Review, 104, 3-65. Meyer, D. E., & Kieras, D. E. (1997b). A computational theory of executive cognitive processes and multiple-task performance: Part 2. Accounts of psychological refractory-period phenomena. Psychological Review, 104, 749-791. Meyer, D. E., Kieras, D. E., Lauber, E., Schumacher, E. H., Glass, J., Zurbriggen, E., Gmeindl, L., & Apfelblat, D. (1995). Adaptive executive control: Flexible multiple-task performance without pervasive immutable response-selection bottlenecks. Acta Psychologica, 90, 163-190. Navon, D., & Miller, J. O. (2002). Queuing or sharing? A critical evaluation of the single-bottleneck notion. Cognitive Psychology, 44, 193251. Pashler, H. (1984). Processing stages in overlapping tasks: Evidence for a central bottleneck. Journal of Experimental Psychology: Human Perception & Performance, 10, 358-377. Pashler, H. (1994a). Graded capacity-sharing in dual-task interference? Journal of Experimental Psychology: Human Perception & Performance, 20, 330-342. Pashler, H. (1994b). Overlapping mental operations in serial performance with preview. Quarterly Journal of Experimental Psychology, 47A, 161-191. Pashler, H., & Johnston, J. C. (1989). Chronometric evidence for central postponement in temporally overlapping tasks. Quarterly Journal of Experimental Psychology, 41A, 19-45. Pashler, H., & Johnston, J. C. (1998). Attentional limitations in dualtask performance. In H. Pashler (Ed.), Attention (pp. 155-189). Hove, U.K.: Psychology Press. Ruthruff, E., Johnston, J. C., & Van Selst, M. (2001). Why practice reduces dual-task interference. Journal of Experimental Psychology: Human Perception & Performance, 27, 3-21. Ruthruff, E., Johnston, J. C., Van Selst, M., Whitsell, S., & Rem-
DUAL-TASK INTERFERENCE WITH EQUAL TASK EMPHASIS ington, R. (2003). Vanishing dual-task interference after practice: Has the bottleneck been eliminated or is it merely latent? Journal of Experimental Psychology: Human Perception & Performance, 29, 280-289. Ruthruff, E., Miller, J. O., & Lachmann, T. (1995). Does mental rotation require central mechanisms? Journal of Experimental Psychology: Human Perception & Performance, 21, 552-570. Ruthruff, E., Pashler, H. E., & Klaassen, A. (2001). Processing bottlenecks in dual-task performance: Structural limitation or voluntary postponement? Psychonomic Bulletin & Review, 8, 73-80. Schumacher, E. H., Seymour, T. L., Glass, J. M., Kieras, D. E., & Meyer, D. E. (2001). Virtually perfect time sharing in dual-task performance: Uncorking the central attentional bottleneck. Psychological Science, 121, 101-108. Schweickert, R. (1978). A critical path generalization of the additive factor method: Analysis of a Stroop task. Journal of Mathematical Psychology, 18, 105-139. Schweickert, R., & Townsend, J. T. (1989). A trichotomy: Interactions of factors prolonging sequential and concurrent mental processes in stochastic discrete mental (PERT) networks. Journal of Mathematical Psychology, 33, 328-347. Sommer, W., Leuthold, H., & Schubert, T. (2001). Multiple bottlenecks in information processing? An electrophysiological examination. Psychonomic Bulletin & Review, 8, 81-88. Tombu, M., & Jolicœur, P. (2000, November). Is the PRP effect due to a strategic or structural bottleneck? Poster presented at the annual meeting of the Psychonomic Society, New Orleans. Tombu, M., & Jolicœur, P. (2003). A central capacity sharing model of dual-task performance. Journal of Experimental Psychology: Human Perception & Performance, 29, 3-18. Van Selst, M., Ruthruff, E., & Johnston, J. C. (1999). Can practice eliminate the psychological refractory period effect? Journal of Ex-
815
perimental Psychology: Human Perception & Performance, 25, 12681285. Welford, A. T. (1952). The “psychological refractory period” and the timing of high-speed performance—A review and a theory. British Journal of Psychology, 43, 2-19. NOTES 1. Depending on individual differences, some subjects might show only one or two of the three predicted components. 2. The reallocation assumption is needed to adequately explain observed PRP effects. If capacity were not reallocated, then Task 2 RT would be slow at all SOAs, not just the short ones. 3. Rather than assume capacity shifts are instantaneous, one could allow for a switch cost. The inclusion of a modest switch time would not materially alter the predictions discussed below. 4. A complication arises if capacity allocation varies considerably from trial to trial. Nevertheless, each point on Figure 3 is consistent only with certain combinations of capacity allocations. For instance, a finding of zero increase in compatibility effects combined with substantial carryover (as we found in Experiment 1) suggests that intermediate capacity allocations rarely, if ever, occurred. 5. The predictions shown in Figure 3 are expressed as a ratio of the baseline (long SOA) compatibility effect so that they will be independent of the effect size observed in a particular experiment. To place the results of Experiment 1 on this plot, it was necessary to rescale the values reported earlier. The mean character-task compatibility effect was 161 msec at the short SOA and 180.5 msec at long SOAs (21,000 and 11,000 msec). Thus, the compatibility effect at short SOAs was 0.89 times that found at the long SOAs, producing an “increase” of 20.11. The carryover of S–R compatibility onto tone-task RT was 67 msec, which is 0.37 times the baseline (long SOA) compatibility effect on the character task itself.
APPENDIX Capacity-Sharing Model Predictions for the Effect of S–R Compatibility In this Appendix we determine how manipulations of the duration of central processing should affect dual-task RTs, according to the capacity-sharing model outlined in the introduction (where central stages share capacity, but input and output stages do not). Specifically, the goal is to determine what effect a manipulation of the Task Y central stage will have on RT to Task Y itself and how much of this effect will carry over onto RT to Task Z. For the sake of concreteness, we focus on the central stage manipulation used in the present Experiment 1: character-task S–R compatibility. It is convenient to model the effect of incompatibility as simply adding a central stage (Stage “I”) beyond that required in the compatible condition. The compatibility effect on the character task itself, therefore, is simply the average time to complete Stage I. Let CY and CZ represent the proportion of capacity (assumed to be constant across trials) allocated to Task Y and Task Z when their central operations are both pending at the same time, where CY 1 CZ 5 1. Let W be a random variable representing the total amount of work required on a particular central stage on a particular trial, defined as the time (in milliseconds) it would take to complete that stage under full capacity. Under reduced capacity, the actual time T required to complete the work depends on the proportion of capacity allocated to that task; that is, W 5 T * C. Compatibility Effects on Task Y The compatibility effect on Task Y at the long SOA (CE long _SOA), where Task Y is assumed to operate at full capacity, is simply the average time required to complete Stage I. Thus, it is equal to the expected value of WI. CE long _SOA 5 E (W I). At short SOAs, however, Stage I will sometimes share capacity with Task Z; the reduced capacity will prolong Stage I and hence increase CEshort_SOA relative to CE long _SOA. Let Toverlap be a random variable representing the amount of time during which Stage I of Task Y overlaps with central operations on Task Z (i.e., the amount of time Stage I operates with reduced capacity). Let Woverlap,Y represent the amount of work accomplished on Task Y during Toverlap. Woverlap,Y = Toverlap * CY
(A1)
816
RUTHRUFF, PASHLER, AND HAZELTINE APPENDIX (Continued) CEshort_SOA, the average time to complete Stage I at the short SOA, is equal to the expected value of Toverlap plus the expected value of the time to complete the remaining work (WI 2 W overlap,Y) at full capacity. Therefore, CE short_SOA 5 E (Toverlap ) 1 E (W I ) 2 E (Woverlap,Y). Substituting the value of W overlap,Y from Equation 1 and noting that CZ 5 1 2 CY, it follows that CE short_SOA 5 E (WI ) 1 E (Toverlap) * CZ. The average increase in the compatibility effect at the short SOA relative to the long SOA (denoted by DCE) is equal to CE short_SOA minus CE long _SOA. Thus, DCE 5 E (WI ) 1 E (Toverlap ) * CZ 2 E (WI ) DCE 5 E (Toverlap ) * CZ
(A2)
As an informal explanation of Equation 2, note that Toverlap * CZ is the amount of work completed on Task Z while it overlaps with Stage I of Task Y. This work completed on Task Z means lost work on Task Y, which must be made up later at a cost of 1 msec per unit of lost work. The maximum possible DCE is obtained with maximum Toverlap, which occurs when all the work on Stage I of Task Y is performed under reduced capacity. Thus, max (Toverlap) 5 WI /CY. Under this condition, DCE will be equal to CE long _SOA * (C Z /C Y). With equal capacity sharing ([0.5,0.5]), for example, DCE would be equal to CE long _SOA; thus, CE short_SOA would be twice as large as CE long _SOA. Carryover of Compatibility Effects onto Task Z The carryover of the Task Y compatibility effect onto RT to Task Z is simply the lengthening of Task Z central operations during the overlap with Stage I of Task Y. Let Woverlap, Z represent the amount of work accomplished on Task Z during Toverlap at reduced capacity CZ on a given trial. Woverlap, Z 5 Toverlap * CZ
(A3)
The time cost of the overlap on Task Z is the time required to complete Woverlap, Z under reduced capacity (i.e., Toverlap) minus the time it would have taken to complete the same amount of work under full capacity. Thus, the time cost is equal to Toverlap 2 Woverlap, Z. Using Equation A3, this time cost can also be expressed as Toverlap 2 Toverlap * CZ, which reduces to Toverlap * CY. Thus, the average carryover effect is given by Carryover 5 E (Toverlap) * CY (A4) As an intuitive explanation, note that Toverlap * CY is the amount of Task Z work lost to Task Y during the overlap, to be made up later at a cost of 1 msec per unit of lost work. The maximum carryover effect (obtained with maximum Toverlap ) is equal to E(WI ), which is simply the baseline (long SOA) compatibilityeffect on Task Y (i.e., CElong _SOA). Thus, the baseline compatibility effect can carry over fully onto Task Z, but no more. Carryover Versus D CE Note that DCE (see Equation A2) and carryover (see Equation A4) are linearly related to each other: DCE 5 Carryover * (CZ /C Y ). Also note that the maximum possible carryover and maximum possible DCE are both proportional to the baseline compatibility effect (CE long _SOA). Therefore, it is convenient to divide each term by CE long _SOA, so that their maximum values do not depend on CE long _SOA: DCE
CE long_SOA
=
Carryover C Z * . CE long_SOA C Y
(A5)
This linear relationship is shown in Figure 3 for several different values of CY and CZ. It should not be surprising that these two measures are tightly coupled. Informally speaking, the effects of compatibility on Task Y itself and the carryover onto Task Z both depend on the amount of work lost to the other task while their central operations overlap. (Manuscript received October 17, 2001; revision accepted for publication December 17, 2002.)