During automatic program animation, explanations after animations have greater impact than before animations Peng Wang
Roman Bednarik
Andrés Moreno
University of Eastern Finland School of Computing Joensuu
University of Eastern Finland School of Computing Joensuu
University of Eastern Finland School of Computing Joensuu
[email protected].fi
roman.bednarik@uef.fi
ABSTRACT
experts already possess mental models that help in understanding [22]. In the domain of computer programming education, it is well known students “cannot make sense of visualisations” [4]. Then, a question arises, what methods, pedagogically and empirically sound, should be used when the teachers are not present and cannot cue students in to engage in meaningful interactions with a program visualization tool? Naps et al. [20] suggested to ”complement visualizations with explanations”, based on research showing that animations are better understood if they are accompanied with concurrently narrated explanations [15]. Naps et al. suggested that also in programming education explanations could be added to visualizations in two ways: 1) using accompanying text or 2) providing coordinated audio explanations.
Little is known about the effectiveness of automatic explanations in educational program visualization. We designed a study in which the order of animations and related explanations was manipulated. Two groups of a total of 18 participants interacted with either animation-first or explanationfirst version of a tool. The results indicate that animationfirst approach is significantly more effective. On the grounds of these findings and students’ input about the explanation generation and layout, we discuss the design implications of the findings.
Categories and Subject Descriptors K.3.2 [Computers and education]: Computer and Information Science Education—computer science education, information systems education
Auditory explanations fit the dual-coding theory better. They complement simultaneously the visual stimulation to create new knowledge, and its effectiveness has been proved. In their experiment, Mayer and Anderson [15] demonstrated how concurrent verbal explanations improved students’ problem solving transfer skills. Students who received the explanations before the animation did significantly worse than those with concurrent audio explanations. These results have been extended in [17], providing arguments for employing multimedia-learning theory principles for learning with dynamic visualizations.
General Terms Human factors, Experimentation, Design
Keywords program animation, learning programming, educational technologies, Jeliot 3
1.
andres.moreno@uef.fi
INTRODUCTION
Program animation, when interaction with it is properly designed, has been shown to be beneficial for learning programming [10]. Others have stressed specifically adequate teacher support [3] as one of the key ingredients for successful learning.
Several automatic animation systems, that is those systems in which the animation is dynamically created from users’ own data set or program source code, offer benefit to students from explanations as they help to build the relationships between the animations and the concept explained. However, program animation systems’ designers have so far preferred to employ textual explanations rather than verbal explanations, and these explanations are often displayed simultaneously.
It has been previously reported that inexpert users of visualizations take longer to understand and make efficient use the visualizations than experts, partly due to the visualizations being designed by the experts themselves and partly because
While it is assumed that students make use of the explanations when interacting with the program animation systems, there are neither studies nor guidelines regarding the temporal arrangement of textual explanations and animations. In this paper thus, we explore the effects of the arrangements on students’ learning of principal Java programming concepts.
Permission to make digital or hard copies of all or part of this work for personal or classroom use is granted without fee provided that copies are not made or distributed for profit or commercial advantage and that copies bear this notice and the full citation on the first page. To copy otherwise, to republish, to post on servers or to redistribute to lists, requires prior specific permission and/or a fee. Koli Calling ‘12, November 15–18, Tahko, Finland Copyright 2012 ACM 978-1-4503-1795-5/12/11 ...$15.00.
100
2. RELATED SYSTEMS AND RESEARCH 2.1 Program visualization and explanations
is the advantage of multimodal representation use, that is of the combination of verbal and visual materials.
Many program visualization tools such as MatrixPro [11], ALVIS LIVE! [9], Jeliot 3 [2] and WinHIPE [21] do not have explanations of the animations. MatrixPro and WinHIPE provide exercises with textual descriptions and explanations about the program or algorithm.
Lawrence [13] carried out an experiment regarding the order of presentation of text and animation in algorithm visualization. The conclusion of Lawrence’s research was that students in text-first condition did not achieve better result than those in animation-first condition. Although no significant difference was observed, text-first approach was seOn the other hand, ViLLE [23], WADEIn II [6], and VARScope [12]lected finally for the reason that the text-first group achieved provide explanations of animations or programs, and these a slightly higher score than the other group. Lawrence explanations are shown during animations. We next present thought that condition of text first rather than animation a short summary of these systems. first was preferred by participants. In Lawrence’s study, XTango [26] was used to animate relevant algorithms and ViLLE [23] and UUhistle [25] are program visualization tools twelve students were separated equally into two groups. An that animate, and let the student simulate in the case of analysis of each group’s post-test score determined if the UUhistle, the execution of a program. They highlight code order of presentation had effects on result. lines, displays the states of variables, and creates frames representing newly executed methods. At the same time, Lawrence’s research is quite similar to ours in a few aspects. in both tools, explanations are automatically generated in a We too put an emphasis on the impact of the arrangement of separate frame at the bottom. A study of Rajala et al. [24] explanations and animations in time and it is also our goal to on effectiveness of ViLLE was carried out, demonstrating improve understanding of certain behaviors of the visualizathat ViLLE is especially useful for inexperienced programtion and thus of certain concepts being visualized. However, mers. Lawrence’s experiment only compared each group’s post-test score, while we here present a pre- post-test design. WADEIn II [6] is a web-based program visualization application. It visualizes the process of expression evaluation in C 3. JELIOT 3 language and it supports twenty-four C operators. WADEIn II displays animations and related explanations close to each We selected Jeliot 3 as a system to test the effectiveness other in the “blackboard” region, and they are presented siof explanations and their temporal arrangement for few reamultaneously. As students’ knowledge increases, the system sons. First, Jeliot 3 is distributed as an open source, it is well evaluates it, parts of explanations are hidden until no more documented1 and its architecture allows for such modificaexplanations are presented, and animations become faster. tions [2]. Second, as we show below, it has been repeatedly shown to be effective in learning programming. Here, it has VARScope [12] is a program visualization system focusing on been modified to automatically display explanations for certhe concept and usage of variable scope in C programming tain concepts during the animation of students’ programs. language. Visualization in VARScope includes highlighted code line, value of the variable, animating the active and 3.1 Previous research on Jeliot effectiveness hidden variables, and the detailed explanations of each code Jeliot 3 employs automatically generated animations that line. Explanations and visualizations are displayed simultadisplay the execution of a Java program. Teachers and stuneously in separate windows. dents can use these animations in a movie like fashion or in a step by step way. Several studies have demonstrated that In summary, to our knowledge ViLLE and UUhistle are the Jeliot 3 has positive impacts on learning programming [3, 7, only general purpose visualization tools that contains auto8]. A study of [3] was carried out to evaluate a predecesmatic explanations during visualization. WADEIn II and sor of Jeliot 3 in a one-year programming course. In that VARScope are more focused on certain programming conexperiment, students were divided into a control group and cepts they explain, but have interesting features like adapanimation group. Between the two groups only the animatation. Automatic explanations in these tools are mostly tion group was treated with Jeliot. Ben-Bassat et al. found presented simultaneously and in different windows than the that there was no statistically significant difference between main representations. pre- and post-test results in the control group, whereas there was statistically significant improvement in the grades of the 2.2 Temporal arrangement of explanations animation group. Furthermore, in the animation group it Few previous studies investigated the arrangement of aniwas demonstrated that mediocre students benefited more mations and explanations in time. In order to evaluate the from long-term use of the tool than either strong or weak effects of verbal and visual representation in time, Mayer [14] students. applied a number of retention and transfer tests. The result was that students who received simultaneous animation and A study of Cisar et al. [7] verifies that Jeliot 3 affects learning narration outperformed those who received successive aniof Java. In that study, results of 20 multiple choice questions mation and narration on problem-solving test. In retention by 400 students were analyzed. It was shown that students test there was no statistical difference between simultaneous who learned with the help of Jeliot 3 outperformed those presentation and successive presentation. In Mayer’s studwho did not use Jeliot 3. Hongwarittorrn and Krairit [8] ies, however, there was little information on the presentation 1 http://cs.uef.fi/jeliot/ of textual narrations and animations. What has been found
101
Table 1: Background of the participants. There was no statistically significant difference between two groups in OOP grades (p = 0.127) and in self-ratings (p = 0.227) according to a t-test. Note: M = male, F = female.
confirms that Jeliot 3 leads to better learning of Java, especially in object-oriented programming (OOP). In that study conducted with 54 participants, those who learned Java with Jeliot achieved better results than those who learned without the tool. However, other research [16] indicates that some students misunderstand the animations in Jeliot 3. In that study, after 10 weeks voluntarily using Jeliot 3 as a programming tool for weekly assignment completion, six maths undergraduate students were interviewed to explore their attitudes towards the tool and to assess their comprehension of animation. Although almost all subjects understood animation referring to basic statements such as variable declaration, some of them failed to describe the animation of an object allocation correctly. The ”this” reference which is used to point to the current object, and argument passing to parameter of the constructor, were found to be the most puzzling.
N
OOP grade
Self-rating
M
F
Anim.-first Explan.-first
10 8
3.44 (0.88) 2.75 (0.89)
3.30 (0.95) 2.75 (0.89)
9 6
1 2
There were altogether three target animations related to three fundamental Java object-oriented concepts: 1. Object initialization and ”this” keyword 2. Reference return and assignment 3. Garbage collection These concepts were chosen as the animations of objectoriented concepts in Jeliot 3 were identified to be the most difficult for students to explain after watching them [16]. As well, the first two concepts have been considered either critical or difficult to learn on a study surveying faculty members [5].
3.2 Objectives and hypotheses In this paper, the aim is to inspect the effect of the sequence of animation and related explanation on learning outcome during programming. In particular, the investigation we present compares the impact in understanding critical Java programming concepts when explanations are either displayed after animations or before animations.
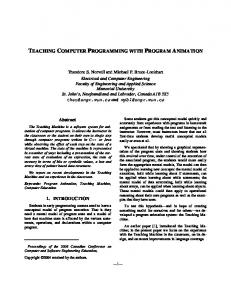
As an example of an animation in Jeliot 3 Figure 1 and Figure 2 show the sequence of animation steps for object initialization and ”this” keyword concepts in animation first and explanation first conditions, respectively.
The null hypothesis we investigate is that there is no difference in the other of animation and related explanation in terms of learning outcome.
4.
Group
METHOD
4.2 Participants
We designed a pre—post-test study in which participants were assigned to one of two conditions: either they are interacting with a modified Jeliot 3 system that presented explanations of key concept before the animation of a concept, or they were using a version of the tool that presented explanations after the concept animation.
There were a total of 18 volunteering participants in this experiment, 15 male and 3 female. The participants were computing postgraduate and Master’s students at one Finnish university. In overall, they had very little or no experience with Jeliot 3. All participants had some knowledge of object oriented programming (OOP) in Java as they recently took a Java class in an undergraduate course. A grade from the OOP was collected as a background measure of OOP understanding along with self-rating of OOP skills, both on the scale from 1 (worst) - 5 (best).
Lawrence’s research method is similar to the one is used in this study. She also focused on the impact of the temporal arrangement of explanations and animations in time. However, Lawrence’s experiment only compared each group’s post-test score, while this study uses a pre- post-test design.
They were divided into two groups: the animation-first group (10 participants) and the explanation-first group (8 participants). Table 1 shows no significant differences between the groups in terms of previous grade in OOP class and selfrating.
4.1 Design and materials The experiment was designed as a between subject study, where the order of the animation and explanation was the primary factor with two levels: one level was explanation first while the other level was animation first.
4.3 Procedure
Both groups had the same short Java program for experiment (see Appendix for listing) and the same test before and after the experiment. The only difference between two groups was the order of explanations and animations. In the animation-first group, the corresponding explanation was presented after each animation and it described what the previous animation represented. In contrast, in the explanationfirst group, related explanation was displayed before each animation and it described what the next animation would represent. The content of the explanations was same for both groups.
102
Participants were given a short introduction to Jeliot 3 by an assistant. The introduction included what each area of the animation frame displays and how to control the process of animation through buttons. After the introduction, participants were required to get familiar with Jeliot 3 by running an object-oriented program. Participants were allowed to ask questions on Jeliot 3. The time reserved for this introduction and practice was 10 minutes. Afterwards, participants completed a test which comprised three questions in 20 minutes. Each question could award
(a) Animation of object initialization starts.
(b) Animation of initialization ends and related explanation appears.
(c) Related explanation disappears.
(d) Animation of “this” keyword starts.
(e) Animation of “this” ends and related explanation appears.
(f) Related explanation disappears.
Figure 1: In animation first condition, animations of object initialization and ”this” keyword are shown before the respective explanation appears.
103
(a) Explanation of object initialization appears.
(b) Explanation disappears and related animation starts.
(c) Related animation ends.
(d) Explanation of ”this” keyword appears.
(e) Explanation disappears and related animation starts.
(f) Related animation ends.
Figure 2: In explanation first condition, animations of object initialization and ”this” keyword are shown only after the respective explanation.
104
Table 4: Correlations of pre- and post-test scores with OOP understanding for all study participants, a 2-tailed p-value in parenthesis; * denotes p