Proceedings of the World Congress on Engineering 2012 Vol II WCE 2012, July 4 - 6, 2012, London, U.K.
DVO:Model for Make a Handler for a Tiled Display Laura Ram´ırez, Member, CINVESTAV, Sergio Chapa, Senior Member, CINVESTAV, and Amilcar Meneses, Senior Member, CINVESTAV
Abstract—The DVO is a model, for the success of developing software for a tiled display, software development model plays a crucial role in order to complete the task of developing software, distribution of display and to get high quality visualization software. We can derive from this model object-oriented a middleware to provide flexible and transparent management for the tiled display. The DVO allows object visual based application to utilize massively scalable visualization clusters such as highresolution tiled display environments. Index Terms—tiled display, distributed object, visual object, middleware.
I
I. I NTRODUCTION
N order to get a success graphic representation, the scientific visualization has been researched from a different perspective. These are some: • Goddard space flight center, Scientific Visualization Studio • The Advanced Computing Center for the Arts and Design, Scientific Visualization • NC State University College of Education Graphic Communications Program NC State Department of Public Instruction, Scientific Visualization • ITL MCSD Scientific Applications and Visualization Group, Scientific Visualization • Institute for Astro and Particle Physics, University of Innsbruck, Technikerstrasse, Austria., Visualization needs and techniques for astrophysical simulations • Consorzio id 40 Universit´ a italiane, Centro di supercalcolo Numerical simulations have evolved continuously towards being an important field in astrophysics, equivalent to theory and observation. Due to the enormous developments in computer sciences, both hardware- and software-architecture, state-of-the-art simulations produce huge amounts of raw data with increasing complexity. Scientific visualization of data can provide understanding of the phenomenon or data that are beginning to be studied. Once the computer simulation and analysis has been performed, the result should be interpreted by the researcher. Find the numerical results provides an overview, but exaggerated the amount they can make this task impractical. An alternative is to convert the numbers into images and animations, as for humans is easier to understand information that way. For example, a researcher who used finite difference methods on a supercomputer for the Thermal Convection Manuscript received December 30, 2010; revised January 22, 2011. This work was supported in part by the Department of Computer Science, Cinvestav. Laura Ram´ırez is with the Department of Computer Science, Cinvestav, DF, 07360 Mex. e-mail: (
[email protected]).
ISBN: 978-988-19252-1-3 ISSN: 2078-0958 (Print); ISSN: 2078-0966 (Online)
in the Earth’s tablecloth, uses a computer graphic on a workstation, to display the result of temperatures consistently in the millions or billions of values. By an application on a workstation, each data can be represented as a grid of pixels, where each pixel can represent a specific color temperature. Since it is clear the importance of scientific visualization in the development of various areas of research, it is worth noting that one of the best scientific visualization tools with which account is the tiled display. Below are appointed some existing applications on tiled displays. The tiled display is a technology that begins to expand its use. This is the reason that we need search how can do better its handler. There exists many research that propose solutions, using a visualization cluster. In this case we propose a new model that help in the handler of the visualization cluster, using the concept of a distributed object, and adding the visual object concept. For this we need make a state diagram, and a characterization of the handler system, for searching a basic structure of the manipulation. The paper introduces a model of distributed object visual, for implementing a cluster graphics library for large-scale, through a middleware aimed at providing a simple and intuitive layer to develop visual applications over a tiled display. DVO provides built-in system characteristics and features such as: • An easy-to-use grid configuration tool • Scalability • Event handling • Flexible coordinate system • Integrated display to screen • Remote interaction • Distribution transparency A. Background and Related Work The design and development of software solution for clusters-based, multiscreen rendering such as described in [4] [6] [5] have not yet produced a standard solution. Despite all of these efforts, the most common approach to visualizing OpenGL content on multiple displays is to use Distributed Multihead X (DMX) [2] or Chromium (the successor of WireGL [3]). Users often rely on these two approaches because they offer an easy way to generate a visual on a tiled display system. Only later, when high-performance applications are to be executed and the performance deficit becomes an issue, are other solutions explored. Users often rely on these two approaches because they offer an easy way to generate a visual on a tiled display system. Only later, when high-performance applications are to be executed and the performance deficit becomes an issue, are other solutions explored.
WCE 2012
Proceedings of the World Congress on Engineering 2012 Vol II WCE 2012, July 4 - 6, 2012, London, U.K. DMX operates on the assumption that a single front-end X server will act as a proxy to a set of back-end X servers. Rendering requests will be accepted by the front-end server, broken down as needed and sent to the appropriate back-end server(s) via X11 library calls for actual rendering. This architecture requires that the front-end server manages/ renders the visual content of all nodes in a visualization grid. DMX is therefore limited to a small display array and not scalable without performance penalties. DMX is also unable to take advantage of the hardware acceleration on the rendering nodes, which makes this solution impractical for a high-performance rendering system. Chromium is an implementation of OpenGL for parallel and cluster rendering, it can take advantage of hardware acceleration in the nodes. Chromiums main advantage is that it can run unchanged OpenGL applications on tiled display systems. However, Chromium does come with limitations. It uses a tile sorting process to determine which node in the cluster needs to draw a particular part of the OpenGL content, resulting in OpenGL command streams sent to each rendering mode. Stream Processing Units (SPUs) on the rendering nodes pass these commands directly to the local graphics hardware. Fast and substantial visual content changes as required in dynamic visual simulations can force Chromium to exchange massive data sets through the network at runtime, resulting in performance penalties and a non interactive system response. The Scalable Adaptive Graphics Environment (SAGE)[8] operates on the assumption that any type of application will send a pixel stream to the SAGE server, which in turn manages the tiles and distributes the incoming pixels to the correct portion of a tiled wall. This concept has the advantage that any application can be displayed on tiled display systems as long as application programmers can derive a pixel-stream from their application and enough network bandwidth is available. SAGE takes exclusive control of the distributed frame buffer. Thus, to display a high-resolution visual, another application needs to be running on the same cluster, rendering its content in an off-screen buffer, which then can be read back and mapped to a SAGE client. Since read-back operations are expensive, the achievable performance of this approach is limited. The use of another visualization cluster to generate the high-resolution context is not an alternative because of the massive amount of data that would need to be controlled and streamed. Middleware approaches such as Chromium and SAGE rely on high-bandwidth, low-latency, and ideally jitter- free networks deliver data created by a render node, to a display node that only requires very limited graphics capabilities. The downside is that, although current networks can theoretically provide throughputs up to 10 Gbits/s, this level of throughput can usually only be maintained when dedicated, high-performance local net- works or high speed network grids such as the OptIPuter [1] are combined with local interconnects such as Myrinet (Myri-10G), Scalable Coherent Interface (SCI), or Infiniband. Unfortunately, when budgeting a cluster, the wide price difference between high-performance and commodity interconnects favors in most cases a commodity interconnect
ISBN: 978-988-19252-1-3 ISSN: 2078-0958 (Print); ISSN: 2078-0966 (Online)
with reasonable performance such as Gigabit Ethernet. This reduces the achievable performance with both Chromium and SAGE dramatically. CGLX has an intuitive cluster configuration system, giving even novice users full control over the display configuration. Hardware-accelerated rendering is natively supported on different operating systems (Linux and Mac OSX) in both homogeneous and heterogeneous cluster configurations and is optimized for pixel throughput. 1) A Distributed Object Visual Prototypes: These are some applications on the tiled display. • Image viewing application based on the ImageMagick toolkit. Loads most of the commonly used image formats (jpg, png, gif, tiff...). Images are automatically converted to DXT format for streaming. A DXT copy is saved locally for later use. Use the show original option to stream uncompressed data. • VLC media player is a highly portable multimedia player for various audio and video formats (MPEG1, MPEG-2, MPEG-4, DivX, mp3, ogg, ...) As well as DVDs, VCDs, and various streaming protocols. It can also be used as a server to stream in unicast or multicast in IPv4 or IPv6 on a high-bandwidth network. An output plugin for SAGE[8] was written to provide video streaming. Audio is not streamed, just played locally. Just add ’–vout sage’ option to use the plugin. • MPlayer is a movie player which runs on many systems. It plays most MPEG/VOB, AVI, Ogg/OGM, VIVO, ASF/WMA/WMV, QT/MOV/MP4, RealMedia, Matroska, NUT, NuppelVideo, FLI, YUV4MPEG, FILM, RoQ, PVA files, supported by many native, XAnim, and Win32 DLL codecs. You can watch VideoCD, SVCD, DVD, 3ivx, DivX 3/4/5, WMV and even H.264 movies. An output plugin for SAGE was written to provide video streaming. Audio is not streamed, just played locally. Just add the ’-vo sage’ option to use the plugin. • MacOS X libsail based video streamer, provided by Douglas Kosovic, University of Queensland, Australia. Originally developed for the Blackmagic Intensity HDMI capture card, but should work with any other Quicktime Sequence Grabber video capture device. • Software to stream high-definition video and audio, using the SAGE environment. It streams 1080i HD (1920x1080) using RGB16, RGB24, or YUV422 8bit pixel formats. For the video, it requires 995Mbps at 30 frames per second, 830Mbps at 25fps, or 665Mbps at 20fps. There is NO data compression in this release. Audio is streamed uncompressed, 16bit at 44.1Khz stereo. We use a HDMI capture card from Blackmagic (Intensity model) on Micorsoft Windows. A Windows installer is provided in the SAGE distribution. • JuxtaView is a cluster-based application for viewing ultra-high-resolution images on scalable tiled displays. Through SAGE, JuxtaView enables a user to interactively roam across potentially terabytes of distributed, spatially referenced image data sets, such as those generated from electron microscopes, satellites, and aerial photography. Using large amounts of bandwidth, SAGE enables the domain scientist to bridge distributed resources, including storage, rendering, and display clusters. • VRA provides a volume visualization solution that
WCE 2012
Proceedings of the World Congress on Engineering 2012 Vol II WCE 2012, July 4 - 6, 2012, London, U.K.
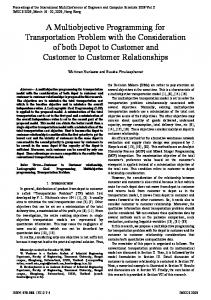
Fig. 1.
Display images
allows scientists to render very large volumetric datasets on scalable high-resolution displays. It uses a methodology that employs a multi-resolution octree, an imageorder data distribution method, a distributed sharedmemory data management system, a multi-level cache, and hardware accelerated rendering techniques to produce a solution that is scalable in terms of input data size and output resolution. • UltraGrid from Laboratory of Advanced Networking Technologies (ANTLab) is a software for real-time transmissions of high-defintion video. It is a fork of the original UltraGrid developed by Colin Perkins, Ladan Gharai, et al.. Our work is supported by CESNET research intent ”Optical Network of National Research and Its New Applications” (MSM 6383917201) and partially also by Masaryk University research intent ”Parallel and Distributed Systems” (MSM 0021622419). A SAGE output module (using DXT compression) was added by the CESNET group. • Scalable Visualization Consumer (SVC) receives MPEG2 datathrough IEEE1394, files on disk or network interface anddecompresses it for streaming to a tiled display using SAGE. Tobe shown on a tiled display, MPEG2 data has to be decompressed, split as sub-images and streamed to the appropriate display nodes.The reason for decompression is that compressed data cannot be split up easily for streaming to separate nodes. We used this software foriGrid2005 demonstration to stream HD video captured by an IEEE1394 HD Sony camera. It shows a 30fps frame rate and uses 650Mbps ofnetwork bandwidth[10]. We made 3 prototypes that includes the features to get a generalization of theses applications. • The first is Display image, shown an image over a tiled display and open a new image like a presentation is a very common particular application, as shown in Figure 1. • The navigation image, lets the user, get a little part of the big image, and it will move to the complete image, as shown in Figure 2. • An application that shown the use of this model is the Multiformat display, we can show 4 types of visual objects like video, static images, a model with Open GL and a browser. The advantage of the model is that we can move any object without to know what type is it, as shown in Figure 3. These are the biggest display that there tiles today. • HiperSpace: 286, 720, 000 pixeles, Calit2 UC San Diego • Hyperwall-2 256,000,000 pixeles, NASA Ames
ISBN: 978-988-19252-1-3 ISSN: 2078-0958 (Print); ISSN: 2078-0966 (Online)
Fig. 2.
Navigation image
Fig. 3.
Multiformat display
HyperWall: 204,800,000 pixeles, Calit2 UC Irvine Varrier: 124,800,000 pixeles, Calit2 UC San Diego • LambdaVision: 105,600,000 pixeles, UIC Electronic Viz Lab • OzIPortal: 81,920,000 pixeles, University of Melbourne The tiled display which is our laboratory has Cinveswall: 27,648, 000 pixels, Cinvestav, Mex. 2) Tileds Managers Display: Majority of the current tiled display systems are driven by a cluster of computers. In a typical tiled display architecture, a set of display nodes (computers) drive individual tiles of the display[9]. HIPerSpace used for operating a middleware called CGLX, and your OS is Rocks / Linux. CGLX (Cross-Platform Cluster Graphic Library ) is a flexible, transparent OpenGL-based graphics framework for distributed high performance visualization =systems in a master-slave setup. The framework was developed to enable OpenGL programs to be executed on visualization clusters such as a high resolution tiled display system and to maximize the achievable performance and resolution for OpenGL-based applications on such systems. To overcome performance and configuration related challenges in networked display environments, CGLX launches and manages instances of an application on all rendering nodes through a light-weight thread-based network communication layer. A GLUT-like (Open GL Utility Toolkit) interface is presented to the user, which allows this framework to intercept and interpret OpenGL calls and to provide a distributed large scale OpenGL context on a tiled display. CGLX provides distributed parallelized rendering of OpenGL applications with all OpenGL extensions that are supported through the graphics hardware[7]. The DVO model takes the advantage of the a view of a window to show the Open GL context and get to the distributed object the advantage to the distribution large scale, and furthermore allows the use of the other visualizations. • •
B. Characterization of a Instance System A cluster with high end graphics is considered a single giant graphics card, and a cluster with parallel file storage
WCE 2012
Proceedings of the World Congress on Engineering 2012 Vol II WCE 2012, July 4 - 6, 2012, London, U.K. is considered like a single giant disk drive, the challenge is to build software and hardware architecture to realize the high level model and measure the benefits over a traditional cluster computing model. But in this case we want to get a good performance in the display of visualizations. Some applications need more computing power than a only computer can provide. An alternative solution is connect multiple processors together and coordinate their computational efforts. The results are parallel systems like a cluster, a cluster consists of a collection of computers interconnected in a web working for to do a same task. Now the cluster management toolkit provides an alternative to using specialized. There exists a Toolkit called Rocks, Rocks makes a complete cluster installation on nodes. Has a collection of packages and their configuration details, allows end-users to add their own software. Viz Roll is a Rocks appliance used to build tiled display visualization clusters. Visualization clusters are built to create larger displays (thousand by thousand of pixels)[11]. Taking the reference that the visualization cluster is a good form of to do the handler of the tiled display, we can begin to think, how we can get advantages of the a model, for use the visualization cluster. We propose a model of distributed visual object for make it. We can show the features that this object has to have, but for to do it we have to make a characterization of an instance system. We have 13 process, 12 nodes and a server that has 8 states and needs 7 events. • g0 State System start. • geo State Expected object. • gc State Consumer. • gd State Display object. • gr State Receive position. • gb State Search object. • gm State Change position. • gec State Wait for new position • gc State Consumer. • e0 Event start • e1 Event open • e2 Event deploy • e3 Event receive • e4 Event wait • e5 Event move • e6 Event search A standar application over a tiled display has a form that we can model in a state diagram, first , we have to make a structure the occurrence of events. Starting from the initial system, we need an event for change to the next state and expect an object, the next event lets the consumer get the object, and display it. The next state receive a new position when the objects are moving, and the last state is a cycle for wait a new position. The first event is start event, the next is open event, and deploy event. When the object is displayed we can wait for get other object, or move this object, as shown in Figure 4. This object open, deploy and move is a distributed visual object, and is for this reason that we need an initial definition for this. 1) A Definition of Visual Object : First, we need understand what is a visual object, and how is its behavior, when we want display an image into a screen, we encapsulates
ISBN: 978-988-19252-1-3 ISSN: 2078-0958 (Print); ISSN: 2078-0966 (Online)
Fig. 4.
Model of application over a tiled display
the main features of this object and the use methods for to make the deploy into the screen, in this case is important the handler events that lets the deploy and the control for the things that the image need, like a resize, a new position over the screen. Now if we want an object like a video, the object need too be display into the screen, but also we need these tasks as play, stop or pause the video, and for this reason we need the events that allows the control for these tasks. In the case of a model with OpenGL, the manager allows many tasks as transformations, or begin an animation, and these are the events that the visual object has to do. A transform is a mathematical construct used to manipulate coordinates in two-dimensional space. Transforms are used extensively in graphics-based computing to simplify the drawing process. Coordinate values are multiplied through the transform’s mathematical matrix to obtain a modified coordinate that reflects the transform’s properties. We can apply the following effects to the current coordinate system: • Translation • Scaling • Rotation We can combine the preceding effects in different combinations to achieve interesting results. During drawing, we can applies the effects to the content of draw, imparting those characteristics on the shapes and images. Because all coordinates are multiplied through a transform at some point during rendering, the addition of these effects has little effect on performance. In fact, manipulating your shapes using transforms is often faster than manipulating your source data directly. Other case is shown in the prototype multidisplay format when the web browser was enable, the features were so much because this visual object has many components and requires many features for the display. When we understand the visual object, we can make a characterization for the main features of this objects. • This object needs an initial data for their creation. • This object needs allow the handler event to visual manager. A visual manager will be who lets a hierarchy of events, and allows the control of the handling event for all objects display into the screen. The visual object is a container that has a support that provides performance for the data visualization into the screen. For this reason we need get the control of the window manager of the operating system.
WCE 2012
Proceedings of the World Congress on Engineering 2012 Vol II WCE 2012, July 4 - 6, 2012, London, U.K. The visual object results like a tiled window, and the windows always display in a single rectangular area. If placing or enlarging the windows would cause other windows to be overlapped. The tiled windows manager supports an arbitrary layout of tiled windows. Windows may be placed anywhere, they do not necessarily line up in columns. Windows need not fill the screen ( blank space may be visible if it is not needed by the windows on the screen). The visual manager may also grow a window to its desired size when that window becomes the listener (that is, after a user has pressed a mouse button or typed a key with the mouse cursor in the window). This closely corresponds to overlapping window managers that expose an obscured window when it becomes the listener. Even when this option is selected, the user may want to bypass it. For example, imagine that a user is watching a video in one window (the listener) and an animation of an Open GL model has just finished in another window. The user may temporarily want to play the video into the other window to start the animation another. However, there is almost certainly no reason to enlarge ( or in an overlapping system, expose ) that other window just to play the video. In our tiled windows manager, when the user moves the cursor to the header of the other window and play the video, the input is directed to that window; however, the window is not enlarged, nor is the old listener shrunk. Now other main feature of a visual object is the drawing, drawing is only one step in the process of creating a fully functional view. Understanding view hierarchies and how events interact with views are two other critical steps. Drawing is a fundamental part of most applications. The drawing environment encompasses the digital canvas and graphics settings that determine the final look of your content. The canvas determines where your content is drawn, while the graphics settings control every aspect of drawing, including the size, color, quality, and orientation of your content. Nearly all drawing is done inside views. Views are objects that represent a visual portion of a window. Each view object is responsible for displaying some visual content and responding to user events in its visible area. A view may also be responsible for one or more subviews. A graphic context encapsulates all of the information needed to draw to an underlying canvas, including the current drawing attributes and a device-specific representation of the digital paint on the canvas. The graphics contexts are used to represent the following drawing destinations: • Windows (and their views) • Images (including bitmaps of all kinds) • OpenGL surfaces By far, the most common drawing destination is a window, and by extension its views. We use a Cartesian coordinate system as its basic model for specifying coordinates. The origin of this system is located in the lower-left corner of the current drawing space, with positive values extending the axes up and to the right of the origin point. The root origin for the entire system is located at the lower-left corner of the screen. 2) A Definition of Distributed Object : Distributed object models form the basis for distributed applications. Several
ISBN: 978-988-19252-1-3 ISSN: 2078-0958 (Print); ISSN: 2078-0966 (Online)
aspects are important in order to make the right choice concerning which distributed object model to use. Traditionally one of the most important criteria is performance. A distributed system has a complex structure, requires a particular organization for their good performance. We can make a division between the logic organization and physic organization. The main feature of the distributed objects is the separation between the interface and the implementation. When the interface and the implementations of the objects are located in different places, this object is called distributed object. There exists many models for made the distribution of the objects, we will use the fragmented objects and now show a review of this. As is common in object-oriented approach, a fragmented object can be viewed at two different levels of abstraction, corresponding respectively to a client’s (abstract) view, and to designer’s (concrete) view. A fragmented object is a single shared object. It is shared by several clients objects, localized in different address spaces, possibly on several sites. It is accessed via a stronglytyped interface. A fragmented object can offer distinct interfaces to different clients. Concretely (for the designer), a fragmented object encapsulates a set of cooperating fragments. Each fragmented is an elementary object. We distinguish three fragment interfaces: the private interface, the public interface, and the group interface. The private interface of a fragment is composed of internal methods, accessible only from within the fragment. The public interface contains methods accessible by clients. The abstract interface of a fragmented objects is provided to some clients via the public interface of a local fragment, that can be invoked locally. A client sees no difference between a fragment implementing the interface exported by the fragmented object to this client, and the fragmented objects itself. The public interface of the fragment offers the transparency of the distribution to a client. A method of the public interface can be entirely implemented by the fragment itself, or it can trigger invocations to other fragments. The group interface comprises those methods which are internal to the fragmented objects as a whole. The group interface concept extends type-checking to remote communications. The fragments cooperate using connective objects. A connective object is just another fragment object on a lower level of abstraction. The most primitive connective objects are the communication objects implemented by the system ( for instance, communication protocols). The main benefits of the fragment object approach are: •
• • • •
Separation of interface from implementation. Since, a fragment object is a distributed object, it is easy to switch between different policies for the same mechanism. Strongly type-checked remote communications. Reusability of programmer-defined distributed shared objects. Support for different levels of transparency. High-level communication abstractions.
WCE 2012
Proceedings of the World Congress on Engineering 2012 Vol II WCE 2012, July 4 - 6, 2012, London, U.K. •
Support for concept of layered protocols. Marshalling/unmarchalling conversions between these multiple layers are handled automatically and in a type-safe manner.
C. A Definition of Distributed Visual Object We can define the distributed visual object , with the things that it has to do, and the features that it has to have. This object provides a structure for drawing and handling events. This object provides too an interprocess messaging. This object claims a rectangular region, is responsible for all drawing within that region, and is eligible to receive mouse events occurring in it as well. Among the main characteristics of such objects are the even handling, because will allow users communication with the system. The flexible coordinate system lets an use more natural to the user, like work in the cartesian plane the positive side. When talk about the integrated display to screen, we mean to allow the use of the windows manager of the operating system to obtain complete control of the deployment. The remote interaction is important because means how will be the communication between the remote objects. The main difficulty in developing the distribution transparency is get a good unit to the distribution in order to get less delay in the deploy of the display, thus hiding the end user distribution. 1) Architecture of the System: We made many tests and for this we used the next hardware: • 12 Mac mini ( the nodes ). With the next features: – 2.0GHz :120GB – Intel Core 2 duo 2 – 1GB memory – 120 GB hard drive1 – NVIDIA GeForce 9400M graphics • 12 Apple LED Cinema Display ( flat panel) – Screen size: 24 inches ( diagonal viewable) – Screen type: TFT active-matrix LCD – Resolution: 1920 by 1200 pixels – Colors: 16.7 million – Viewing angle: 178 horizontal y vertical • Mac Pro (visualization server) – 2.66GHz Quad-Core Intel Xeon – 3GB (3x1GB) – 640GB 7200-rpm Serial ATA 3 Gb/s – NVIDIA GeForce GT 120 512MB – One 18x SuperDrive – Apple Mighty Mouse • Switch – 24 ports – 1 G 10/100/1000MBPS D. Model Distributed Visual Object The concepts of an object model ideally reflect the characteristics of distributed systems, We can use the objectoriented model to encapsulate behaviors that help us monitor displays, regardless of type.
ISBN: 978-988-19252-1-3 ISSN: 2078-0958 (Print); ISSN: 2078-0966 (Online)
An object encapsulates the state and behavior and can only be accessed via a well defined interface. The interface hides the details that are specific to the implementation, thereby helping to encapsulate different technologies. An object therefore becomes a unit of distribution. [12] Using this object features for get an unit for making the display, we can have many advantages for the handling event. Taking into account the characteristics of visual objects and distributed objects, we can start thinking in a distributed visual object that you can use the features of distributed objects for the deployment of a display on different machines, ie tiled display. Finding the correct shipping data with the least possible delay in transmission time. With respect to existing models of distributed objects can look fragmented distribution of the object that allows the parallel deployment of all components, you must also find the best way to manage events, for this is to generate a handler views to determine which events should take priority, that based on the need for some immediate reaction visual objects. Views handler will be responsible for maintaining control over the video wall, and the manager to manipulate the flow of information between nodes and the server. The visuals have priority of control regarding the type of request originated, the changes in position on the tiled display are lower level and do not require visualization handler address. II. C ONCLUSION This paper introduces a transparent, efficient, and effective model for the development of massively scalable multitile visualization environments. The DVO model presents an API to help the user to realization of their particular applications over a tiled display, is an API for visualization clusters and combines this feature with tools that allow users and researchers from different scientific backgrounds to build, configure, and utilize high-performance, multitile visualization environments. This API is tailored to support the development of programs and applications that generate visual analytics infrastructures. R EFERENCES [1] Jason Leigh, Luc Renambot, Thomas A. DeFanti, Maxine Brown, Eric He, Naveen Krishnaprasad, Javid M Alimohideen Meerasa, Atul Nayak, Kyoung Park, Rajvikram Singh, Shalini Venkataraman, Chong (Charles) Zhang, Experimental OptIPuter Architecture for Data-Intensive Collaborative Visualization, the 3rd Workshop on Advanced Collaborative Environments (in conjunction with the High Performance Distributed Computing Conference), Seattle, Washington, June 22, 2003. [2] This is the page for Distributed Multihead X Project, at this URL we can find a short description for it. An introduction, motivation, and documentation. http://dmx.sourceforge.net/ [3] Greg Humphreys, Matthew Eldridge, Ian Buck, Stanford University, Gordon Stoll, Matthew Everett, Pat Hanrahan, Intel Corporation, WireGL: A Scalable Graphics System for Clusters. [4] G. Humphreys, M. Houston, Y. Ng, R. Frank, S. Ahern, P. Kirchner, and J. Klosowski, Chromium: A Stream Processing Framework for Interactive Rendering on Clusters, Proc. ACM SIGGRAPH, vol. 21, no. 3, 2002. [5] H. Chen, Y. Chen, A. Finkelstein, T. Funkhouser, K. Li, Z. Liu, R. Samanta, and G. Wallace, Data Distribution Strategies for HighResolution Displays, Computers and Graphics, vol. 25, pp. 811-818, 2001.
WCE 2012
Proceedings of the World Congress on Engineering 2012 Vol II WCE 2012, July 4 - 6, 2012, London, U.K. [6] G. Vo, J. Behr, D. Reiners, and M. Roth, A Multi-Thread Safe Foundation for Scene Graphs and Its Extension to Clusters, Proc. Fourth Eurographics Workshop Parallel Graphics and Visualization (EGPGV 02), pp. 33-37, 2002. [7] Doerr KU, Kuester F.,CGLX: A Scalable, High-Performance Visualization Framework for Networked Display Environments, IEEE Transaction on visualization and computer graphics, vol. 17, No. X, XXX 2011. [8] Jeong, B., Renambot, L., Jagodic, R., Singh, R., Aguilera, J., Johnson, A., Leigh, J., High-Performance Dynamic Graphics Streaming for Scalable Adaptive Graphics Environment, Proc. Supercomputing, 2006 [9] Sachin Deshpande,Chang Yuan, Scott Daly, Ibrahim Sezan, A Large Ultra High Resolution Tiled Display System: Architecture, Technologies, Applications, and Tools, Sharp Laboratories of America, Camas, WA 98607, USA. [10] This page compiles a list of applications contributed by the community of SAGE users. The page contains applications that have been enhanced to work with SAGE and compiles information on any non-SAGE applications that can work with SAGE through one or more of SAGE’s utilities. http://www.evl.uic.edu/cavern/sage/applications.php [11] Shenni Li, Building a high-resolution scalable visualization wall, Thesis Master of science, Auburn, Alabama, December 15, 2006. Introduction, pages: 13-16. [12] Arno Puder, Kay Romer, Frank Pilhofer, Distributed Systems Architecture, a middleware approach, Chapter 2, pages:16-23.
ISBN: 978-988-19252-1-3 ISSN: 2078-0958 (Print); ISSN: 2078-0966 (Online)
WCE 2012