Bert Bredeweg, Jochem Liem, Wouter Beek, Floris Linnebank, Jorge Gracia,. Esther Lozano ...... K. Tobin, D. Baker, B. Bell, R. Duit, M. Espinet, B. Fraser, O.
Articles
DynaLearn — An Intelligent Learning Environment for Learning Conceptual Knowledge Bert Bredeweg, Jochem Liem, Wouter Beek, Floris Linnebank, Jorge Gracia, Esther Lozano, Michael Wißner, René Bühling, Paulo Salles, Richard Noble, Andreas Zitek, Petya Borisova, David Mioduser
I Articulating thought in computerbased media is a powerful means for humans to develop their understanding of phenomena. We have created DynaLearn, an intelligent learning environment that allows learners to acquire conceptual knowledge by constructing and simulating qualitative models of how systems behave. DynaLearn uses diagrammatic representations for learners to express their ideas. The environment is equipped with semantic technology components that are capable of generating knowledge-based feedback and virtual characters that enhance the interaction with learners. Teachers have created course material, and successful evaluation studies have been performed. This article presents an overview of the DynaLearn system.
46
AI MAGAZINE
M
odeling is regarded as fundamental to human cognition and scientific inquiry (Schwarz and White 2005). It helps learners express and externalize their thinking, visualize and test components of their theories, and make materials more interesting. Particularly, the importance of learners constructing conceptual interpretations of system behavior has been pointed out many times (Mettes and Roossink [1981], Elio and Sharf [1990], Ploetzner and Spada [1998], Frederiksen and White [2002]). Modeling environments can thus make a significant contribution to the improvement of science education. A new class of knowledge construction tools is emerging that uses logic-based (symbolic, nonnumeric) representations for expressing conceptual systems knowledge (Forbus et al. 2005, Leelawong and Biswas 2008, Bredeweg et al. 2009). Different from the numeric-based tools (Richmond and Peterson 1992, Pratap 2009), these tools employ a qualitative vocabulary (Forbus 2008) for users to construct their explanation of phenomena, notably about systems and how they behave. The use of graphical interfaces has improved usability (Bouwer and Bredeweg 2010), and the tools are becoming more common in education (Forbus et al. 2004, Kinnebrew and Biswas 2011), and professional practice (Bredeweg and Salles 2009). The DynaLearn interactive learning environment (ILE) can be regarded as a member of this new class of tools. Its development is directly motivated by specific needs from the edu-
Copyright © 2013, Association for the Advancement of Artificial Intelligence. All rights reserved. ISSN 0738-4602
Articles
React to the individual knowledge needs of learners
Accommodate the true nature of conceptual knowledge
DynaLearn
Workspace for interactive knowledge construction
Learners
Reflective interaction with virtual characters
Feedback generators: - Semantic technology - Model diagnosis
Be engaging by using personified agent technology
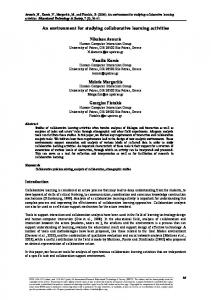
Figure 1. DynaLearn Software Components. The DynaLearn software has three main components: a workspace for creating conceptual knowledge, feedback generators, and virtual characters for reflective interaction. The arrowheads highlight the main flow of information, illustrating the central role of the workspace.
cational field (Osborne, Simon, and Collins [2003]), which gives DynaLearn its three strategic characteristics (figure 1). First, the workspaces for knowledge construction support learners in expressing and simulating conceptual knowledge in a way that closely matches the true nature of this expertise. Moreover, the representations are organized in a sequence of increasing complexity, which acts as a scaffold for learners to develop their proficiency. Second, learners are given control over their learning activities, providing them with personal autonomy, while the software coaches them individually based on their current progress and learning goals. Third, the ILE is made extra engaging and motivating by using personified agent technology (André 2008) in the interaction with learners. This article presents the DynaLearn ILE. The notion of conceptual knowledge and modeling is discussed using the idea of learning spaces, a set of workspaces that supports learners in gradually establishing their ability to create, and learn from creating, conceptual models. This is followed by a number of sections describing the support options available in DynaLearn. We then briefly discuss the design of the virtual characters, the repository of community models, and the evaluation studies. The discussion and conclusion end the article.
Conceptual Models Conceptual models can be defined as models that improve our understanding of systems and their behavior (compare with Grimm [1994], Mylopoulos [1992], Haefner [2005]). They can be used as a premathematical modeling step or as stand-alone tools for knowledge capture. Conceptual models come in a wide range of varieties, including word models, pictures, diagrams, matrices, and certain mathematical models. In fact, any representation can be used to express a modeler’s beliefs. According to Grimm (1994), conceptual models are useful because they provide a conceptual framework for the modeling effort. They also aid in proposing hypotheses and sacrifice details of the system while emphasizing the general characteristics. And, maybe most importantly, they can show the consequences of what we believe to be true, particularly when these representations have a formal status and can be simulated using computer processing. The formalisms developed in the field of qualitative reasoning (QR) (Forbus [2008]) can be considered natural candidates to form the basis for conceptual modeling tools, particularly as knowledge construction tools for learners (Bredeweg and Forbus 2004). Being articulate modeling languages, such formalisms allow for the development of explanatory
WINTER 2013 47
Articles
1
5
Concept Node Arc
Conditional knowledge If .. THEN ..
Structure / Behavior Entity / Quantity Causal change Pos /Neg
2
Causal differentiation Influence (rate) Proportionality (st var) Exogenous
4 6 System independency Scenario Knowledge fragments
3 Landmark Quantity space State graph
Figure 2. Schematic Overview of the Learning Spaces in the DynaLearn ILE. The LSs can be traversed in the indicated order, but alternative routes are also possible. Moreover, each LS can be regarded as a workspace by itself and used as a stand-alone instrument for acquiring a specific kind of conceptual knowledge.
models, that is, models that capture explanations of how systems behave and why (Forbus and Falkenhainer 1990). Explanatory models are considered important instruments for learners to engage with and learn from (Bredeweg and Winkels 1998). Moreover, QR modeling encourages reflection, which is an important aspect of learning (Eurydice 2006, Hucke and Fischer 2003, Niedderer et. al. 2003). The developed models can be simulated, so that modelers can reflect on the implications of the knowledge they articulated. Both conceptual modeling and reflection are important when taking a constructive approach to learning. Key ideas characterizing conceptual models based on QR are briefly presented below. In QR-based conceptual models, the quantities that describe the dynamic features of a system hold qualitative information concerning the current value and direction of change, using an interval scale, consisting of an ordered set of labels (without any numerical information), for example, {Zero, Small, Medium, Large}. Landmarks are specific point values within this set that refer to situations in which the behavior of the system changes significantly. For instance, a substance reaching its boiling temperature will stop getting hotter and start boiling. The simulation results represent the system behavior and how it evolves over time. Time is captured as a graph of states (including loops) in which each state reflects a qualitatively distinct behavior. To represent qualitatively distinct behavior, each state has 48
AI MAGAZINE
a unique set of constrains on quantity values (pairs of , current value and its change, respectively) such as magnitude X = 0, magnitude in/equality X = Y, derivative ∂X = 0, and derivative in/equality ∂X = ∂Y. Transitions from a state to its successor(s) reflect changes in such sets, for example, X = 0 → X > 0, X = Y → X > Y, ∂X = 0 → ∂X > 0, and ∂X = ∂Y → ∂X > ∂Y (and also for second- and third-order derivatives). Theory development on QR has resulted in a set of dependencies that capture cause-effect relationships between quantities (Forbus 2008). These dependencies are defined such that on the one hand they represent conceptual notions that closely match human reasoning (de Koning 1997), while on the other hand they are grounded in mathematical formalisms allowing automated computation (Kuipers 1994). Two examples of such dependencies are influences (initial changes caused by processes) and proportionalities (propagation of changes) (Forbus 1984). Meanwhile, QR has developed into an area of artificial intelligence with advanced knowledge representation and automated reasoning. State of the art QR is comprehensive and intricate, which complicates its immediate use by learners (Bredeweg et al. 2007). Below we discuss the idea of the learning spaces, as developed within the DynaLearn project, to accommodate this problem, and leverage the potential of QR as an instrument for having learners acquire conceptual models of systems.
Articles
Biomass
Live in Habitat
Has Feed on
Benefit from
Target population
Has
Predator Producer
Resources
Has
Has
Has Size
Figure 3. A Concept Map Created with LS1 in DynaLearn. The map concerns a small food web in which a target population benefits from a producer that lives in a habitat, and a predator that feeds on it.
Learning Spaces in DynaLearn A progressive sequence of representations with increasing complexity has been developed, referred to as the learning spaces (LSs), which acts as a scaffold to support learners in developing their ability to create knowledge models and understand systems. One of the key aspects guiding the design is the ability for each representation to highlight qualitatively unique and relevant aspects of system behavior. Six LSs have been established (figure 2) (Bredeweg et al. 2010; Liem, Beek, and Bredeweg 2010). A summary of the main ideas and results follows.
Concept Map (LS1) The formal context and starting point for developing the LSs is the QR software Garp3 (Bredeweg et al. 2009). LS1 is the smallest set of ingredients that constitute a meaningful subset from the representation used by this engine (figure 3). Effectively, this subset of modeling ingredients allows for the construction of concept maps (Novak and Gowin 1984), consisting of nodes connected by arcs (referred to as entities and configurations in Garp3, respectively). It is the only space in DynaLearn that has no explicit handles for capturing causal information. Learners are free to express knowledge that they believe to be causal information, but ideas remain in the eye of the beholder. They are not available for automated reasoning. The concept map representation available at LS1 implements a very approachable starting point for knowledge modeling.
Basic Causal Model (LS2) Defining a higher LS is done by augmenting the current space with the smallest subset of possible mod-
eling ingredients while ensuring that the next level is self-contained. Self-contained implies that the representational primitives present within an LS form a subset (of all the primitives available) such that this set allows for automated reasoning on behalf of the underlying software. After all, learners will be confronted with the logical consequences of their expressions through simulation, which either may or may not match the observed system behavior and the learner’s expectations thereof. Also important is that learners are able to create meaningful, qualitatively distinct, representations of the phenomena they are studying. The goal of LS2 is to have learners acquire an overall understanding of the cause-effect relationships governing the behavior of a system. Particularly, it allows learners to work on the distinction between entities and quantities and to express dependencies between quantities that carry causal information regarding how changes in the source quantity determine changes in the target quantity. Two such causal dependencies are available: + (positive: the source causes the target quantity to change in the same direction as the source), and – (negative: the source causes the target quantity to change in the opposite direction as the source). A user can also express direction of change (decrease, steady, and increase) for any of the available quantities (figure 4). When running the simulation, the tendencies (directions of change) of the yet unknown quantities are calculated based on the known value information and the represented dependencies (figure 5). In LS2, the conceptual model as a whole concerns a single state of system behavior. As such, the reasoning can be thought of as an intrastate analysis. The results may include ambiguity (figure 6) and inconsistency (figure 7), following standard QR calculus.
WINTER 2013 49
Articles
Live in
Benefit from
Habitat
Resources !
Producer
Size
Feed on Target population
Predator
Size !
Size
Figure 4. Support for Distinguishing Between Entities and Quantities. LS2 supports learners to distinguish between entities (for example, habitat) and quantities (for example, size), express causal information between quantities (for example, changes in the predator size change the target population size in the opposite way), and define initial directions of change (for example, predator sze is steady and habitat resources increasing). Also note that entities are related through structural relations, referred to as configurations (for example, producer live in habitat).
Live in Habitat
Resources !
Benefit from Producer
Size
Feed on Target population
Size
Predator
Size !
Figure 5. LS2 in Simulation Mode. LS2 is shown in simulation mode following the expression from figure 4. Habitat resources cause producer size to increase, which in turn causes target population size to increase. Predator size is steady and thus has no effect on this.
Causal Model with State Graph (LS3) The goal of LS3 is to have learners acquire the notion of state and state change, and to discover that state variables change values, causing the system to move into different states. LS3 augments LS2 by allowing (learner selected) quantities to have quantity spaces
50
AI MAGAZINE
and thus specific magnitudes (figure 8). Quantity spaces specify ranges of qualitative values ordered as sets of alternating intervals and points. The latter is also referred to as landmarks and should preferably denote threshold values for which the system changes behavior. Quantities can now start with a
Articles
Live in
Benefit from
Habitat
Resources !
Producer
Size
Feed on Target population
Predator
Size !
Size
Figure 6. Ambiguity. With a different initial direction of change for predator size (increase instead of steady as in figure 4) the influences on target population size become ambiguous: it may decrease, stay steady, or increase, as shown by the three inferred value assignments for this quantity.
Live in Habitat
Resources !
Benefit from Producer
Size
Feed on Target population
Size !
Predator
Size !
Figure 7. Inconsistency. When a simulation is inconsistent a red question mark is shown (and no inferred values result). Here the inconsistency is caused by target population size being set to decrease, which conflicts with this quantity increasing as a result of calculating the impact from the two other influencing quantities (see also figure 5).
specific magnitude value, so that the model can be in a specific initial state. Moreover, interstate reasoning is introduced, because the quantities with a quantity space may change values as a result of increasing or decreasing and cause the system as a whole to enter into a new qualitatively distinct state of behavior (figure 9). Third, directed and undirected value and quantity correspondences can be added between quantities and their magnitudes. Particularly, the
directed correspondences allow for the representation of what can be called magnitude causation. That is, the occurrence of some quantity’s value causes another quantity to have a certain value. For example, when the size of population is 0 (zero, there are no individuals), then the value of the death and birth rates will also be 0 (without individuals, nobody can die or get born). The model shown in figure 10 has a bidirectional version of the correspondence con-
WINTER 2013 51
Articles
Benefit from
Live in Habitat
Resources !
Producer
Predator
Target population
Size
Size !
Size
V
Zpm Maximum Plus Zero
Feed on
Eclsho Overpopulation High boundary Sustainable Low boundary Critical Extinct
Figure 8. Quantity Space. An expression regarding a food web is shown at LS3 in modeling mode, including the notions of quantity space and value correspondence (V). Target population size can take on values {Extinct, Critical, Low boundary, Sustainable, High boundary, Overpopulation}, as defined by its quantity space named Eclsho, while habitat resources can take on values {Zero, Plus, Maximum}. Initially, these quantities start at Sustainable and Plus, respectively. Habitat resources increase and predator size decreases. The directed value correspondence states that target population size may get the value High boundary when habitat resources reach Maximum.
Target population: Size
Habitat: Resources Maximum Plus Zero 1
3
1
2
Overpopulation High boundary 1 3 2 Sustainable Low boundary Producer: Size Critical Extinct
4
2
Predator: Size
4 1
3
2
4
4 1
3
3
2
4
Figure 9. Simulation Results at LS3, Following the Details Given in Figure 8. The state graph (left bottom) shows four states (black circles with numbered identifiers) and a reference to the initial starting situation (the not-numbered black circle). Also shown are the value histories for each quantity. For instance, in state 2 the target population size has the value High boundary (denoted by the small arrow) and is increasing (arrow pointing up); in state 4 this quantity has reached the value Overpopulation and is still increasing. The arrows between states indicate state transitions. Multiple state transitions originating from the same state indicate ambiguity, reflecting alternative possibilities. There are two behavior-paths [1 → 2 → 4] and [1 → 3 → 2 → 4]. The ambiguity from state 1 is about whether target population size and habitat resources simultaneously move to the next higher point value (as denoted by [1 → 2]), or if this change happens for habitat resources first and only later for target population size (as donated by [1 → 3 → 2]).
52
AI MAGAZINE
Articles
straint, stating that also birth and death cannot be 0 when a population exists.
Mice population
Causal Differentiation (LS4) The goal of LS4 is to have learners refine the notion of causality. What is the initial cause of change? How is this triggered? How do changes propagate through the system? LS4 refines the notion of causality by distinguishing between proportionality and direct influence (Forbus 1984). The notion of the propagation of changes as used in LS2 and LS3 stays in place, but this is now referred to as a dependency of the type proportionality. Newly added is an additional way in which the initial change may come about, namely using the notion of direct influence. The direct influence allows for specifying that the magnitude of some quantity (for example, a steady flow of water) causes the magnitude of some other quantity to change (to decrease or increase, for example, the amount of water in a bathtub). Also added is the idea of exogenous as opposed to endogenous behavior (Bredeweg, Salles, and Nuttle 2007), and the notion of an agent is used as a representation of the former. Multiple opposing direct influences on the same target quantity may result in ambiguity, or in a unique change when the relative strength of each flow can be determined. Hence, in/equality reasoning is relevant at this level and may become part of a causal account. Figure 10 shows a small LS4 model. Figure 11 shows its simulation results.
Conditional Knowledge (LS5) The goal of LS5 is to have learners acquire a more refined understanding of the conditional aspects of processes and system behavior. Newly added therefore is the idea of conditional knowledge. In LS1 through LS4 the specified knowledge is always true. That is, all facts (except current values) hold in all possible behavioral states of the system. At LS5 this idea is refined, recognizing that it may be the case that some facts are only true under certain conditions. A condition can be seen as an event and is typically represented as a value assignment or an in/equality statement. When the condition is satisfied, the additional knowledge becomes active and is taken into account. LS5 allows conditions and consequences to be added to a single core representation and can be considered a simplified version of LS6.
Generic and Reusable (LS6) LS6 provides the full range of representation and reasoning as available in Garp3 (Bredeweg et al. 2009). Learners create scenarios (figure 12) and model fragments (figures 13 and 14). In LS6, simulations are based on scenarios (describing the initial state of the system). The model fragments capture partial domain theories and can be seen as rules (IF [conditions], THEN [consequences]). If a scenario fulfills the conditions of a model fragment, the fragment
I+
I+
Birth
Death Number of P+
Zp Plus Zero
Zp Plus Zero
P+
V
Zpbh Higher Boundary Plus Zero
V Figure 10. Small LS4 Model.
This LS4 model defines entity mice population with quantities number of (state variable), and birth and death (both rates). Number of can take on values {Zero, Plus, Boundary, Higher}, as defined by its quantity space Zpbh. Birth and death can take on {Zero, Plus}, as defined by zp. In this initial state, all quantities have been assigned the value Plus (note that by definition each value is unique, and that these Plus values thus donate potentially different intervals). The derivatives are unassigned and thus unknown. Birth has a positive direct influence (I+) on number of, which means that the magnitude of the rate determines the change in number of. Changes in number of have a positive indirect influence (P+) on birth, implementing a feedback mechanism. There is a bidirectional value correspondence (V) between the Zero values of number of and birth. Similar details are specified for death, but the direct influence is negative (I–), since a positive death rate makes number of decrease.
becomes active, and the ingredients represented as consequences of the fragment are introduced to the state description and used to simulate the system’s behavior (figure 15). In fact, LS6 allows for expert-level modeling (Cioaca et al. [2009], Nakova et al. [2009]). The goals of LS6 are to have learners acquire generic knowledge of reoccurring processes and other patterns in system behavior, and how that generic knowledge instantiates to particular situations. In the example shown in figures 12–15 three such units occur. There is the notion of a birth and a death process, each applying twice to the scenario, and there is the notion of commensalism, also applying twice (here represented as a population benefiting from a resource).
Support and Interaction The LSs discussed above leave considerable freedom regarding the use of them in educational settings. For instance, a teacher can decide to give a buggy LS4 model to a class of learners with the assignment to study the related domain knowledge with the goal of repairing the buggy model. To support these different
WINTER 2013 53
Articles
Mice population: Number of
1
6
3
5
Higher
7
Boundary Plus
2
4
Zero 1
Mice population: Death
2
3
4
5
6
7
Mice population: Birth Plus Zero
1
2
3
4
5
6
Plus Zero
7
1
2
3
4
5
6
7
Figure 11. Simulation Results of Figure 10. Simulation results are shown, based on the model shown in figure 10, using the state graph (left-hand side top) and the value history (lefthand side bottom and right-hand side). The state graph has seven states. Each state reflects a qualitatively distinct behavior the system can manifest. Each sequence of states reflects a possible sequence of behaviors of the system. There are four such behavior paths that the system may manifest. The value history shows the quantities, their possible values, their actual value, and their direction of change in each state. For instance, the quantity number of in state 1 has value Plus and is decreasing. The four behavior paths reflect the typical behaviors of a population when only birth and death are known, namely: balance (paths [2] and [3 → 4]), growth (path [3 → 5 → 7]), or extinction (path [1 → 6]).
Benefit from
Benefit from Habitat Habitat Size ! Zsml High Boundary Low Zero
Population Producer
Population Beneficiary Size
Size Zsml High Boundary Low Zero
Zsml High Boundary Low Zero
= Birth
Zp Plus Zero
Death Zp Plus Zero
= Birth Zp Plus Zero
Death Zp Plus Zero
Figure 12 Fi 12. SScenario i at LS6 LS6. This figure shows a scenario at LS6, detailing three individuals: habitat, producer, and beneficiary. The latter two are of type population. The beneficiary benefits from the producer, which in turns benefits from the habitat. Size is the state variable for each of the individuals, and initially they all start at value High. The populations also have a birth and a death rate, all starting at value Plus, and the rates start as being equal for both populations. The habitat size has been set to decrease (not shown in this diagram). Given this situation, how will the system behavior evolve, and why? What are the mechanisms (such as processes) that explain that behavior? See figures 13, 14, and 15 for answers to these questions.
54
AI MAGAZINE
Articles
Ecosystem
Habitat
Biological entity
Population Population
Biomass
Population Static
Population
Resource
Size
Container Entity
Object
Birth Tap
Zsml High Boundary Low Zero
Process Death
Gas Substance Liquid
Agent
(a) Entity is-a hierarchy
(b) MF is-a hierarchy
Population Population Population
Population
Population
Population Population
Population Population I-
I+
P+ Size Zsml High Boundary Low Zero
(c) MF (static) Population
Q
Zsml Higher Boundary Low Zero
(d) MF (static) Biomass
Zsml High Boundary Low Zero
Size
Birth
Size
Biomass
P+
Zp Plus Zero
Zsml High Boundary Low Zero
P+
Zp Plus Zero
V
V
(e) MF (process) Birth
Death
(f) MF (process) Death
Figure 13. The Knowledge Used to Simulate and Explain Figure 12 System Behavior. This figure (together with figure 14) details the knowledge used to simulate and explain the behavior of the system shown in figure 12. Left top shows the entity is-a hierarchy. Individuals in the scenario are instantiated from these types. Similarly, model fragments (MFs) use these types to specify the structural details (conditions) under with they are applicable. As such, MFs are mapped onto a scenario using the entity hierarchy as an intermediate. The model shown here has five MFs, organized in is-a hierarchy, and each MF being of type static, process, or agent. The MF population introduces the state variable size. The MF biomass is a subtype of MF population and introduces the quantity Biomass. Biomass fully corresponds to size, as defined by the quantity correspondence (Q) and the proportionality (P+). The MF population is conditional for the birth and death processes to apply. When applicable these processes introduce their rates and feedback details (also shown and discussed in figure 10). Notice that the four MFs discussed here (c, d, e, and f) each apply twice to the scenario from figure 12.
modes of interaction, and also to enable learners to work autonomously, a set of supporting instruments has been developed. The global functions available in the DynaLearn ILE are illustrated in figure 16 (a screenshot of DynaLearn in action is shown in figure 19). At the kernel of the environment is a QR problem solver (Garp3) for constructing and simulating conceptual knowledge. The LSs are situated on top of this engine. In addition, the following support options are available: basic help (essentially elementary help on how
to use the software), recommendation (feedback derived from comparing the learner-built model to the models created by the community and stored in the repository), and diagnosis (feedback on simulation results, particularly helping learners maintain consistency between their models and the expectations they hold regarding the inferences that can be made on behalf of those models). Moreover, the DynaLearn ILE is made extra engaging and motivating by the design and use of virtual characters. The support and interaction are further discussed in the next sections.
WINTER 2013 55
Articles
Population Benefit from Population
Biological entity
Population
Producer Size
P+
Size
Zsml Higher Boundary Low Zero
Birth
Zsml Higher Boundary Low Zero
= = V
Death Zp Plus Zero
Zp Plus Zero
Figure 14. MF Resource Implementation. The MF resource implements a balance between the size of a biological entity (BSIZE) and a population (PSIZE) that benefits from this entity, and the birth (PBIRTH) and death (PDEATH) processes of this population, including: (BSIZE – PSIZE) = (PBIRTH – PDEATH). The balance causes the size of the population, depending on the resource, to move toward the carrying capacity supported by that resource. In summary, the biological entity acts as a resource. If the size of this resource is higher compared to the size of the benefiting population, that population will grow. When smaller, the population will shrink. Notice that during simulation the MF resource details intertwine with the details introduced by the birth and death processes (figure 13). The MF resource applies to both populations shown in figure 12.
Support by Basic Help The LSs are accompanied by a set of components to aid learners. The basic help component helps learners use the DynaLearn software (Beek, Bredeweg, and Latour 2011). It requires little foreknowledge regarding conceptual modeling or system dynamics thinking, and pertains to those aspects of the software that are visible to learners and that they can directly interact with. Three types of basic help have been addressed. A conceptual model in DynaLearn consists of domain-specific assertions embedded in the generic modeling language vocabulary. Each expression created by a learner is a subtype or a refinement of the latter. The What Is? help is able to describe occurrences of domain-specific assertions in terms of their context (other assertions) and generic embedding (modeling vocabulary). The How to? help explains how to perform tasks within the LSs. Only tasks that
56
AI MAGAZINE
can be performed given the current state of the ILE are communicated (figure 17). The Why? help gives information about the simulation results, including details such as listed in the caption text of figure 15.
Model Improving Recommendations DynaLearn has two components that provide advanced feedback on models created by learners: recommendation and diagnosis (figure 16). Recommendation concerns the ingredients that constitute a particular model, and does not involve simulation. Recommendation allows learners to compare their model to a repository of models and to get feedback on how their model differs from the models created by the community (teachers and experts) (Gracia et al. 2010). The recommendation component consists of three parts (1) grounding of model terminology into well-defined vocabularies; (2) storage of conceptual models in a centralized web-based repository; and (3) ontology-based feedback on the quality of the model, based on knowledge extracted from recommended models. The overall approach is illustrated in figure 18. After creating a model (or a partial model) a learner can call for recommendations. The first step is to ground the terms used in that model to an external vocabulary. For this, the software automatically generates a ranked list of most similar terms, from the external vocabulary, for each of the terms used in the model. This list is presented to the learner, who has to decide upon the most appropriate match and select it. Models that are created by the community, and grounded in this way, are stored in a semantic repository. For each newly added model an analysis is made regarding how it relates to the models already stored. And, because all models are grounded (by their creators) using the same external vocabulary, the repository models can be ranked automatically according to their similarity with this new model. The most similar models are considered most relevant and used to provide recommendations, essentially by listing the differences between these most similar models and the model created by the learner. The semantic repository is based on the MySQL1 database and the Jena2 semantic platform. The semantic repository has been developed as a web service, which is called from the DynaLearn ILE. The service includes storage, retrieval, classification, grounding, and so on of conceptual models. Before the model is stored, it is transformed into OWL (Grau et al. 2008), to allow for processing on behalf of the repository. A simple user management system has been developed as a separate web application to enable the creation and handling of users. There are five roles of users: guest, learner, teacher, domain expert, and administrator, each one with its own rights and privileges.
Articles
3
1
2
3
4
5
6
Habitat: Size
9
10
= = < < < < < < < = 1 2 3 4 5 6 7 8 9 10
Boundary Low
Birth(Beneficiary) ? Death (Beneficiary)
Zero 2
8
Birth(Producer) ? Death (Producer) High
1
7
3
4
5
6
7
= = < < < < < < < = 1 2 3 4 5 6 7 8 9 10
10
Producer: Size
Beneficiary: Size High
High
Boundary
Boundary
Low
Low
Zero 1
2
3
4
5
6
7
8
9
Zero 1
10
Producer: Birth
2
3
4
5
6
7
8
9
10
Beneficiary: Birth Plus Zero
1
2
3
4
5
6
7
8
9
10
Plus Zero 1
2
3
4
5
6
7
8
9
10
Figure 15. Fi 15 Simulation Si l ti t Results R lt ffrom Fi Figure 12 12. This figure shows part of the simulation results for the scenario from figure 12. The state graph has 10 states, with no branching (no ambiguity). Habitat size is set to decrease, and in state 1 it has value High and decreases. This causes the birth rate of the producer to decrease, and state 1 to change into state 2 in which birth = death becomes birth < death. This causes the producer size to decrease, which in turn causes the birth rate of the beneficiary to decrease, and state 2 to transit into state 3 in which birth = death becomes birth < death (for the beneficiary). These inequalities stay in place while the three state variables (the sizes) one after the other decrease and change value from High through Boundary to Low: resource size: [3 → 4 → 5], producer size: [5 → 6 → 7], and beneficiary size: [7 → 8 → 9]. Finally, all quantities move to 0 (Zero) in state 10. In summary, when the habitat size decreases to 0, the populations depending on that directly (producer) and indirectly (beneficiary) become extinct. See Bredeweg et al. (2009) for additional information on the knowledge representation and reasoning used here.
By grounding a model, DynaLearn is able to bridge the gap between the loose and imprecise terminology used by a learner and the well-defined semantics of an ontology. We decided to use DBpedia3 as the primary source of background knowledge for DynaLearn (Gracia et al. 2010). In the case there is no suitable DBpedia term that represents the intended user meaning, the definition of a new term is allowed (this option is only available for teachers and experts). Such anchor terms are stored in an external ontology (anchor ontology) in addition to DBpedia. Finally, multilingual grounding has been enabled to support the grounding of terms written in languages other than English, including Spanish, Portuguese, German, and Hebrew. As the repository of models grows, more related models will be available to fine-tune the feedback for a specific learner. However, to address specific
requirements found during evaluation sessions, it is also made possible for teachers to create a virtual class, upload one or more specific models into this class, and have learners receive feedback based on the content of the models stored in this class only.
Diagnosing Simulation Results When a learner simulates a model, the results may turn out different from what he or she expected. This is when learners can call upon the diagnostic component and receive support in determining the cause of this discrepancy. The simulation now becomes an instrument that helps learners reflect on their knowledge and work toward improving it. In principle, there are two ways to align simulation results with expectations thereof: learners can change their model, or they can change their expectations. Both are
WINTER 2013 57
Articles
Teachable agent (space 2)
Quiz (spaces 4-6) Special modes
Basic help
Population Green frog
I+ Birth
Number of
P+
Zlah Large Medium Small Zero
Zp Plus Zero
Recommendation
Build
Simulate
Diagnosis
Learning Spaces 1 through 6
Learner’s simulation expectation
Upload (by users) Model repository
Figure 16. Functional Overview of the DynaLearn ILE. In the center, some of the ingredients are shown that can be manipulated by learners, with on the left-hand side the build and on the righthand side the simulate environment (for example, as shown in figures 10 and 11, respectively), and the six learning spaces as a scaffold on top of this (left-hand side top) (also shown in figure 2). Users can upload models to the repository. Three components generate feedback: basic help, recommendation, and diagnosis. The feedback is communicated to learners through a cast of virtual characters. Finally, two specific modes of interaction are available as stand-alone learning environments: the teachable agent and the quiz.
relevant for learning, and often interact. The diagnostic component complements the recommendation component. Instead of focusing on the ingredients constituting a model, it addresses the simulation results of a model. The diagnostic component takes the discrepancies between the actual and the learner-expected simulation results as input. By asking additional questions it identifies those ingredients of the learner-built model that are accountable for these differences. The goal is to support the learner’s knowledge construction endeavor by maintaining consistency between the expression created by the learner and the expectations he or she holds regarding the inferences that can be made on behalf of that expression. The diagnostic component is derived from wellestablished model-based diagnostic technology (de Kleer and Williams 1987). An algorithm has been created based on the characteristics of the representation used for conceptual models (de Koning et al.
58
AI MAGAZINE
2000), and adjusted to include reasoning with the expectations that learners express (Beek and Bredeweg 2012). Following this approach, an expectation-based cognitive diagnosis has been established and integrated within the DynaLearn ILE. Learners can build models, run simulations, and express expectations. The diagnostic component provides automated feedback based on the discrepancy between simulation results and expectations, in terms of ingredients in the built model. In this way, the learner is pointed toward those parts of his or her model that cannot be right given the expectations he or she expressed.
Special Modes of Interaction DynaLearn has two specialized interactive modes, the teachable agent (TA) and the quiz. The TA works on top of LS2 and implements a specific setting in which learners “learn by teaching” (Leelawong and
Articles
Select this quantity to add an inequality. Entity Firm
Select another quantity.
Cost Zp Plus Zero
Set the state of the inequality. Set the type of the inequality. Swap the arguments. Add Remarks. Press save to store changes
Revenue Zp Plus Zero
Figure 17. How To? Help Options. The How to? help options are listed for the model fragment shown on the left-hand side. The example shows a learner requesting how to add an inequality relation (for example, to state that costs > revenue). The subtasks required for performing this action are shown on the right-hand side and presented to the learner when selecting a particular task from the pull-down menu.
Online ontologies
Grounding of learner model
Learner model
Semantic repository
Grounded learner model
Selection of relevant models
Relevant models
? List of suggestions Learner
Generation of semantic feedback
Figure 18. The Recommendation Process. After building a model (Learner model), the learner grounds the model ingredients using an online ontology. The grounded model is compared with other grounded models from the repository. The most relevant models are used to generate feedback. The suggestions are presented as a list (and commented on by the virtual characters, if asked for by the learner).
Biswas 2008). The learner teaches the TA, an animated virtual character, by creating a model (figure 19). This model represents what the TA knows. With this taught knowledge the TA can answer questions and explain the answers. The learner can also send the TA to the quizmaster to take a quiz. The quizmaster asks
questions based on a reference model (set at the beginning of the modeling session). The TA answers these questions based on the model created by the learner. Correctness is determined by comparing the answers of the TA with the answers given by the reference model.
WINTER 2013 59
Articles
Figure 19. The Learner Teaches the TA by Creating a Model. DynaLearn TA mode using LS2, with a learner-made model (left-hand side), and two interacting virtual characters (right hand side). The rightmost peer (named Tobi), representing the TA, is taking the quiz, and the quizmaster (to the left of Tobi, named Harry) is asking the questions.
By creating, testing, correcting, and refining the TA’s understanding of the subject matter, the learner effectively constructs his or her own knowledge of the subject matter. The quiz can be used in all spaces except for LS1. It is based on QUAGS (Goddijn, Bouwer, and Bredeweg 2003) and reorganized into a component that automatically generates multiple-choice questions for arbitrary QR models. Learners can test their understanding of a given model (or be assessed for it) by taking a quiz with the quizmaster. The quizmaster selects questions using four heuristics: (1) the model ingredients they are about (those not well understood by the learner are preferred), (2) whether they were asked before (those new to the learner are preferred), (3) the question type (those that were asked least are preferred), and (4) the question difficulty (each session starts with an easy question, difficulty is adjusted based on the learner’s performance, and questions of the appropriate difficulty are preferred). The quiz can be used in stand-alone mode, but can also be integrated with other interactive modes, such as with the TA mentioned above.
60
AI MAGAZINE
Virtual Characters A large part of the communicative interaction with the DynaLearn ILE happens through virtual characters, although learners (and teachers) can decide to not use the characters (except for the TA mode, which requires the characters). Given the range of possible interactions the DynaLearn ILE offers to a learner, the characters have to show a likewise diversity (through their design and the implementation of their behavior). Animal characters are expected to have lower communication skills than humanlike characters, allowing learners to more willingly forgive technical imperfections (Mehlmann et al. 2010). For these reasons, it was decided to create a set of cartoonish hamster characters with unique roles and personalities. The basic help, recommendation, diagnosis, teachable agent, and quiz interactions were each assigned characters based on character roles and personality (for example, critical, supportive, inquisitive). Keeping the target audience of students in mind, a schoolyardlike scenario was conceived, but not strictly enforced. Beside the student characters,
Articles
Figure 20. Virtual Characters in DynaLearn. Left to right: Teachable agents (girl and boy), critic, teacher, quizmaster, and mechanic.
Conceptual Knowledge
Learner Model
Assign Turns
Decide dialog content
Choose nonverbal behavior
Pedagogical strategies
Interaction History
Verbalize dialog
Animations
Create presentation Presentation
Scene script Generate speech
Templates
Voices
Figure 21. Overview of the Dialogue-Generation Process.
which reflect the situation of the actual learners, a teacher character assists and advises the learner during the application usage (mainly basic help). The character of the quizmaster is used to present the playful part in the quiz, the critic brings the recommendations, and the mechanic character handles the diagnosis (figure 20). Figure 21 illustrates the process by which DynaLearn generates dialogue. The process starts with an input from a modeling workspace. Let us assume that a learner just sent the TA to take the quiz. As a result, the conceptual knowledge submitted in this case consists of questions and answers generated by QUAGS based on the reference model, but it will also include answers to these same questions generated from the learner-built model. First,
the dialogue content needs to be decided. This can be based on previous actions performed by the learner or the characters (derived from the interaction history and learner model), as well as certain pedagogical strategies. Next, the content is assigned to the different characters involved. In this case, the quizmaster character will ask the questions, while the TA will present the answers (generated by the learner-built model). Also, the quizmaster will comment on the TA’s success and the TA will show a reaction to that. Next, the dialogue turns are verbalized using an appropriate template. If there is more than one matching template, one of them is chosen randomly. Finally, nonverbal behavior is selected to accompany the dialogues. The characters can move around the screen, perform gestures and facial animations, and
WINTER 2013 61
Articles
point out spaces on the screen. In the example, after each question, the quizmaster will perform either a thumbs-up gesture or shake his head depending on the TA’s success, and the TA will perform a cheering or sulking gesture accordingly. Based on the decisions made by the software, the scene script is constructed (in XML). Next, the content of say-tags is extracted and the speech is created accordingly, using the assigned character’s voice. Together with the appropriate data from the animation library, the complete dialogue can then be presented to the learner. For further details, see Wissner et al. (2012).
Content Models Content models populate the semantic repository. They allow for semantic feedback and can be used in the TA and quiz interactions. For this, a set of environmental science topics was selected focusing on seven main themes: Earth systems and resources, the living world, human population, land and water use, energy resources and consumption, pollution, and global changes. This selection was based on EU directives for science education (Eurydice 2006), and on a survey of existing curricula of environmental science in secondary schools and undergraduate courses from the national educational systems of the DynaLearn project partners (Salles et al. 2009). Ultimately, the domain knowledge of 65 topics within the seven themes were explored, covered in 210 expert-built models, and stored in the semantic repository. The models themselves are described in a set of technical reports. For a recent review see Salles et al. (2012).
Evaluation Studies with DynaLearn Students have been using the DynaLearn ILE in multiple educational settings, including high school, undergraduate, graduate, and Ph.D., and also in many countries, including Austria, Brazil, Bulgaria, Israel, the Netherlands, and the United Kingdom. Most of these uses were part of evaluations researching the educational benefits of teaching using DynaLearn (in total 49 evaluation activities involving 736 participants). To illustrate the kind of studies conducted, consider the following examples. One study concerned a multiple days taking enterprise in which two learners developed models of phenomena following explanatory-seeking assignments (Zitek et al. in press). Learners started with LS1 and progressed up to LS4. The main focus of the study was to investigate conceptual changes on behalf of the learners. The evaluation results showed significant changes occurring in knowledge structure and content reflecting the learners’ understanding of the subject matter, supporting the hypothesis that building conceptual models helps learners grow from initial (personal) under-
62
AI MAGAZINE
standing toward more scientific understanding. In another study, the role of semantic-based feedback (recommendations) was investigated in the context of a problem-based learning setting (Lozano et al. 2012). After having created their initial (solution) models, learners engaged in the activity of grounding the terms occurring in their models and after that obtaining feedback generated by the learning environment. The study showed how this approach helps learners bridge the gap between their initial model, as their first attempt to represent the system, and the target models that provide expert solutions to the problem. An exhaustive review of the evaluation studies carried out within the DynaLearn project can be found in Mioduser et al. (2012). In summary, the evaluations show that throughout modeling sessions, the students’ system thinking improved considerably. Aspects of system thinking that improved include gaining a systemic view of systems, identifying structure and behavior, distinguishing different kinds of causal relations (notably, influences and proportionalities), and understanding of causal patterns such as chains and feedback loops. Most of these evaluation studies also measured motivational aspects. The results indicate that learning by modeling with DynaLearn is considered motivating. Many students indicate the possibility (and in some cases desire) to apply conceptual models in other science courses. However, this result appears independent of whether the virtual characters are used or not. In fact, the added value of this component is not conclusive.
Discussion Each of the learning spaces (LSs) in DynaLearn acts as a stand-alone unit. Models created at one space cannot be loaded into any of the other LSs. Future research could focus on supporting the transition from an expression at one LS to an expression at another LS. User modeling in DynaLearn, in the sense of capturing the learner’s progress on learning, is only implemented for the quiz mode. For all other interactions the feedback is generated based on the current status of the model and the kind of feedback evoked by the learner. For instance, if the recommendation is called twice in a row without changing the model, the feedback will be the same for both calls. Although this is in principle correct, it would be interesting to investigate whether a learner model (including the dialogue history) could be used to influence and modify the interaction in a sensible way, and make it have a positive impact on the learner’s knowledge-construction progress. Feedback in DynaLearn depends on a learner asking for it. The idea was to establish a learning environment that is unobtrusive, and hence, the learner
Articles
is in control and decides when help is required. But evaluation studies show that learners may not always ask for support, even when that would be the better option at some point in the learning process. Future research could focus on finding a proper balance such that the learning environment automatically intervenes when needed and appropriate, and otherwise waits until being called for. DynaLearn has been focusing mainly on environmental science. Although this was according to plan, the applicability of the DynaLearn approach is expected for all areas of science that take a systems perspective on the subject matter. But moving into a new area is not without costs. It will require a repository of models to be created for that domain in order for the recommendation functionality to work, as well as other course materials.
Conclusion The DynaLearn project has established an intelligent learning environment (ILE) that allows learners to work with conceptual knowledge using a representation that closely fits the true nature of that expertise. The complexity of the underlying qualitative reasoning vocabulary has been successfully overcome by establishing a set of learning spaces that scaffolds learners in gradually building up their abilities, both in learning qualitative system dynamics in general and in learning domain knowledge specifically. Additional instruments have been created that support learners in their knowledge construction effort, including (1) a procedure that automatically generates relevant multiple-choice questions for any model expressed in a DynaLearn workspace, (2) a diagnostic component that aids learners in creating a model that is consistent with the expectations the learner has for the system behavior, and (3) a recommendation component that allows learners to obtain feedback regarding how their models differ from related models created by the community and stored in a repository (and a significant set of conceptual models has already been created and stored in the repository). An encompassing set of studies has been undertaken, investigating the DynaLearn ILE. Overall, these studies show the great potential of the DynaLearn approach.
Acknowledgement The research presented in this article is cofunded by the EC within the 7th Framework Programme, project DynaLearn, no. 231526, www.dynalearn.eu.
References André, E. 2008. Design and Evaluation of Embodied Conversational Agents for Educational and Advisory Software. In The Handbook of Conversation Design for Instructional Applications, ed. R. Luppicini. Toronto, ON: IRM Press. Beek, W., and Bredeweg, B. 2012. Providing Feedback for Common Problems in Learning by Conceptual Modeling Using Expectation-Driven Consistency Maintenance. Paper presented at the 26th International Workshop on Qualitative Reasoning, Playa Vista, CA, 16–18 July. Beek, W.; Bredeweg, B.; and Latour, S. 2011. Context-Dependent Help for the DynaLearn Modelling and Simulation Workbench. In Proceedings of the 15th Artificial Intelligence in Education Conference, Lecture Notes in Computer Science, 420–422. Berlin: Springer. Bouwer, A., and Bredeweg, B. 2010. Graphical Means for Inspecting Qualitative Models of System Behaviour. Instructional Science 38(2): 173–208. Bredeweg, B., and Forbus, K. 2004. Qualitative Modeling in Education. AI Magazine 24(4): 35–46. Bredeweg, B., and Salles, P. 2009. Qualitative Models of Ecological Systems — Editorial Introduction. Ecological Informatics 4(5–6): 261–262. Bredeweg, B., and Winkels, R. 1998. Qualitative Models in Interactive Learning Environments: An Introduction. Interactive Learning Environments 5(1–2): 1–18. Bredeweg, B.; Liem, J.; Beek, W.; Salles, P.; and Linnebank, F. 2010. Learning Spaces as Representational Scaffolds for Learning Conceptual Knowledge of System Behaviour. In Proceedings of the Fifth European Conference on Technology Enhanced Learning, Lecture Notes in Computer Science 6383, 7–61. Berlin: Springer. Bredeweg, B.; Linnebank, F.; Bouwer, A.; and Liem, J. 2009. GARP3 — Workbench for Qualitative Modelling and Simulation. Ecological Informatics 4(5–6): 263–281. Bredeweg, B.; Salles, P.; and Nuttle, T. 2007. Using Exogenous Quantities in Qualitative Models about Environmental Sustainability. AI Communications 20(1): 49–58. Bredeweg, B.; Salles, P.; Bertels, D.; Rafalowicz, J.; Bouwer, A.; Liem, J.; Feltrini, G. M.; Caldas, A. L. R.; Resende, M. M. P.; Zitek, A.; and Nuttle, T. 2007. Training Report on Using QR for Learning About Sustainable Development. Technical Report Deliverable D7. 2, Strep Project Fp6 No. 004074, Naturnet-Redime, Universiteit van Amsterdam, Amsterdam, The Netherlands. Cioaca, E.; Linnebank, F. E.; Bredeweg, B.; and Salles, P., 2009. A Qualitative Reasoning Model of Algal Bloom in the Danube Delta Biosphere Reserve. Ecological Informatics 4(5– 6): 282–298. de Kleer, J., and Williams, B. C. 1987. Diagnosing Multiple Faults. Artificial Intelligence Journal 32(1): 97–130. de Koning, K.; Bredeweg, B.; Breuker, J.; and Wielinga, B. 2000. Model-Based Reasoning About Learner Behaviour. Artificial Intelligence Journal 117(2): 173–229. de Koning, K. 1997. Model-Based Reasoning about Learner Behaviour. Amsterdam, The Netherlands: IOS Press.
Notes
Elio, R., and Sharf, P. B. 1990. Modeling Novice-to-Expert Shifts in Problem Solving and Knowledge Organization. Cognitive Science 14(4): 579–639.
2. See http://jena.sourceforge.net.
Eurydice 2006. The Information Network on Education in Europe. Science Teaching in Schools in Europe: Policies and
1. See www.mysql.com. 3. See http://dbpedia.org.
WINTER 2013 63
Articles Research. Technical Report, Directorate-General for Education and Culture. Brussels, Belgium: European Union. Forbus, K. D. 2008. Qualitative Modeling. In Handbook of Knowledge Representation, Volume 3 of Foundations of Artificial Intelligence, ed. F. van Harmelen, V. Lifschitz, and B. Porter, 361–393. Amsterdam: Elsevier. Forbus, K. D. 1984. Qualitative Process Theory. Artificial Intelligence 24(1–3): 85–168. Forbus, K. D., and Falkenhainer, B. 1990. Self-Explanatory Simulations: An Integration of Qualitative and Quantitative Knowledge. In Proceedings of the 8th National Conference on Artificial Intelligence, 380–387. Menlo Park, CA: AAAI Press. Forbus, K. D.; Carney, K.; Sherin, B. L.; and Ureel II, L. C. 2005. Vmodel — A Visual Qualitative Modeling Environment for Middle-School Students. AI Magazine 26(3): 63–72. Forbus, K. D.; Carney, K.; Sherin, B. L.; and Ureel II, L. C. 2004. Vmodel: A Visual Qualitative Modeling Environment for Middle-School Students. In Proceedings of the 16th Innovative Applications of Artificial Intelligence Conference, 820– 827. Menlo Park, CA: AAAI Presss. Frederiksen, J. R., and White, B. Y. 2002. Conceptualizing and Constructing Linked Models: Creating Coherence in Complex Knowledge Systems. In The Role of Communication in Learning to Model, ed. P. Brna, M. Baker, K. Stenning, and A. Tiberghien, 69–96. London: Lawrence Erlbaum Associates. Goddijn, F.; Bouwer, A.; and Bredeweg, B. 2003. Automatically Generating Tutoring Questions for Qualitative Simulations. Paper presented at the 17th International Workshop on Qualitative Reasoning, Brasilia, Brazil, August 20–22. Gracia, J.; Liem, J.; Lozano, E.; Corcho, O.; Trna, M.; GómezPérez, A.; and Bredeweg, B. 2010. Semantic Techniques for Enabling Knowledge Reuse in Conceptual Modelling. In Proceedings of the 9th International Semantic Web Conference, Lecture Notes in Computer Science 6497, 82–97. Berlin: Springer. Grau, B.; Horrocks, I.; Motik, B.; Parsia, B.; Patelschneider, P.; and Sattler, U. 2008. Owl 2: The Next Step for Owl. Web Semantics: Science, Services and Agents on the World Wide Web 6(4): 309–322. Grimm, V. 1994. Mathematical Models and Understanding in Ecology. Ecological Modelling 75/76: 641–651. Haefner, J. W. 2005. Modeling Biological Systems: Principles and Applications. Berlin: Springer. Hucke, L., and Fischer, H. E. 2003. The Link of Theory and Practice in Traditional and in Computer-Based University Laboratory Experiments. In Teaching and Learning in the Science Laboratory, Volume 16 of Science and Technology Education Library, ed. K. Tobin, D. Baker, B. Bell, R. Duit, M. Espinet, B. Fraser, O. Jegede, R. Lazarowitz, W.-M. Roth, T. Hsiao-Lin, L. R. Herrera, D. Psillos, and H. Niedderer, 205– 218. Berlin: Springer. Kinnebrew, J. S., and Biswas, G. 2011. Modeling and Measuring Self-Regulated Learning in Teachable Agent Environments. Journal of E-Learning and Knowledge Society 7(2): 19– 35. Kuipers, B. 1994. Qualitative Reasoning: Modeling and Simulation with Incomplete Knowledge, 452. Cambridge, MA: The MIT Press. Leelawong, K., and Biswas, G. 2008. Designing Learning by Teaching Agents: The Betty’s Brain System. International Journal of Artificial Intelligence in Education 18(3): 181–208.
64
AI MAGAZINE
Liem, J.; Beek, W.; and Bredeweg, B. 2010. Differentiating Qualitative Representations Into Learning Spaces. Paper presented at the 24th International Workshop on Qualitative Reasoning, Portland, OR, 8–10 August. Lozano, E.; Gracia, J.; Corcho, O.; Noble, R. A.; and GómezPérez, A. 2012. Problem-Based Learning Supported by Semantic Techniques. Interactive Learning Environments 20(4): 351–357. Mehlmann, G.; Häring, M.; Bühling, R.; Wißner, M.; and André, E. 2010. Multiple Agent Roles in an Adaptive Virtual Classroom Environment. In Proceedings of the 10th Intelligent Virtual Agents, 10th International Conference, Lecture Notes in Computer Science 6356, 250–256. Berlin: Springer. Mettes, C. T. C. W., and Roossink, H. J. 1981. Linking Factual and Procedural Knowledge in Solving Science Problems: A Case Study in a Thermodynamics Course. Instructional Science 10(4): 333–361. Mioduser, D.; Zuzovsky, R.; Salles, P.; Souza, A.; Portella, A.; Braga, E.; Wilhelms, L.; Pereira Resende, M.; Morison, G.; Assumpção da Costa e Silva, P.; Gontijo de Sá, I.; Pires, L.; Simões, A.; Noble, R.; Cowx, I.; Borisova, P.; Liem, J.; Uzunov, Y.; Zurel, D.; Leiba, M.; Benayahu, H.; Nachmias, R.; Ram J.; Zitek, A.; Poppe, M.; and Stelzhammer, M. 2012. Final Report on DynaLearn Evaluation Studies. DynaLearn, EC FP7 Strep Project 231526, Deliverable D7.4. Amsterdam, The Netherlands: Universiteit Van Amsterdam. Mylopoulos, J. 1992. Conceptual Modeling, Databases, and Case: An Integrated View of Information System Development. In Conceptual Modeling and Telos, 49–68. New York: Wiley. Nakova, E.; Linnebank, F. E.; Bredeweg, B.; Salles, P.; and Uzunov, Y. 2009. The River Mesta Case Study: A Qualitative Model of Dissolved Oxygen and Sustainable Development in Aquatic Ecosystems. Ecological Informatics 4(5–6): 339– 357. Niedderer, H.; Aufschnaiter, S.; Tiberghien, A.; Buty, C.; Haller, K.; Hucke, L.; Sander, F.; and Fischer, H. E. 2003. Talking Physics in Labwork Contexts — A Category Based Analysis of Videotapes. In Teaching and Learning in the Science Laboratory, Volume 16 of Science and Technology Education Library, ed. K. Tobin, D. Baker, B. Bell, R. Duit, M. Espinet, B. Fraser, O. Jegede, R. Lazarowitz, W.-M. Roth, T. Hsiao-Lin, L. R. Herrera, D. Psillos, and H. Niedderer, 31– 40. Berlin: Springer. Novak, J. D., and Gowin, D. B. 1984. Learning How to Learn. Cambridge and New York: Cambridge University Press. Osborne, J.; Simon, S.; and Collins, S. 2003. Attitudes Towards Science: A Review of the Literature and Its Implications. International Journal of Science Education 25(9): 1049–1079. Ploetzner, R., and Spada, H. 1998. Constructing Quantitative Problem Representations on the Basis of Qualitative Reasoning. Interactive Learning Environments 5(1–2): 95–108. Pratap, R. 2009. Getting Started with Matlab: A Quick Introduction for Scientists and Engineers. Oxford, UK: Oxford University Press. Richmond, G., and Peterson, S. 1992. Stella II: An Introduction to Systems Thinking. Hanover, NH: High Performance Systems, Inc. Salles, P.; Assumpção Costa e Silva, P.; Gontijo de Sá, I.; Noble, R.; Zitek, A.; Uzunov, Y.; and Mioduser, D. 2009. DynaLearn Environmental Science Curriculum Requirements. DynaLearn, Ec Fp7 Strep Project 231526, Deliverable
Articles D6.1. Amsterdam, The Netherlands: Universiteit Van Amsterdam. Salles, S.; Souza, A.; Noble, R.; Zitek, A.; Borisova, P.; Leiba, M.; and Bredeweg, B. 2012. DynaLearn Curriculum for Environmental Science. DynaLearn, Ec Fp7 Strep Project 231526, Deliverable D6.5. Amsterdam, The Netherlands: Universiteit Van Amsterdam. Schwarz, C. V., and White, B. Y. 2005 Metamodeling Knowledge: Developing Students’ Understanding of Scientific Modeling. Cognition and Instruction 23(2): 165–205. Wißner, M.; Beek, W.; Lozano, E.; Mehlmann, G.; Linnebank, F.; Liem, J.; Häring, M.; Bühling, R.; Gracia, J.; Bredeweg, B.; and André E. 2012. Increasing Learners’ Motivation Through Pedagogical Agents: The Cast of Virtual Characters in the DynaLearn ILE. In Agents for Educational Games and Simulations, International Workshop, Lecture Notes in Artificial Intelligence 7471, ed. M. Beer, C. Brom, F. Dignum, and V.-W. Soo, 151–165. Berlin: Springer. Zitek, A.; Poppe, M.; Stelzhammer, M.; Muhar, S.; and Bredeweg, B. 2013. Learning by Conceptual Modelling — Changes in Knowledge Structure and Content. IEEE Transactions of Learning Technologies 6(1).
Bert Bredeweg is an associate professor at the Informatics Institute within the University of Amsterdam (UvA), Netherlands, and coordinator of the DynaLearn project. His research focuses on interactive learning environments that enable learners to explore and acquire conceptual knowledge. Jochem Liem is a postdoc researcher at the University of Amsterdam (UvA), Netherlands, and technical coordinator for the DynaLearn project. His research focuses on OWLbased interoperability between functional units of knowledge systems. Wouter Beek is a Ph.D. student at the Free University of Amsterdam (VU), Netherlands. His job is to invent a new semantic paradigm for interpreting existing semantic web data, taking the contradictions, ambiguities, and context dependencies into account. Floris Linnebank worked as a programmer on the DynaLearn project on behalf of the University of Amsterdam (UvA), Netherlands, addressing the underlying qualitative reasoning engine (Garp3). Jorge Gracia is a researcher at Universidad Politécnica de Madrid (UPM), Spain, within the Ontology Engineering Group (OEG), participating in leading research projects on semantics and knowledge engineering. Esther Lozano is a Ph.D. student at Universidad Politécnica de Madrid (UPM), Spain, within the Ontology Engineering Group (OEG). Her research activities focus on semantic web and ontological engineering. Michael Wißner is a researcher at the University of Augsburg (UAU), Germany, within the Human-Centered Multimedia group, focusing on pedagogical agents in interactive (learning) environments and natural language dialog generation. René Bühling is a Ph.D. student at the University of Augs-
Please Join Us for the Fifth Symposium on Educational Advances in Artificial Intelligence! For more information and a call for papers, please see www.aaai.org/Symposia/EAAI/2014/eaai14.php burg (UAU), Germany, within the Human-Centered Multimedia group, addressing entertainment computing, focusing on working on virtual characters, interactive cinematography, and visual dramaturgy. Paulo Salles is an associate professor at the Institute of Biological Sciences within the University of Brasília (UNB), Brazil, focusing on Qualitative Reasoning. He develops models of issues related to sustainable development, water resources, and ecology of populations and communities. Richard Noble is a researcher at the Hull International Fisheries Institute within the University of Hull (UK), with a diverse interest in the field of fish ecology and environmental management. He is also interested in the role conceptual modeling can play in the enhancement of environmental science education. Andreas Zitek is a senior researcher at the University of Natural Resources and Life Sciences (BOKU), Austria. One focus of his work is the assessment and evaluation of fish migrations in rivers. Another one is modeling, particularly the application of qualitative reasoning in research, education, and management. Petya Borisova is a Ph.D. student at the Institute of Biodiversity and Ecosystem Research at the Bulgarian Academy of Sciences (IBER), Bulgaria, focusing on ecological modeling. David Mioduser is a professor of science and technology education within the Tel Aviv University (TAU), Israel. His interest includes learner’s perception and ability to understand, interact with, and design the artificial world, with a focus on young children’s thinking and learning processes.
WINTER 2013 65