Journal of Strength and Conditioning Research Publish Ahead of Print DOI: 10.1519/JSC.0000000000002518
Dynamic Balance Evaluation: Reliability and Validity of a Computerized Wobble Board
Andrea Fusco1,2, Giuseppe Francesco Giancotti1, Philip X Fuchs1,2, Herbert Wagner2, Carlo
Department of Human Sciences, Society and Health, University of Cassino e Lazio Meridionale,
Italy
TE
1
D
Varalda3, Laura Capranica4, Cristina Cortis1.
Department of Sports Science and Kinesiology, University of Salzburg, Austria
3
Italian Weightlifting Federation FIPE, Rome, Italy
4
Department of Movement, Human and Health Sciences, University of Rome Foro Italico, Italy
Corresponding author Cristina Cortis, PhD
C EP
2
Via S. Angelo - Località Folcara 03043 Cassino (FR), Italy
C
Tel: +39 0776 299 4436
Fax: +39 0776 299 3839
A
e-mail:
[email protected]
Running head: Wobble Board Testing Laboratory: Sport and Exercise Physiology “Marco Marchetti”, Department of Human Sciences, Society and Health, University of Cassino e Lazio Meridionale, Italy
No funds were received for this work from any of the following organizations: National Institutes of Health (NIH); Wellcome Trust; Howard Hughes Medical Institute (HHMI); and other(s). Copyright ª 2018 National Strength and Conditioning Association
1
ABSTRACT Computerized Wobble Boards (WB) are inexpensive, transportable and user-friendly devices to objectively quantify the dynamic balance performances out of laboratory settings, although it has not been established if they are reliable and valid tools. Therefore, the purpose of this study was to determine the reliability and validity of a computerized WB. Thirty-nine (18
D
female, 21 male) young adults (age: 23.3±2.1years; body mass: 65.9±1.8kg; height: 168.2±8.8cm; leg length: 78.8±5.7cm; BMI: 23.2±2.1kg·m-2) participated in the study.
TE
Subjects were assessed during three separate sessions on different days with a 48h rest in between. A total number of two WB single limb tests and one Y Balance Test (YBT) were performed. The WB performance was registered using the proprietary software and
C EP
represented by the time spent in the target zone, which represented the 0° tilt angle measured by the tri-axial accelerometer in the WB. YBT normalized reach distances were recorded for the anterior, posteromedial and posterolateral directions. Intraclass correlation coefficient, 95% confidence interval, standard error of measurement, minimal detectable change and Bland-Altman plots were used to evaluate intrasession and intersession reliability, while
C
Pearson product moment correlation was used to determine concurrent validity. Reliability ranged from fair to excellent, showing acceptable levels of error and low minimal detectable
A
change. However, all correlation coefficients between WB and YBT outcomes were poor. Despite the two methods addressing different aspects of balance performance, WB seems to validly serve its purpose and showed good reliability. Therefore, computerized WBs have the potential to become essential devices for dynamic balance assessment.
Key Words: neuromuscular performance, instability, prevention, postural control, proprioception.
Copyright ª 2018 National Strength and Conditioning Association
2
INTRODUCTION Human balance is commonly described as the ability to maintain the projection of the body’s center of gravity (CoG) within its base of support (BoS) (8). It can be classified into static, as the ability to keep the body in static balance or maintain the CoG within a BoS during a still upright position while standing or sitting (40), and dynamic, as the ability to maintain balance while the CoG and the BoS are moving or when the CoG is projected outside the BoS (39).
D
Effective human balance control requires an integrative and coordinated use of visual,
TE
vestibular and proprioceptive systems, aimed at producing successful sensory-motor strategies responses to control the body’s CoG displacement over its BoS (18,22,31). The evaluation of balance provides essential information concerning the efficiency of the
C EP
skeletal and neuromuscular systems. To test the effectiveness of balance training aimed at improving postural control (8,41) or reducing sports injury rates (9,10), different methodologies, protocols and devices such as video-based systems, accelerometers, force plates and functional tests (7) have been used in clinical and field settings (2,38). Measures of center of pressure (CoP) sway behavior recorded from force platforms are considered the gold standard for assessing balance performances (19), by providing unique information.
C
However, their cost and/or complexity do not permit large-scale assessments by limiting their applicability, as they are typically time-consuming (24). Conversely, practical techniques and
A
protocols have been developed (16), being easily and inexpensively administrable. In particular, functional evaluations may provide an effective non-instrumented and clinically applicable test for assessing balance and neuromuscular control (35). Among functional tests, the Y Balance Test (YBT), a modified instrumented version of the Star Excursion Balance Test (16), has been shown to be a valid and reliable measure of dynamic balance (29,34) and an excellent tool to detect possible lower-extremity impairments (12,25) and predict injuries (11,30). Although high levels of intra and intertester reliability are reported for functional
Copyright ª 2018 National Strength and Conditioning Association
3
tests, literature suggests that adequate practice trials should be performed (16,21), somehow affecting its applicability in field-based evaluations, where time constraints are crucial. Despite functional tests are also used to train neuromuscular control, unstable platforms, such as Wobble Boards (WB), are the most used tools to train human balance, showing their effectiveness in improving postural control among different populations (5,8,27,28).
D
Recently, WBs have been equipped with accelerometers, 3 degrees of freedom orientation sensors or tilt sensors that connected via USB cable or wireless to a computer can display the
TE
WB balance performances. Therefore, instrumented WBs have been proposed to assess dynamic balance performances, showing that WBs are reliable for measuring balance across a series of common WB tasks in a healthy sample (37). Only few studies (13,14,20,23,37)
C EP
investigated the within-day reliability of an instrumented WB for balance performance evaluations, and to the best of our knowledge, no study demonstrated the intersession reliability and concurrent validity of WB when assessing dynamic balance performances. Repeatedly measure variables of postural stability constitute an essential prerequisite to detect training-induced changes free from errors in the testing procedure (26). Therefore, the
C
purposes of this study were: (i) to determine the intrasession and intersession reliability of the computerized WB measures during a single limb task; and (ii) to determine the WB
A
concurrent validity with a YBT. It was hypothesized that computerized WB would be a reliable and valid device to evaluate the dynamic balance performance. METHODS
Experimental Approach to the Problem Although balance tests on force platform are considered the criterion standard for balance assessment, in the present study a functional approach was favored to fulfill the lack of empirical evidence about the concurrent validity during a single limb task using a
Copyright ª 2018 National Strength and Conditioning Association
4
computerized WB. Therefore, force platforms were not chosen because considered not challenging enough to evaluate dynamic balance in young adults. The one leg stance was preferred for the evaluation of dynamic balance on WB because it is a common and challenging task employed during WB exercises and could be more suitable for the measurement of balance ability in young subjects. Therefore, the YBT was thought to be
D
the most appropriate test from which to determine concurrent validity. In addition, the YBT is considered a reliable (Intraclass correlation coefficients [ICC] ranging from 0.85 to 1.00) test
TE
of dynamic balance widely used in clinical practice and sport related balance evaluations (29,34).
During three separate sessions (independent variable) on different days, a total number of two
C EP
WB tests and one YBT test in between were performed after a familiarization period. The time window between the first (WB test) and the last (WB retest) session was seven days and to minimize the potential of training effect, sessions were organized with 48 hours rest in between. To avoid any potential fatigue effect, subjects were required to refrain from any moderate-to-vigorous physical activity for at least 24 hours before the experimental session.
C
Since a diurnal pattern has been observed in dynamic balance performances (17), all data were collected during morning sessions. It has been hypothesized that fluid ingestion could
A
be responsible for the preservation of muscular functions and of sensory afferences regulating postural control (15). Therefore, to avoid potential effects on performances due to dehydration, subjects were instructed to drink water ad libitum during before and during the experimental sessions. Dependent variables used for further analysis were the time (s) spent by the motion marker (MM) inside the target zone (TZ), which represents the time the subject spent on the platform keeping it flat at 0°, and normalized maximum reach distances (%) for WB balance and YBT performances respectively. Copyright ª 2018 National Strength and Conditioning Association
5
Subjects Thirty-nine (18 females, 21 males) physically active (engaging in at least 3-day·week-1 of moderate-to-intense physical activity) young adults (age: 23.3 ± 2.1 years) volunteered to participate in the study (carried out from March to June 2015). Anthropometric characteristics are presented in Table 1. Subjects were informed of the benefits and risks of the investigation
D
prior to sign an informed consent document to participate in the study approved by the University’s Institutional Review Board. Subjects were excluded if they reported any pre-
TE
existing limitation such as neurological condition, musculoskeletal injury of the back or lower extremities or any other disorder which might influence their balance ability.
C EP
Insert Table 1 about here
Procedures
Before starting the testing sessions, anthropometrical parameters as height, body mass and leg length for each subject were measured. Subjects’ body mass and height were measured by
C
means of a scale with integrated stadiometer with a precision of 0.1kg and 0.1cm (Seca, model 709, Vogel & Halke, Hamburg, Germany). Leg length was measured from the anterior
A
superior iliac spine to the most distal part of the medial malleolus by using a tape measure while the subject laid in the supine position (1). Leg dominance was determined by asking
each subject the favorite foot to kick a ball (32). The computerized WB WSP (Balance Board WSP, GSJ Service, Rome, Italy) used for this study was a proprioceptive platform equipped by a triaxial accelerometer (Phidget Spatial 0/0/3 Basic 1041, Phidgets Inc. 2016, Calgary, Canada). The triaxial accelerometer is internally calibrated and can measure ±8g's (±78m·s-2) per axis and both dynamic (change in velocity) and static (gravity vector) acceleration. Based on the tri-axial accelerometer in the Copyright ª 2018 National Strength and Conditioning Association
6
hemisphere, the WB (40cm diameter wooden board with plastic coated surface, with a half plastic sphere with 6cm height and 20cm diameter as BoS – maximal tilt angle = 20°) relays tilt angle data of the platform at 200Hz through USB cable to a computer via proprietary software. During each experimental session, the WB was interfaced with a laptop using a custom-written software (GSJ Service, software WSP) and calibrated in accordance with the
D
manufacturer’s recommendations. The proprietary software provided a screen (resolution = 1920x1080) showing a MM (diameter = 6mm), a TZ (diameter = 6.5cm) portrayed by a circle
TE
which represented the 0° tilt angle measured by the tri-axial accelerometer and a countdown of the trial. The boundaries of the TZ and the MM were standard for all the subjects during the tests. Prior to start the WB test and retest sessions, each subject had a 3-minute free
C EP
familiarization period with the WB with a 1-minute sitting rest in between. Subjects were asked to stand barefoot on the WB in a single leg position, by adopting a comfortable and central foot position, knee slightly bent and keeping their hands on their hips. They were asked to focus on the MM displayed on the monitor (placed at eye level and 2m from the subject) in front of them trying to keep the MM inside the TZ as long as they could. The aim was to keep the board flat (0° tilt) as still as possible and for as long as possible within the
C
recording period. The test consisted of 3 attempts of 30-seconds per limb with a 1-minute sitting rest in between. The starting limb was randomly chosen. Data were collected for each
A
limb and the average of both limbs values was also computed. The YBT was performed during session 2 according to the protocol (29). The subjects started
with 6 practice trials in each direction, anterior (A), postero-medial (PM), and postero-lateral (PL), before they underwent the official YBT testing, consisting of 3 testing trials for each direction and limb. To avoid any balance and stability provided by shoes, all testing and practice trials were performed barefoot. The order of the practice trials and formal tests were randomly assigned and counterbalanced across subjects. Copyright ª 2018 National Strength and Conditioning Association
7
During each trial, subjects were instructed to reach as far as they could by using their reach foot and returning to the starting point while maintaining their balance on the contralateral leg in a single limb stance with hands on the hips. The maximum reach distance was recorded to the nearest 0.5cm in each reach trial. According to the protocol (29), if an invalid trial occurred (i.e., the subjects did not return to the initial position, failed to keep a single stance,
D
stepped on the reaching leg, or removed the hands from the hips), the data were discarded, and the subject repeated the trial. The maximum reach distances of the 3 testing trials in each
TE
direction per limb in relation to leg dominancy were used for further analysis. The reach distances were normalized to each subject’s leg length by dividing the reach distance by limb length and then multiplying by 100. Furthermore, normalized composite reach distance was
C EP
calculated for each limb as the sum of the maximum reach distances in the 3 directions (A, PM, PL), divided by 3 times the limb length, and then multiplied by 100. YBT values were then averaged between limbs to obtain a single performance. Statistical Analysis
Data normal distribution was verified by the Shapiro-Wilk test and means and standard
C
deviations (SD) calculated for all variables.
ICC and 95% confidence interval (95% CI), which represents a ratio of actual score variance
A
to overall variance, were used to investigate the intrasession and intersession reliability of the WB measures. Here, a two-way mixed model was employed to calculate ICCs and investigate the intrasession and intersession reliability as this model assesses only the reliability of the measurements by considering subjects as random effects and the measurement tool as a fixed effect (36). ICC [3,1], estimating correlations between individual measurements, and ICC [3,3], estimating correlations between average measurements on the
Copyright ª 2018 National Strength and Conditioning Association
8
same target, were respectively applied. ICC values were interpreted (36) as poor (0.00-0.39), fair (0.40-0.59), good (0.60-0.74) and excellent (0.75-1.00). Standard error of measurement (SEM) and the minimal detectable change (MDC95) were also computed. SEM quantifies the measurement error and points out the within-subject variability, allowing the determination of a range of values within which a true score might
D
fall based on an observed score (36). Low SEM values produce a smaller range around an observed score and therefore indicates better reliability of the test. The SEM was
TE
compounded through the following formula: SEM = SD x √1-ICC.
The MDC95 shows the smallest real change in score on a repeated assessment required to exhibit an actual change in performance. A change score above or equal to the MDC95
C EP
threshold can be interpreted that the change is reliable and real at the 0.95 confidence level. The formula used to calculate the MDC95 is: SEM x √2 x 1.96. The lower SEM and MDC95 depict higher reliability.
To enhance intersession reliability, the magnitude of disagreement between test and retest values were defined and a visual representation provided by plotting the difference in WB
C
balance performance variability measured during the test and retest against their mean, 95% limits of agreement (95% LoA) and Bland-Altman plots were used (3). The 95% LoA
A
represents the degree of error proportional to the mean in the measurements and was calculated as follows: 95% LoA = mean ± 2 SD. To determine changes in a subject’s
performance over a period, the extent of the change has to overcome the inherent variability of the performance outcome. Consequently, the LoA can be used to evaluate the real change in a subject’s performance. If the difference between two measurements is outside the LoA, there is a real change in the subject’s performance.
Copyright ª 2018 National Strength and Conditioning Association
9
To investigate concurrent validity, Pearson product moment correlation was used to assess the strength of the relationships between the WB balance performance and the YBT outcome measures. Pearson correlation coefficients were calculated from WB test and YBT test for each standing limb and both limbs averaged. Correlations were interpreted (6) as inexistent to little (< 0.25), fair (0.25-0.5), moderate (0.5-0.75) and very good to excellent (> 0.75). Data
D
were analyzed using STATA software version 14 (StataCorp LP, College Station, Texas) and the significance level was set at p ≤ 0.05.
TE
RESULTS
Means and SDs of WB test, YBT and WB retest outcomes in relation to limb dominance are reported in Table 2, whereas Table 3 shows WB intrasession and intersession ICCs
C EP
(individual and average), 95% CI, SEM and MDC95 values. ICCs ranged from fair to excellent, SEM demonstrated acceptable levels of error, and MDC95 were rather low.
C
Insert Tables 2 and 3 about here
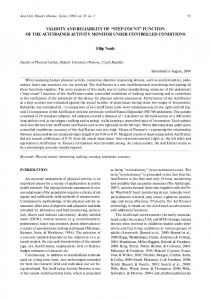
Figure 1 shows the differences between test and retest plotted against their mean and 95%
A
LoA for each condition, whereas Pearson product moment correlations are reported in Table 4.
Insert Figure 1 and Table 4 about here
Copyright ª 2018 National Strength and Conditioning Association
10
DISCUSSION The purposes of this study were to determine the intrasession and intersession reliability and concurrent validity of a computerized WB during single limb standing assessment. The main findings were that i) the computerized WB showed from fair to excellent reliability; and ii) poor levels of correlation emerged between WB and YBT. In particular, low variability was
D
found, with SEM values low and consistent between test and retest, and MDC95 values showing that the computerized WB would be able to determine significant changes in
TE
performance. Findings are in line with the literature (4,24,26,37) in which good intrasession reliability (ICC ranging from 0.54 to 0.95) and low variability were found during field and laboratory evaluations of single leg balance.
C EP
Although there were some outliers in all conditions, no major systematic bias was found in the Bland-Altman plots with only 2/39 (5.1%) of the subjects outside the LoA (Figure 1C). In line with previous findings in which high retest reliability (ICC ranging from 0.77 to 0.90) were found on a portable electronic balance measuring system in healthy and physically active young individuals (33), the computerized WB used in this study showed an excellent
C
intersession reliability during single limb test. These results suggest that instrumented portable unstable platforms would be a reliable tool for inexpensive and efficient dynamic
A
balance assessments.
The computerized WB used in this study reduces the previous constraints regarding WB balance performance evaluation, without complexity in its use or data interpretation as previous instrumented WBs. In fact, it would increase the difficulty of WB balance performance outcomes’ interpretation to rely on the number of edge contacts (20) by neglecting other performance variables or providing a measure of accuracy as time spent in certain tilt angle bandings and edge in contact (37) during the trials. Therefore, it could be
Copyright ª 2018 National Strength and Conditioning Association
11
speculated that a single WB performance outcome, that highlights the precision of the task (e.g., time spent into the TZ), would describe the WB balance performance in a more specific and precise way. Although the reliability of the computerized WB has been demonstrated, only few significant relationships were found to support the concurrent validity. In particular, the poor levels of
D
correlation found indicate that a WB balance outcome cannot precisely predict a subject’s performance during the YBT and vice versa because the relationship was not strong enough
TE
to consider them interchangeable. Probably, due to the features differences between the two tests, the established measures of dynamic balance taken into consideration might not have been the most pertinent method from which to establish concurrent validity. In fact, by
C EP
considering the definition of postural control as "the act of maintaining, achieving or restoring a state of balance during any posture or activity" (7,31), it can be assumed that both methods are suitable to assess a complex ability as the dynamic balance. Based on the definition of postural control, computerized WB might be a reliable instrument to specifically evaluate the capacity of maintaining and restoring the state of balance, whereas the YBT
C
could be more suitable to assess the capacity of reaching and restoring the dynamic balance performance. Despite both methods reflect different characteristics of the dynamic balance
A
performance, both seem to be valid for their aspects although this cannot be tested by comparing them.
Although meaningful data have been shown during this study, several limitations need to be acknowledged. The sample was limited to young adults and therefore other populations, such as youth, older and pathological ones, should be evaluated to explore possible differences and to determine WB norms for the evaluation of balance.
Copyright ª 2018 National Strength and Conditioning Association
12
Furthermore, as the performance was displayed by means of a software’s screen, this modality might have enhanced the balance performance. Therefore, it should be foreseen whether to use different visual feedbacks or not to assess their influence on WB balance performance (14). Finally, although another limitation could be found in the type of task used (i.e., single limb), it was assumed that this standing position could be more suitable for the
D
WB platform size and WB balance performance assessment. Other stances such as the double leg ones are difficult to be employed on such limited platform size. Additionally, other
TE
features such as the stance width could influence the WB balance performance. Further studies should consider those aspects to better explain the WB balance performance and its characteristics, as well as comparing the computerized WB outcomes with other static and
C EP
dynamic balance tasks to better investigate the concurrent validity. PRACTICAL APPLICATIONS
Since computerized WB are easy to set and simple to interpret, they may have the potential in screening and monitoring subjects’ dynamic balance during large-scale evaluation to objectively quantify balance performance and its progression, bridging the gap between the
C
laboratory experiments and the field settings. Specificity, affordability and transportability of WBs could be key factors making the collection of accurate and precise information on
A
balance performance feasible for coaches, practitioners and health scientists looking for portable, inexpensive, reliable and valid assessment tools. Moreover, findings can be used to better interpret changes after WB and neuromuscular training protocols and balance exercises or detect WB balance deficiencies. From a practical point of view, if a subject’s WB both limbs averaged performance would change of 6.8s or more on a repeated assessment in different days after a training protocol using WB exercises or due to detraining, this change can be interpreted as an actual and
Copyright ª 2018 National Strength and Conditioning Association
13
reliable change in performance. Therefore, the reliable assessment of an athlete’s development in WB balance performance through an intervention can allow adequate and specific adaptations of training measures. Finally, WB data could also be used in cohort studies particularly relevant to monitor the secular trends towards inactivity in western
D
Countries.
TE
Acknowledgments
The authors would like to express their gratitude to subjects involved in the study for their
C EP
committed participation.
References 1.
Alnahdi, AH, Alderaa, AA, Aldali, AZ, and Alsobayel, H. Reference values for the Y Balance Test and the lower extremity functional scale in young healthy adults. J Phys Ther Sci 27: 3917-3921, 2015.
Berg, K and Norman, KE. Functional assessment of balance and gait. Clin Geriatr Med
C
2.
12: 705-23, 1996.
Bland, JM and Altman, D. Statistical methods for assessing agreement between two
A
3.
methods of clinical measurement. Lancet 327: 307-310, 1986.
4.
Clark, RA, Bryant, AL, Pua, Y, McCrory, P, Bennell, K, and Hunt, M. Validity and reliability of the Nintendo Wii Balance Board for assessment of standing balance. Gait Posture, 31: 307-310, 2010.
5.
Clark, VM and Burden, AM. A 4-week wobble board exercise program improved muscle onset latency and perceived stability in individuals with a functionally unstable ankle. Phys Ther Sport 6: 181-187, 2005. Copyright ª 2018 National Strength and Conditioning Association
14
6.
Cohen J. Statistical power analysis. Curr Dir Psychol Sci 1: 98-101, 1992.
7.
D’Anna, C, Schmid, M, Bibbo, D, Bertollo, M, Comani, S, and Conforto, S. The effect of continuous and discretized presentations of concurrent augmented visual biofeedback on postural control in quiet stance. PLoS One 10: 1-15, 2015.
8.
DiStefano, LJ, Clark, MA, and Padua, DA. Evidence supporting balance training in
9.
D
healthy individuals: A systemic review. J Strength Cond Res 23: 2718-2731, 2009. Emery, CA and Meeuwisse, WH. The effectiveness of a neuromuscular prevention
Sports Med 44: 555-562, 2010.
TE
strategy to reduce injuries in youth soccer: A cluster-randomised controlled trial. Br J
10. Emery, CA, Rose, MS, McAllister, JR, and Meeuwisse, WH. A prevention strategy to
C EP
reduce the incidence of injury in high school basketball: A cluster randomized controlled trial. Clin J Sport Med 17: 17-24, 2007.
11. Endo, Y and Sakamoto, M. Correlation of shoulder and elbow injuries with muscle tightness, core stability, and balance by longitudinal measurements in junior high school baseball players. J Phys Ther Sci 26: 689-693, 2014. 12. Endo, Y and Sakamoto, M. Relationship between lower extremity tightness and star
C
excursion balance test performance in junior high school baseball players. J Phys Ther Sci 26: 661-663, 2014.
A
13. Fitzgerald, D, Trakarnratanakul, N, Smyth, B, and Caulfield, B. Effects of a wobble board-based therapeutic exergaming system for balance training on dynamic postural stability and intrinsic motivation levels. J Orthop Sports Phys Ther 40: 11-19, 2010. 14. Fusco, A, Giancotti, GF, Foster, C, Varalda, C, Capranica, L, and Cortis, C. Effect of visual biofeedback on wobble board balance performance in relation to gender. J Curr Res Sport Ahead of Print Dec 15, 2017.
Copyright ª 2018 National Strength and Conditioning Association
15
15. Gauchard, GC, Gangloff, P, Vouriot, A, Mallie, JP, and Perrin, PP. Effects of exerciseinduced fatigue with and without hydration on static postural control in adult human subjects. Int J Neurosci 112: 1191-1206, 2002. 16. Gribble, PA, Hertel, J, and Plisky, P. Using the Star Excursion Balance Test to assess dynamic postural-control deficits and outcomes in lower extremity injury: A literature
D
and systematic review. J Athl Train 47: 339-357, 2012. 17. Gribble, PA, Tucker, WS, and White, PA. Time-of-day influences on static and
TE
dynamic postural control. J Athl Train 42: 35-41, 2007.
18. Guskiewicz, KM and Perrin, DH. Research and clinical applications of assessing balance. J Sport Rehabil 5: 45-63, 1996.
C EP
19. Haas, BM and Burden, AM. Validity of weight distribution and sway measurements of the Balance Performance Monitor. Physiother Res Int 5: 19-32, 2000. 20. Hamer, P, Munt, A, Harris, C, and James, N. The influence of ankle strapping on wobble board performance before and after exercise. Aust J Physiother 38: 85-92, 1992.
21. Hertel, J, Miller, SJ, and Denegar, CR. Intratester and intertester reliability during the
C
Star Excursion Balance Tests. J Sport Rehabil 9: 104-116, 2000. 22. Irrgang, JJ, Whitney, S, and Cox, E. Balance and proprioceptive training for
A
rehabilitation of the lower extremity. J Sport Rehabil 3: 68-83, 1994.
23. Karime, A, Al-Osman, H, Alja’am, J, Gueaieb, W, and Saddik, A. Tele-wobble: A telerehabilitation wobble board for lower extremity therapy. IEEE Trans Instrum Meas 61: 1816-1824, 2012. 24. Kinzey, SJ and Armstrong, CW. The reliability of the star-excursion test in assessing dynamic balance. J Orthop Sports Phy Ther 27: 356-360 1998.
Copyright ª 2018 National Strength and Conditioning Association
16
25. Lee, DK, Kim, GM, Ha, SM, and Oh, JS. Correlation of the Y-balance test with lowerlimb strength of adult females. J Phys Ther Sci 26: 641-643, 2014. 26. Muehlbauer, T, Roth, R, Mueller, S, and Granacher, U. Intra and intersession reliability of balance measures during one-leg standing in young adults. J Strength Cond Res 25: 2228-2234, 2011.
D
27. Ogaya, S, Ikezoe, T, Soda, N, and Ichihashi, N. Effects of balance training using wobble boards in the elderly. J Strength Cond Res 25: 2616-2622, 2011.
TE
28. Onigbinde, AT, Awotidebe, T, and Awosika, H. Effect of 6 weeks wobble board exercises on static and dynamic balance of stroke survivors. Technol Health Care 17: 387-392, 2009.
C EP
29. Plisky, PJ, Gorman, PP, Butler, RJ, Kiesel, KB, Underwood, FB, and Elkins, B. The reliability of an instrumented device for measuring components of the star excursion balance test. N Am J Sports Phys Ther 4: 92-99, 2009.
30. Plisky, PJ, Rauh, MJ, Kaminski, TW, and Underwood, FB. Star Excursion Balance Test as a predictor of lower extremity injury in high school basketball players. J Orthop Sports Phys Ther 36(12): 911-919, 2006.
C
31. Pollock, AS, Durward, BR, Rowe, PJ, and Paul, JP. What is balance? Clin Rehabil 14: 402-406, 2000.
A
32. Salmaso, D and Longoni, AM. Problems in the assessment of hand preference. Cortex 21:533-549, 1985.
33. Šarabon, N, Mlaker, B, and Markovic, G. A novel tool for the assessment of dynamic balance in healthy individuals. Gait Posture 31: 261-264, 2010. 34. Shaffer, SW, Teyhen, DS, Lorenson, CL, Warren, RL, Koreerat, CM, Straseske, CA, and Childs, JD. Y-balance test: A reliability study involving multiple raters. Mil Med 178: 1264-1270, 2013.
Copyright ª 2018 National Strength and Conditioning Association
17
35. Thorpe, JL and Ebersole, KT. Unilateral balance performance in female collegiate soccer athletes. J Strength Cond Res 22: 1429-1433, 2008. 36. Weir, JP. Quantifying test-retest reliability using the intraclass correlation coefficient and the SEM. J Strength Cond Res 19: 231-240, 2005. 37. Williams, J and Bentman, S. An investigation into the reliability and variability of
D
wobble board performance in a healthy population using the SMARTwobble instrumented wobble board. Phys Ther Sport 15: 143-147, 2014.
Prog Technol 16: 31-51, 1990.
TE
38. Winter, DA, Patla, AE, and Frank, JS. Assessment of balance control in humans. Med
39. Woollacott, MH and Tang, PF. Balance control during walking in the older adult:
C EP
research and its implications. Phys Ther 77: 646-660, 1997.
40. Yim-Chiplis, PK and Talbot, LA. Defining and measuring balance in adults. Biol Res Nurs 1: 321-331, 2000.
41. Zech, A, Hubscher, M, Vogt, L, Banzer, W, Hansel, F, and Pfeifer, K. Balance training for neuromuscular control and performance enhancement: A systematic review. J Athl
C
Train 45: 392-403, 2010.
A
Legend to Figures
Figure 1. Figure 1. Bland-Altman Plot for A) Dominant Limb, B) Non-Dominant Lim, and C) Average in wobble board performances. Difference between wobble board test and wobble board retest scores is plotted against the mean of the respective measurements. Dot lines indicate the average of the differences, whereas the grey box indicate the 95% limits of agreement.
Copyright ª 2018 National Strength and Conditioning Association
18
Tables legend Table 1. Means and standard deviations of the subjects’ characteristics.
Table 2. Means and standard deviations of wobble board (WB) test, wobble board retest and
D
Y Balance Test (YBT) performances.
TE
Table 3. Individual and average intrasession and intersession Intraclass Correlation
Coefficient (ICC) with 95% Confidence Interval (95% CI), standard error of measurement
C EP
(SEM) and minimal detectable change (MDC95) during wobble board balance performances.
Table 4. Pearson product moment correlation values between wobble board balance test and
A
C
Y Balance Test performances for dominant, non-dominant limb and average values.
Copyright ª 2018 National Strength and Conditioning Association
Table 1. Means and standard deviations of the subjects’ characteristics. Female (n=18)
Male (n=21)
Total (N=39)
Age (years)
22.8 ± 1.4
23.7 ± 2.6
23.3 ± 2.1
Weight (kg)
58.8 ± 11.4
71.9 ± 8.4
65.9 ± 11.8
Height (cm)
161.1 ± 5.3
174.2 ± 6.3
168.2 ± 8.8
Lower limbs length (cm)
74.6 ± 4.1
82.4 ± 4.3
78.8 ± 5.7
-2
22.6 ± 3.8
23.7 ± 2.8
23.2 ± 2.1
BMI (kg·m )
A
C
C EP
TE
D
BMI: Body Mass Index
Copyright ª 2018 National Strength and Conditioning Association
Table 2. Means and standard deviations of wobble board (WB) test, wobble board retest and Y Balance Test (YBT) performances. WB Test (s)
WB Retest (s)
A-YBT (%)
PM-YBT (%)
PL-YBT (%)
C-YBT (%)
Dominant limb
18.4 ± 6.2
20.2 ± 5.9
86.0 ± 9.7
95.6 ± 13.8
99.9 ± 14.0
98.6 ± 11.3
Non-dominant limb
19.1 ± 6.0
21.0 ± 6.2
87.8 ± 9.2
96.0 ± 13.7
102.4 ± 14.0
99.5 ± 9.8
Average
18.7 ± 6.1
20.6 ± 6.1
86.9 ± 9.5
95.8 ± 13.7
101.1 ± 14.0
99.1 ± 10.2
Condition
A
C
C EP
TE
D
A-YBT: anterior Y balance test; PM-YBT: postero-medial Y balance test; PL-YBT: postero-lateral Y balance test; C-YBT: composite Y balance test.
Copyright ª 2018 National Strength and Conditioning Association
Table 3. Individual and average intrasession and intersession Intraclass Correlation Coefficient (ICC) with 95% Confidence Interval (95% CI), standard error of measurement (SEM) and minimal detectable change (MDC95) during wobble board balance performances.
Test
Retest
Condition Dominant limb
ICC (CI 95%) 0.47 (0.28 - 0.65)
Individual SEM 4.5
Non-dominant limb
0.56 (0.38 - 0.72)
4.0
Average
0.50 (0.36 - 0.64)
4.3
Dominant limb
0.63 (0.46 - 0.77)
3.6
Non-dominant limb
0.53 (0.34 - 0.70)
4.3
Average
0.57 (0.44 - 0.71)
4.0
Dominant limb
0.48 (0.20 - 0.69)
4.3
Non-dominant limb
0.52 (0.25 - 0.72)
4.2
Average
0.72 (0.52 - 0.84)
3.2
MDC95 8.9
11.0
0.79 (0.65 - 0.88)
2.7
7.6
11.9
0.85 (0.77 - 0.92)
2.3
6.4
MDC95 12.4
9.9
0.84 (0.72 - 0.91)
2.4
6.6
11.8
0.77 (0.61 - 0.87)
3.0
8.2
11.0
0.89 (0.82 - 0.93)
2.0
5.6
12.0
0.65 (0.33 - 0.82)
3.6
9.9
11.7
0.68 (0.40 - 0.83)
3.4
9.5
8.9
0.84 (0.69 - 0.91)
2.5
6.8
A
C
C EP
Intersession
ICC (CI 95%) 0.73 (0.53 - 0.85)
Average SEM 3.2
TE D
Intrasession
Copyright ª 2018 National Strength and Conditioning Association
Table 4. Pearson product moment correlation values between wobble board balance test and Y Balance Test performances for dominant, non-dominant limb and average values.
Wobble Board Test Non-dominant limb
p 0.09 0.96 0.57 0.01*
r -0.05 0.13 -0.01 -0.07
r -0.04 -0.19 -0.12 0.26
p 0.79 0.26 0.47 0.11
0.12 0.02 -0.03 0.33
0.45 0.89 0.84 0.04*
-0.15 0.12 -0.07 0.02
0.37 0.47 0.66 0.90
-0.23 -0.16 -0.23 0.23
0.15 0.33 0.15 0.14
0.32 0.44 0.32 0.38
0.05* 0.05* 0.05* 0.02*
-0.06 0.03 0.06 -0.03
0.73 0.86 0.70 0.87
0.24 0.34 0.21 0.26
0.14 0.03* 0.20 0.11
D
p 0.75 0.44 0.97 0.68
Average
r 0.27 -0.01 0.09 0.41
C EP
Dominant limb Anterior Postero-medial Postero-lateral Composite Non-dominant limb Anterior Postero-medial Postero-lateral Composite Average Anterior Postero-medial Postero-lateral Composite
Dominant limb
TE
Y Balance Test
A
C
* denotes significant differences (p