DYNAMIC COMPACTION – INSIGHTS FROM LABORATORY TESTS David Airey1,a , Yahya Nazhat1 , Richard Moyle2 and Derek Avalle3 1 School
of Civil Engineering, University of Sydney, NSW 2006, Australia. E-mail: a
[email protected] 2 Coffey Geotechnics, 89–91 Burswood Road, Burswood WA 6100, Australia. E-mail:
[email protected] 3 Keller Ground Engineering, PO Box 7974, Baulkham Hills NSW 1755, Australia. E-mail:
[email protected]
The depth and extent of ground improvement from dynamic compaction often has to be assessed from site specific preliminary field tests as there is limited understanding of the fundamental mechanics involved. This paper will present data from a laboratory study in which high speed photography has been used to explore the deformation mechanisms in simple 2-D model experiments. The effect of soil type and relative density, and pounder geometry will be shown. Insights from these laboratory tests are used to explore some of the observations from a large scale application of dynamic compaction in western Sydney, where the underlying ground conditions were unknown and highly variable. Results will be presented to show the extent and degree of ground improvement and how this varied across the site. Insights from the laboratory tests are also used to explore some observations from rolling dynamic compaction at two sites.
Keywords: Dynamic compaction, Deformation mechanisms, Laboratory tests, Field tests. 1. INTRODUCTION
Ground improvement is a fundamental and essential part of civil construction and comprises approximately 30 different methods of ground treatment, including modification, chemical alteration, reinforcement with steel or geosynthetics, strengthening by drainage, densification by vibration or consolidation and the use of electro-osmosis (Phear & Harris, 2008). Of these, compaction is by far the most frequent and involves increasing the density of the ground by means of mechanically applied energy such as static compaction which employs drum, sheepsfoot and tyre rollers or dynamic compaction which makes uses of vibratory rollers and plates, rammers, heavy tamping, vibroflotation and rolling dynamic compaction (Hausmann, 1990). The advantage of dynamic compaction (DC) is that it enables the ground to be improved to a much greater depth, (>10 m as compared to 0.3 m for static compaction), with the depth of improvement depending on the energy applied (Mayne et al., 1984). When compared to other ground improvement techniques dynamic compaction is one of the most cost effective (Lukas, 1995), but its use is limited
Proceedings of the International Conference on Ground Improvement and Ground Control Edited by Buddhima Indraratna, Cholachat Rujikiatkamjorn and Jayan S. Vinod Copyright © 2012 by Research Publishing Services. All rights reserved. ISBN: 978-981-07-3560-9 :: doi:10.3850/978-981-07-3560-9 04-0041
987
988
Proceedings of the International Conference on Ground Improvement and Ground Control
by the large ground vibrations it induces so that it is not suitable on small sites or adjacent to buildings and other infrastructure. The majority of the research into dynamic compaction has been derived from field studies with heavy tamping, where tampers of 4 to 20 t have been dropped from cranes distances of 10 to 30 m (Menard and Broise, 1975; Mayne et al., 1984; Chow et al., 1994; Rollins et al., 1994; Lukas, 1995; Bo et al., 2009). Although this technique is now widely used, assessment of the depth and extent of the ground improvement continues to be difficult to predict and costly field trials are generally required. Laboratory scale tests have been conducted at 1 g and in the centrifuge (Poran and Rodriguez, 1992; Oshima and Takada, 1994; Merrifield and Davies, 2000; Jafarzadeh, 2006; Feng et al., 2000; Arslan et al., 2007) but these have generally been confined to dry sand. Attempts to model dynamic compaction numerically have evolved from adaptation of 1-D wave equation (Chow et al., 1992) with soil response represented by springs and dampers, to more sophisticated 2-D analyses using more realistic soil models and including coupled hydro-mechanical effects (Poran and Rodriguez, 1992; Pan and Selby, 2001; Gu and Lee, 2002; Ghassemi et al., 2010). These laboratory and numerical models have provided some insights into the soil response, but a comprehensive predictive model which can address the effects of soil parameters including: the initial void ratio; the initial moisture content; depth of water table; soil grading; plasticity; Poisson’s ratio; cementation; and soil structure, has proved elusive (Berry et al., 2000). Clearly, the size of the zone influenced by DC, the effects of different tamper geometries and the influence of soil properties on the mechanics of the DC process itself, are not well understood. One of the reasons for this ongoing debate is the difficulty of observing and measuring the dynamic behaviour of the underlying target soils, and this has provided the motivation for the laboratory study described below. 2. LABORATORY TESTS
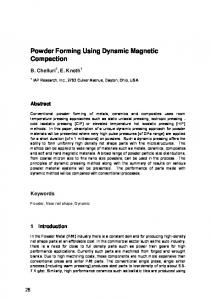
Laboratory tests have been performed to explore the sub-surface soil response during model plane strain DC experiments. These have made use of high speed photography and digital image correlation (DIC) techniques to investigate the deformation patterns, calculate soil strains and observe strain localisation. The testing apparatus, shown in Figure 1, consists of a fabricated container fixed to a steel frame open at the top with a clear acrylic (Perspex) front. The metal frame extends to a height of 2.8 m above the floor with a fixed pulley system resting on an axle positioned at the top of the frame. The internal dimensions of the soil container are 350 mm × 150 mm × 750 mm. A Figure 1. Dynamic compaction test setup. 25 mm thick Perspex sheet is bolted to the front of the frame. A thinner, replaceable, 5 mm sheet of Perspex was placed between the sand and the front face to prevent scratching and damage of the main Perspex sheet. The frame is separated from the floor by rubber pads to prevent vibrations being transmitted through the laboratory floor to the camera. The high
Dynamic Compaction – Insights from Laboratory Tests
989
speed camera is mounted on a tripod placed on the floor and positioned 1.2 m from the testing apparatus. The field of view of the 1024 × 1024 pixel image is 403 mm × 403 mm giving an object space pixel size of 0.39 mm. Further details of the photographic technique are provided in Nazhat et al. (2011). The guiding trolley and attached plunger are able to free fall up to 1 m, although in most tests discussed here drop heights ranged between 150 mm and 300 mm. In some tests the pulley system has been replaced by an electromechanical motor and gearbox mounted on a steel frame affixed to the container platform. The gearbox and motor allows the tamper, and the 25 mm diameter shaft connected to it, to be lifted to a pre-specified height at which the gearbox clutch is engaged allowing the freefall of the tamper and shaft. The switch operating the clutch is also used to synchronise the activation of the high speed camera. The weight of the free falling assembly ranged from 50 N to 180 N, depending on the width of the tamper which varied between 35 mm and 110 mm. The tamper depth was equal to that of the container to ensure a 2-D configuration. A typical test has involved 5 to 8 drops of the tamper, with high speed photography taken over 3.2 seconds for each drop. The test programme has included tests of dry Sydney sand at different relative densities, tests to investigate the effect of adding non-plastic fines to the sand, tests to investigate the effect of degree of saturation, and tests to investigate the effect of tamper geometry. The soils used have been Sydney sand, which has the properties d50 = 0.3 mm, cu = 3, emax = 0.8, emin = 0.58, and non-plastic feldspar fines which has been mixed with the sand to form a 2:1 sand:silt mixture with properties d50 = 0.2 mm, cu = 22, emax = 0.89, emin = 0.51. 2.1. Results 2.1.1. Mechanism of Dynamic Compaction
The displacement vectors after six drops of the tamper onto initially loose sand with an initial relative density of 0.2 are shown in Figure 2. In the upper part of the sand the deformation pattern consists of a general bearing capacity type mechanism with the soil pushed sideways and upwards. Most of the soil deformation takes part in this region, but little if any densification is expected and if the soil is initially dense, the soil would be expected to loosen. This loosening of the soil near the surface is well known during heavy tamping and leads to special ironing procedures being used with lighter tamping to densify the upper soil. It can be seen from Figure 2 that this region extends to just below the base of the tamper. However, the primary interest in heavy tamping is the densification of the soil below the tamper. From Figure 2 it appears that there is a gradual reduction in displacement with distance from the plunger. This is consistent with standard interpretations of dynamic compaction which assume that a stress wave passes through the soil leading to soil densification. Accelerometers buried in the sand confirmed that a stress wave passes through the soil, and accelerations diminish with distance from the tamper. However, the high speed photographs show that the stress wave is not the primary cause of the soil densification. They indicate that the densification occurs as a result of a series of shock or compaction bands that propagate through the sand, starting from just below the tamper base.
990
Proceedings of the International Conference on Ground Improvement and Ground Control
Figure 2. Typical results for loose sand: (a) Cumulative displacement vectors after 6 impacts; and (b) incremental vectors for a time of 0.001 s from 0.009 s after the first impact.
Figure 2b shows the incremental displacements between successive photographs at 0.009 and 0.01 seconds after the plunger has impacted the soil surface. The figure shows that deformation beneath the plunger is concentrated in a series of bands between which there is no significant displacement. By looking at the sequence of photographs it can be seen that the compaction bands move through the soil at a velocity of about 20 m/s, (tamper impact velocity = 2. 4 m/s) gradually slowing down and eventually coming to a stop some distance from the tamper. As a result of this process the displacements do not diminish steadily with depth below the tamper as expected. Also these bands can still be detected in the cumulative displacement vectors at the end of the series of drops, and most of the volumetric compression beneath the tamper is concentrated and locked in these bands. By refining the displacement analysis in the region beneath the plunger the shear and volumetric strains can be evaluated as shown in Figure 3. Figure 3a shows the cumulative shear strains after 6 drops of the tamper, while Figure 3b shows the associated cumulative volume strains. The similarity of Figure 3 with the incremental displacement in Figure 2b is clear, and is surprising given that one picture is incremental and the other cumulative from the moment of impact. The reason for the absence of shear and volume strain after the shear band has passed is that positive strains in front of the band are counteracted by negative strains behind it, so that the net effect on the soil after the compaction band has passed is negligible. Although the bands move down through the soil, at any time significant compaction can only be observed in the compaction/shear bands, and no measurable densification can be detected in the region through which the bands have propagated. With further impacts additional compaction/shear bands are formed which propagate down, through the existing bands, beneath the plunger, leading to the numerous shear strain bands shown in Figure 3a. A similar pattern is obtained for the volumetric strain shown in Figure 3b. Figure 3 shows that continued blows have created additional compaction bands which have filled in the region beneath the plunger, but there are still regions between these bands where little densification has occurred. Only six blows were possible due to experimental limitations, but it can be speculated that more blows, such as are routinely used in practice, will result in shear bands filling in much of the space between the plunger and the furthest shear band. One of the limitations of using dry sand was that the sand collapsed behind the tamper, and when the tamper was removed for a subsequent
Dynamic Compaction – Insights from Laboratory Tests
991
Figure 3. (a) Shear strains and (b) volumetric strains after 6 tamper impacts for initially loose sand.
drop a region of loosened sand filled in the crater so created. It is believed that this may have limited the depth of the affected region. The mechanism and patterns of behaviour shown in these photographs have been observed in all the compaction tests on Sydney sand using a flat based tamper, irrespective of relative density. However, significant differences in mechanism were observed when silt was added to the sand and when the shape of the tamper base was varied. The effects of these on the heave measured at the surface, the depth of penetration of the tamper and the volume strain are discussed briefly below. 2.1.2. Effects of Relative Density
Tests on dry sand with relative densities between 15% and 90% have been conducted. The variation of penetration depth with number of drops is shown in Figure 4. As expected the penetration in the initial drop is much greater for the loose sand and increases with energy of impact, however, as further drops are carried out the penetration reaches a limiting value. This is related to the collapse of the dry sand into the void created by the tamper, both immediately following the impact and then as the tamper is pulled out of the sand. This creates a zone of loosened sand which the tamper penetrates each blow. Although this results in the depth of penetration reaching a limiting value, each impact generates new compaction bands which pass through the soil beneath the tamper and contributes to the densification of the underlying soil. Slightly greater surface heave was observed for the initially loose sand, and this heave occurred further from the tamper than for the dense sand. It may be noted that the magnitude and extent of heaving cannot be used with great confidence to gauge the amount of densification as the global volumetric compressive strain was greater for loose sand despite the loose sand heaving more. 2.1.3. Effects of Fines Content
The pattern of shear strains after 6 drops is shown in Figure 5 for a silt-sand mixture with a relative density of 0.45. Comparison of this figure with Figure 3a shows that there is a significant difference in the mechanism. For the silt-sand mixture the general bearing capacity mechanism is largely absent, little soil heave is evident, and the soil is predominantly pushed ahead of the impacting tamper. The penetration into the silt-sand mixture is nearly double the penetration into the sand with a similar relative density.
992
Proceedings of the International Conference on Ground Improvement and Ground Control
Figure 4. Effects of sand relative density and tamper energy on penetration.
Figure 5. Shear strain pattern after 6 impacts for a sand-silt mixture.
Figure 6. a) Tamper shapes, and (b) Effects of tamper shape on volume change.
2.1.4. Effects of Tamper Geometry
Tests have been conducted with four different tamper shapes, shown in Figure 6a. It has been found that the tamper shape has a significant effect on the underlying mechanism and thus on the effectiveness of dynamic compaction, and this effect varies with the soil properties (Nazhat & Airey, 2012). Figure 6b shows the relative effectiveness of the different tamper shapes for loose sand and the 2:1 sand-silt mixture. The global volumetric strain shown in Figure 6b represents the change in volume of all the soil contained within the test tank. This includes the soil near the surface which is loosened and the soil at depth which is unaffected. Thus the values indicated of between 0.1% and 1.3% are likely to be significantly less than the volumetric compression occurring beneath the tamper. It can also be seen from Figure 6b that no single tamper shape provides a consistently good performance as soil type varies. For sand the depth of penetration was not significantly affected by the tamper geometry with a variation of about 15%. However, for the sand-silt mixture, the non flat tampers achieved nearly double the penetration of the flat tamper.
Dynamic Compaction – Insights from Laboratory Tests
993
3. HEAVY TAMPING – FIELD STUDY
Dynamic compaction of soil was examined as part of a full scale dynamic compaction trial, which involved dropping a flat-bottom 20 tonne weight from a height of 23 m. The dynamic compaction process was undertaken in an interlocking grid in three passes with the resultant grid spacing being 4.5 m between drop locations. 3.1. Site Information
The site consisted of 15 m of fill overlying shale bedrock. The fill comprised various mixtures of silt, sand and clay that had been excavated from alluvial deposits and had been placed with different construction methods (using scrapers; or with truck dumping and spreading). Perched groundwater occurred at various locations within the fill; however the general groundwater regime was located at approximately the interface between the soil and shale (i.e. 15 m below the ground surface level). 3.2. Depth of Influence
Extensometers were located midway between the tamper drop points to monitor the subsurface settlement profile as a result of the dynamic compaction process. A typical result is shown in Figure 7. Although the ground conditions were variable, similar patterns in ground response were observed in all the extensometer results. That is a zone of heave near the surface and a zone of compression at depth extending down to the hard shale. The magnitude of the heave recorded, the amount of compression recorded and the depth of influence of dynamic compaction were generally related to the initial relative density of the soil profile. The general pattern was consistent with the results of the laboratory tests, in that there were bearing capacity type movements at the ground surface level and extending down to just past the depth of penetration; overlying a zone that was compacted. A summary table is provided showing the results of the extensometer monitoring in the different construction areas.
Figure 7. Typical extensometer data.
994
Proceedings of the International Conference on Ground Improvement and Ground Control
Table 1. Summary of Field Trials.
Heave (mm) Average Heave Strain Maximum Settlement Average Volumetric Strain Depth of Influence
Scraper Placed Fill
Truck Placed Fill
40 mm−147 mm 2.87% 14 mm−96 mm 0.35% 11.6 m
110 mm−617 mm 7.95% 14 mm−136 mm 0.62% 9.6 m
The results presented in the table above are comparable to the results of the laboratory testing. For example; in the areas where truck dumping and spreading was adopted, average vertical strains of 0.62% were recorded from the extensometers located mid-way between the tamping locations, whereas in the laboratory testing of Sydney sand of low relative density, vertical strains of about 4% were measured in the compacted zone under the tamper. It was found that the crater (print) and heave volumes could provide indicators of the success of dynamic compaction in this field study (Moyle and Redman, 2009). However, results from the laboratory tests suggest that the relative amounts of print and heave volumes are strongly related to the characteristics of the soil at the surface, and thus these quantities are unlikely to provide reliable general indicators. 4. ROLLING DYNAMIC COMPACTION
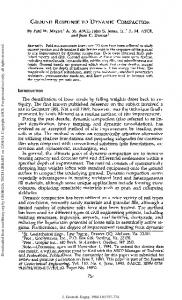
Rolling dynamic compaction (RDC) is a specific type of dynamic compaction which involves towing heavy (6–12 t) non-circular modules with 3, 4 or 5 sides, which rotate about a corner and fall to impact the ground. RDC has become more popular in recent years because it is able to compact the ground more effectively, i.e. to greater depths than its static and vibrating roller counterparts, and more efficiently because of its greater speed −12 km/h compared with 4 km/h using traditional rollers (Pinard, 1999). Due to the combination of kinetic and potential energies, and the large mass of the module, RDC has demonstrated compactive effort to more than 3 m in some soils (Avalle and Carter 2005; Hillman et al., 2007), which is far deeper than conventional static or vibratory rolling (Clegg and Berrang´e, 1971; Clifford, 1976), which is generally limited to depths of less than 0.5 m. In addition, RDC is unique in that it is able to compact large areas of open ground at depth, both effectively and efficiently. As a result, it has been used successfully in large reclamation projects (Avsar et al., 2006; Avalle, 2007), in the compaction of sites with un-engineered fill, such as industrial land or “brownfield” sites; in the agricultural sector to reduce water loss (Avalle, 2004b), and in the mining sector to improve haul roads and tailings dams, as well as in general civil construction works (Avalle, 2004a), and for highway rehabilitation (Jumo and Geldenhuys, 2004). The depth effects due to RDC vary depending on the soil type, amongst other variables (Bierbaum et al., 2010). Examples of the range of improvement effects are shown in the following figures. Figure 8a shows several meters of improvement at a site where calcareous sands were end-dumped and then impact rolled on a reclamation site (Avalle, 2007). Figure 8b shows the results of RDC from a refuse tip that was capped and then improved for the development of residential housing (Bouazza and Avalle, 2006).
Dynamic Compaction – Insights from Laboratory Tests
qc (MPa) 0
10
Shear Wave Velocity, Vs (m/s) 20
30
0
2
-1
4
-2
6 Pre-Compaction
Depth (m)
Depth (m)
0
8
995
0
100
200
300
400
Pre-Compaction Post-Compaction
-3 -4
Post-Compaction
10
-5
12
-6
Figure 8. (a) Example of CPT output during impact roller trial at Port Coogee, WA., (b) Deep improvement by RDC on a landfill site in Melbourne.
These two cases show the large difference in effect that can occur with soil type. For the sand the response is consistent with the laboratory experiments in showing loosening near the surface and densification at depth. For the clay the effect of RDC is limited to the upper 1 m and there is no evidence of any loosening, suggesting a different mechanism is involved. In view of the large number of variables, which include the shape and mass of the impact module, the soil types and condition, groundwater and soil moisture conditions, the speed of the towing unit, surface material, etc, there is a need for more scientific field and laboratory studies to assess the mechanism and depth of the improvement gained from RDC. ACKNOWLEDGMENTS
This work has been supported through the ARC Discovery grant scheme. REFERENCES 1. Arslan, H., Baykal, G. and Ertas, O. (2007). “Influence of tamper weight shape on dynamic Compaction” Ground Improvement 11, No. 2, 61–66. 2. Avalle, D.L. (2004a). “Ground Improvement using the ‘Square’ Impact Roller – Case Studies. ”Proc. 5th International Conference on Ground Improvement Techniques, Kuala Lumpur, 101–108. 3. Avalle, D.L. (2004b). “Use of the impact Roller to Reduce Agricultural Water Loss. ”Proc. 9th Australia New Zealand Conf. on Geomechanics, Auckland, pp. 513–518. 4. Avalle, D. (2007) “Trials and validation of deep compaction using the “square” impact roller. ”Australian Geomechanics Society, Sydney Chapter Symposium. 5. Avalle, D.L. and Carter, J.P. (2005). Evaluating the improvement from impact rolling on sand. Proc. 6th Int. Conf. on Ground Improvement Techniques, Coimbra, Portugal, 8pp. 6. Avsar, S., Bakker, M., Bartholomeeusen, G. and Vanmechelen, J. “Six sigma quality improvement of compaction at the New Doha International Airport project.” Terra et Aqua, No. 103, pp. 14–22. 7. Berry, A., Visser, A. T. and Rust, E. (2000). “State of the Art Review of the Prediction of Ground Improvement Using Impact Compaction Equipment”, South African Transport Conference ‘Action in Transport for the New Millennium’ South Africa. 8. Bierbaum, T.C., Lane, R.A., Piotto, J.L. and Treloar, T.J. (2010). “The influence Zone of the Impact Roller” Technical Note, pp. 12–1 to 12–6. 9. Bo, M.W., Na, Y.M., Arulrajah, A. and Chang, M.F. (2009). Densification of granular soil by dynamic compaction, Ground Improvement, 162, G13, 121–132.
996
Proceedings of the International Conference on Ground Improvement and Ground Control
10. Bouazza, A. and Avalle D.L. (2006). “Verification of the effects of rolling dynamic compaction using a continuous surface wave system. ”Australian Geomechanics, Vol. 41, No. 2, pp. 101–108. 11. Chow, Y. K., Yong, D.M., Yong, K.Y. and Lee, S.L., (1994) “Dynamic Compaction of Loose Granular Soils: Effect of Print Spacing” Journal of Geotechnical Engineering, Vol. 120, No. 7, pp 1115–1133. 12. Clegg, B. and Berrang´e, A.R. (1971). The Development and Testing of an Impact Roller. The Civil Engineer in South Africa, 13(3), 65–73. 13. Clifford, J.M. (1976). Impact Rolling and Construction Techniques. Proc. ARRB Conf., Vol. 8, 21–29. 14. Feng, T.W., Chen, K.H., Su, Y.T. and Shi, Y.C. (2000). Laboratory Investigation of Efficiency of Conical Based Pounders for Dynamic Compaction, Geotechnique 50(6), 667–674. 15. Ghassemi, A., Pak, A. and Shahir, H. (2010). Numerical study of the coupled hydro-mechanical effects in dynamic compaction of saturated granular soils, Computers and Geotechnics, 37, 10–24. 16. Gu, Q. and Lee, F. H. (2002). “Ground response to dynamic compaction of dry sand. ”Geotechnique, 52 (7), pp 481–493. 17. Hausmann, M. R. (1990). Engineering Principles of Ground Modification, McGraw-Hill, New York. 18. Hillman, M., Tan, E. and Mocke, R. (2007). “Advanced Geotechnical Modeling and Monitoring for the Port Coogee Project.” Coasts & Ports Conference, Melbourne. 19. Jafarzadeh, F. (2006). “Dynamic Compaction Method in Physical Model Tests” Scientia Iranica; 13(2): pp. 187–192. 20. Jumo, I. and Geldenhuys, J. (2004). Impact compaction of subgrades-experience on the transkalahari highway including continuous impact response (CIR) as a method of quality control, Proc. 8th Conf. On Asphalt Pavements for Southern Africa, paper 19. 21. Lukas, R.G. (1995). Dynamic Compaction, Geotechnical engineering circular No 1, Report, FHWA-SA-95-037. 22. Menard, L. and Broise, Y. (1975). “Theoretical and practical aspects of dynamic consolidation”, Geotechnique, 25, pp. 3–18. 23. Mayne, P.W, Jones, J.S. and Dumas, J.C. (1984). Ground response to Dynamic Compaction. Journal of Geotechnical Engineering, ASCE, Vol. 110, 6, 757–774. 24. Merrifield, C.M. and Davies, M.C.R. (2000). A study of low-energy dynamic compaction: field trials and centrifuge modeling, Geotechnique, 50, 6, 675–681. 25. Moyle, R. and Redman, P. G. (2009). “Optimization of Dynamic Compaction Processes – A Case Study”, Ground Improvement Technologies and Case Histories, Singapore, 739–746. 26. Nazhat, Y. and Airey, D.W. (2011). Applications of high speed photography and X-ray computerised tomography (Micro CT) in dynamic compaction tests, Proc IS-Seoul. 27. Nazhat, Y. and Airey, D.W. (2012). The effect of different tamper geometries on the dynamic compaction of soils, Proc. IS-GI, Brussels, May. 28. Oshima, A. and Takada, N. (1994) “Effect of ram momentum on compaction by heavy tamping”, International Conference on Soil Mechanics & Foundation Engineering, 13(3), pp 1141–1144. 29. Pan, J.L. and Selby, A.R. (2001). Analysis of dynamic compaction of loose soils under impact loads. Proceedings of 4th International Conf. on recent advances in Geotechnical Earthquake Engineering and Soil Dynamics. Sandiego, California, March 26–28, 2001. 30. Phear, A. G. and Harris, S. J. (2008). Contributions to G´eotechnique 1948–2008: Ground improvement. G´eotechnique, 58(5): 399–404. 31. Pinard, M.I. (1999). Innovative Developments in Compaction Technology Using High Energy Impact Compactors. Proc. 8th Australia New Zealand Conference on Geomechanics, Hobart, Vol. 2, 775–781. 32. Poran, C.J. and Rodriguez, J.A. (1992). “Design of dynamic compaction”, Canadian Geotechnical Journal, 29(5), pp. 796–802. 33. Rollins, K.M., Jorgensen, S.J. and Ross, T.E. (1998). Optimum moisture content for dynamic compaction of collapsible soils, J. of Geotechnical and Geoenvrionmental Engineering, 124, 8, 699–708. 34. Varaskin, S. (1981). Recent development in soil improvement techniques and their practical applications. Solcompact Sols/Soils, 38/39-1981, Techniques Louis Menard, 15, rue des Sablons, Paris.