7526 • The Journal of Neuroscience, June 10, 2009 • 29(23):7526 –7539
Behavioral/Systems/Cognitive
Dynamic Encoding of Responses and Outcomes by Neurons in Medial Prefrontal Cortex Chung-Hay Luk2 and Jonathan D. Wallis1,2 1
Department of Psychology and 2Helen Wills Neuroscience Institute, University of California at Berkeley, Berkeley, California 94720-3190
Medial prefrontal cortex (MPFC) and lateral prefrontal cortex (LPFC) both contribute to goal-directed behavior, but their precise role remains unclear. Several lines of evidence suggest that MPFC is more important than LPFC for outcome-guided response selection. To examine this, we trained two subjects to perform a task that required them to monitor the specific outcome associated with a specific response on a trial-by-trial basis. While the subjects performed this task, we recorded the electrical activity of single neurons simultaneously from MPFC and LPFC. There were marked differences in the neuronal properties of these two areas. Neurons encoding the response were present in both areas, but in MPFC, there were also neurons that encoded the outcome. In particular, neurons encoded the subject’s intended response and how preferable the received outcome was. Thus, only in MPFC was all the information necessary to solve the task encoded. In addition, largely separate populations of MPFC neurons encoded the response and the outcome. Neurons encoding the outcome were in the anterior parts of MPFC: posterior to the corpus callosum, there was a marked drop in their incidence. Our results suggest differences in the contribution of MPFC and LPFC to action control. MPFC neurons encode the desirability of the outcome produced by a specific response on a trial-by-trial basis. This capability may contribute to several of the functions of MPFC, such as action valuation, error detection, and decision making.
Introduction Two regions of frontal cortex are particularly implicated in goaldirected behavior: lateral prefrontal cortex (LPFC) and medial prefrontal cortex (MPFC). Both regions have strong connections with motor areas (Dum and Strick, 1993; Carmichael and Price, 1995b; Petrides and Pandya, 1999) and are activated by tasks requiring high-level cognition (Duncan and Owen, 2000). Several studies implicate MPFC in the control of behavior via response– outcome (RO) associations. Lesions of MPFC impair the ability to use outcome information to guide behavior (Balleine and Dickinson, 1998; Hadland et al., 2003) and reduce the influence of past reward history on motor selection (Kennerley et al., 2006). MPFC neurons tend to encode both rewards and the actions that led to the rewards (Matsumoto et al., 2003; Williams et al., 2004). The involvement of LPFC in RO learning is less clear since studies of LPFC lesions in the primate typically focus on cognitive tasks, such as those underpinning working memory (Funahashi et al., 1993; Petrides, 1995) or rule learning (Halsband and Passingham, 1982; Petrides, 1982; Gaffan et al., 2002). From an anatomical perspective, whereas MPFC strongly connects with areas processing reward, such as the amygdala, orbitofrontal cortex, and insular cortex, LPFC only weakly connects Received Jan. 23, 2009; revised May 8, 2009; accepted May 12, 2009. This project was funded by National Institute on Drug Abuse Grant R01DA19028 and National Institute of Neurological Disorders and Stroke Grant P01NS040813. We thank Steven Kennerley and Antonio Lara for their comments on an earlier version of this manuscript. Both authors contributed to all aspects of the project. The authors declare no competing financial interests. Correspondence should be addressed to Jonathan D. Wallis, 132 Barker Hall, Berkeley, CA 94720-3190. E-mail:
[email protected]. DOI:10.1523/JNEUROSCI.0386-09.2009 Copyright © 2009 Society for Neuroscience 0270-6474/09/297526-14$15.00/0
with these areas (Carmichael and Price, 1995a, 1996; Cipolloni and Pandya, 1999). Studies directly contrasting the neuronal properties of LPFC and MPFC showed that the latter is more important for encoding RO associations (Matsumoto et al., 2003, 2007). However, in these tasks the outcome is the presence or absence of reward. Thus, it is difficult to determine whether the neurons are encoding an association between a specific response and a specific outcome, or whether the neuronal activity is reflective of a more general cognitive process such as assessing the success or failure of an action (Brown and Braver, 2005; Modirrousta and Fellows, 2008). To distinguish between these possibilities, we used a task that required monitoring which of multiple possible outcomes occurred following a specific response. In addition, tasks in which reward-related contingencies are continually changing have found strong encoding of rewards and actions in LPFC (Barraclough et al., 2004; Seo et al., 2007). This is consistent with the notion that LPFC is most implicated in cognitive control when contingencies change on a trial-by-trial basis necessitating flexible, online control (Miller and Cohen, 2001; Rossi et al., 2007). Thus, we trained two subjects to perform a task that required them to associate a particular outcome with a particular response on a trial-by-trial basis, while we recorded the activity of single neurons from MPFC and LPFC simultaneously. In summary, by having multiple potential outcomes associated with a response, we aimed to test whether MPFC neurons encoded specific RO associations, and by constantly changing these contingencies on a trial-by-trial basis, we aimed to tax online control, thereby providing a stronger test of whether LPFC neurons encode RO information. We predicted that even under
Luk and Wallis • Response–Outcome Encoding in Medial Prefrontal Cortex
these conditions, MPFC neurons would show a stronger encoding of RO information than LPFC neurons.
Materials and Methods Subjects and neurophysiological procedures. Subjects were two male rhesus monkeys (Macaca mulatta) 5 years of age and weighing 7–10 kg at the time of recording. We regulated the daily fluid intake of our subjects to maintain motivation on the task. Our methods for neurophysiological recording have been reported in detail previously (Wallis and Miller, 2003). Briefly, we implanted both subjects with a head positioner for restraint and a recording chamber over the left hemisphere, the position of which was determined using a 1.5 T magnetic resonance imaging (MRI) scanner. We recorded simultaneously from MPFC and LPFC using arrays of 8 –14 tungsten microelectrodes (FHC Instruments). We determined the approximate distance to lower the electrodes from the MRI images and advanced the electrodes using custom-built, manual microdrives until they were located just above the cell layer. We then slowly lowered the electrodes into the cell layer until we obtained a neuronal waveform. We randomly sampled neurons; we did not attempt to select neurons based on responsiveness. This procedure aimed to reduce any bias in our estimate of neuronal activity thereby allowing a fairer comparison of neuronal properties between the different brain regions. Waveforms were digitized and analyzed off-line (Plexon Instruments). All procedures were in accord with the National Institute of Health guidelines and the recommendations of the University of California at Berkeley Animal Care and Use Committee. We reconstructed our recording locations by measuring the position of the recording chambers using stereotactic methods. We plotted the positions onto the MRI sections using commercial graphics software (Adobe Illustrator). We confirmed the correspondence between the MRI sections and our recording chambers by mapping the position of sulci and gray and white matter boundaries using neurophysiological recordings. We traced and measured the distance of each recording location along the cortical surface from the lip of the ventral bank of the principal sulcus. We also measured the positions of the other sulci in this way, allowing the construction of the unfolded cortical maps shown in Figure 9. Behavioral task. Each trial consisted of a sampling phase and a choice phase. During the sampling phase, the subject made two sample responses, each of which resulted in the delivery of a small drop of one of three juices. During the choice phase, the subject then chose to repeat one of the responses, and received a larger amount of the juice that was associated with that response earlier in the trial. Thus, to receive juices that are more preferable at the choice phase of the task, the subject had to remember which response produced which outcome during the sample phases of the task. The RO contingencies changed on a trial-by-trial basis. All possible pairings were equally likely to occur, and all juices were equally likely to be paired with either movement. A trial began with the subject fixating a central fixation spot for 1 s (Fig. 1). The subject then made two sample responses by moving a lever, once to the left and once to the right, with a delay separating the two movements. The lever consisted of a 4.5-cm-long sprung joystick handle, which the subject needed to displace laterally by 1.5 cm to register a correct response. We organized trials into blocks of 30 trials each. Depending on the block, the subject’s sample responses had to consist of either a leftward movement followed by a rightward movement, or a rightward movement followed by a leftward movement. A cue presented over the fixation spot indicated to the subject the current block of trials and the time at which to make the movement. We instructed the movements in this way to ensure that during each task epoch we had sufficient conditions of each possible RO association. A 3 s intertrial interval separated each trial. We used NIMH Cortex (http://www.cortex.salk.edu) to control the presentation of the stimuli and the task contingencies. We monitored eye position with an infrared system (ISCAN). Over the course of a trial, the subjects made one of two different types of error. First, their eye position had to remain within ⫾2.5° of the fixation spot until the delivery of the final reward. Otherwise they experienced a 5 s timeout (the screen turned red and the subject had to wait) before the trial resumed from the point at which they had broken fixa-
J. Neurosci., June 10, 2009 • 29(23):7526 –7539 • 7527
tion. Second, at the sample stages of the task, the subjects could make the wrong movement, i.e., making a rightward lever movement when they should have made a leftward movement and vice versa. If this occurred, they experienced a 5 s timeout (the screen turned yellow) and the trial resumed from the point at which the wrong response occurred. We excluded both types of trial from our statistical analysis of the neurophysiological data. We tailored the specific juices to each subject to ensure robust, stable preferences. For subject H, we used orange juice (Minute Maid), apple juice (50% dilution, Safeway), and quinine (1.1 mM, Sigma-Aldrich). For subject J, we used orange juice (50% dilution), apple juice, and quinine (3.3 mM). We note that the quinine solution was sufficiently dilute that it was not aversive: both subjects were willing to drink large quantities (⬎300 ml) of a more concentrated solution of quinine (4.2 mM) from a water bottle. We tailored the quantities of juice to ensure that each subject received their daily aliquot of fluid over the course of a single session. For subject H, the sample juices lasted 0.4 s (0.25 ml) and the final reward amount was 1.1 s (0.68 ml) on 75% of the trials (small reward trials) and 2.1 s (1.3 ml) on 25% of the trials (large reward trials). For subject J, the sample juices lasted 0.3 s (0.19 ml) and the final reward amount was 1 s (0.62 ml) on 75% of the trials and 1.9 s (1.2 ml) on 25% of the trials. The subjects had no way of knowing the volume of the final reward amount until its delivery. Nevertheless, this variation in its size motivated the subject to work for more trials. Statistical methods. We excluded trials in which a break fixation occurred and trials in which the subject moved the lever in the wrong direction during one of the sample responses. We constructed spike density histograms by averaging activity across the appropriate conditions using a sliding window of 100 ms. We quantified neuronal selectivity during the performance of the task using several defined time epochs. We determined these time epochs based on where the most prominent encoding of the response and the outcome was evident in the spike density histograms. The presample epoch consisted of the 800 ms immediately preceding the subject’s first sample response. The first-outcome epoch consisted of an 800 ms period beginning 200 ms after the delivery of the first juice. The 200 ms offset allowed for the latency to encode juice information in frontal cortex (Lara et al., 2009). The second-outcome epoch consisted of the equivalent period after the delivery of the second juice. The prechoice epoch consisted of the 800 ms immediately preceding the subject’s final choice response. We defined two additional epochs at the choice phase of the task. The chosen epoch consisted of an 800 ms period beginning 200 ms after the delivery of the chosen juice, and the small-offset epoch consisted of an 800 ms period beginning 200 ms after the offset of the juice on the small reward trials. For each neuron, we then calculated its mean firing rate during each epoch on every trial. We used statistical tests, assessed using an ␣ level of 0.01, to determine whether the neuron’s mean firing rate depended on the various experimental factors. During the presample epoch, we wished to determine whether neurons encoded the direction of the first sample response. For each neuron, we performed a t test with the neuron’s firing rate during the presample epoch as the dependent variable and whether the first sample response was a leftward or rightward lever movement as the independent variable. We used 2 tests to assess differences between MPFC and LPFC in the proportion of neurons encoding the upcoming sample response. In addition, we calculated a direction index of the strength of encoding by subtracting the neuron’s mean firing rate on trials in which the first sample response was a rightward lever movement from its firing rate on those trials in which the first sample response was a leftward lever movement. We then normalized the resulting value by dividing by the SD of the neuron’s mean firing rate across all trials. For example, a value of 1 on this index would indicate that the firing rate of the neuron was 1 SD higher when the subject intended to make a leftward lever movement than when the subject intended to make a rightward lever movement. To quantify selectivity during the first-outcome epoch, for each neuron we performed a two-way ANOVA with the experimental factors of response (whether the subject had just made a leftward or rightward sample response) and outcome (which of the three juices was delivered). We then classified neurons according to whether they encoded just the response, just the outcome, or a combination of the two. We used 2 tests
Luk and Wallis • Response–Outcome Encoding in Medial Prefrontal Cortex
7528 • J. Neurosci., June 10, 2009 • 29(23):7526 –7539
A Block 1
Block 2 Fixation
Sample 1
Delay 1
(1-s)
Sample 2
Delay 2
(1-s)
Choice
(1-s)
B Behavioral events
Fixation
Sample 1
Delay 1
Response 1 Outcome 1
0
1 presample
Analysis epochs
Sample 2
Choice Choice response Chosen outcome
Response 2 Outcome 2
2
3
first-outcome
(small)
4
(large)
5
6
chosen
second-outcome
Time (s)
7
short-offset
prechoice
C
D 2
% choices inconsistent with preferences
Subject J
Subject H 100
% trials subject chose juice
Delay 2
50
0
1.5
1
0.5
0
Orange
Apple
Orange
Apple
Apple
Orange
vs Apple
vs Quinine
vs Quinine
vs Orange
vs Quinine
vs Quinine
Juice pairing
Subject J
Subject H
1st
2nd
3rd
4th
1st
2nd
3rd
4th
Quarter of session
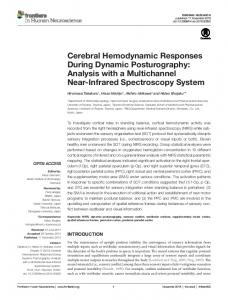
Figure 1. A, Illustration of the sequence of events in the behavioral task. The subject made two lever movements sequentially, indicated by the horizontal arrows, and received one of three juices for each movement. At the choice phase, the subject repeated one of the movements to receive the juice associated with that movement earlier in the trial. The two different blocks consist of trials in which the subject either made a leftward followed by a rightward lever movement or a rightward followed by a leftward lever movement. The block is signaled by a colored square, but this provided no information about the specific RO contingencies. The figure illustrates trials for subject H, who preferred orange juice to apple juice. In the two example trials, subject H receives orange juice for the first movement and apple juice for the second movement and elects to repeat the movement that led to orange juice at the choice phase of the task. B, Timeline indicating the timing of behavioral events during the course of a single trial, as well as the corresponding epochs that we used for statistical analysis. The vertical gray lines indicate the onsets of the visual cues, and the vertical colored lines indicate the time of the subjects’ responses and the delivery of juice. The precise timing of these events depends on how long it takes for the subject to initiate and perform his response. For the purposes of illustration, we used the subjects’ median reaction times. C, Mean percentage of trials within a session in which the subject chose in a manner consistent with his preferences for each of the three potential juice pairings. Subjects rarely made choices that were not consistent with their preferences. D, Mean percentage of trials during each quarter of a session in which the subject chose in a manner inconsistent with his preferences. There was no evidence that the likelihood of an inconsistent choice varied across the course of the recording session. to assess differences in the proportion of selective neurons between the two brain areas. We also used the two-way ANOVA to calculate the strength of selectivity. We did this by calculating the magnitude of our statistical effects using 2. This is equivalent to the percentage of explained variance attributable to a specific experimental factor. We calculate its value by dividing the sum of squares associated with the experimental factor by the total sum of squares in the analysis and multiplying the result by 100%. In addition, for each neuron we calculated the direction index in the same manner as for the presample epoch. During the first-outcome epoch, we also examined the latency at which neurons first began to encode the identity of the juice, by performing a “sliding” ANOVA analysis. For each neuron, we took a 200 ms window of time, beginning 1000 ms before the delivery of the first outcome, and performed a two-way ANOVA on the neuron’s mean firing rate during that window, using the factors of response and outcome. We then calculated the percentage of variance in the neuron’s firing rate that was attributable to the outcome factor. We then moved the window
forward by 10 ms, and repeated the analysis. We continued in this manner until we had analyzed the entire first-outcome epoch. We defined the latency of selectivity as the time when the p value fell below 0.005 for three consecutive time bins. We then compared neuronal latencies between brain areas using Wilcoxon’s rank-sum test. We chose our criterion by comparing the results from the sliding ANOVA analysis for each neuron with the selectivity evident in their spike density histograms. To verify that this criterion resulted in a reasonable rate of type I errors, we examined how many neurons would have reached the criterion in the 500 ms before the delivery of the juice (i.e., when it would have been impossible for the neurons to encode the juice’s identity). Just 5/284 (1.8%) neurons reached criterion in this time, indicating that our choice of criterion indeed yielded a reasonable rate of type I errors. To quantify selectivity during the second outcome, we first separated the trials into three sets depending on the identity of the first outcome. Then, for each neuron and each set of trials in turn, we performed a t test using the neuron’s mean firing rate on each trial as the dependent vari-
Luk and Wallis • Response–Outcome Encoding in Medial Prefrontal Cortex
able and the identity of the second outcome as the independent variable. To examine the time course of this selectivity at the population level, we performed a sliding analysis analogous to our analysis for the first outcome, to quantify the percentage of variance in the neuron’s firing rate that was attributable to the identity of the second outcome. With regard to the choice phase of the task, we analyzed neuronal activity during three epochs. First, we analyzed data during the prechoice epoch in an analogous manner to our analysis of neuronal activity in the presample epoch, although the independent variable on which we focused was the direction of the subject’s choice response. Next, we analyzed data during the chosen epoch. For each neuron, we calculated its mean firing rate during both the chosen and small-offset epochs. For both epochs in turn, we then performed a three-way ANOVA, with the neuron’s mean firing rate as the dependent variable, and juice (whether the chosen juice was the most preferred or intermediately preferred), magnitude (small or large reward trials) and response (whether the subject made a leftward or rightward lever movement to choose the juice) as the independent variables.
Results Behavior Both our subjects exhibited clear preferences between the three available juices throughout recording (Fig. 1C). Subject H preferred orange juice to apple juice, and preferred both juices to quinine. Across 17 sessions, he performed a mean of 429 ⫾ 13 trials, and picked orange juice over apple juice 98 ⫾ 0.6% of the time, apple juice over quinine 98 ⫾ 0.6% of the time, and orange juice over quinine 99 ⫾ 0.2% of the time. Subject J preferred apple juice to orange juice, and preferred both juices to quinine. Across 25 sessions, he performed a mean of 434 ⫾ 10 trials, and picked apple juice over orange juice 96 ⫾ 1.3% of the time, apple juice over quinine 96 ⫾ 1.7% of the time, and orange juice over quinine 85 ⫾ 3.2% of the time. Moreover, both subjects maintained clear preferences across the course of individual recording sessions. We divided each session into quarters and, for each quarter, calculated the proportion of trials in which the subject chose the less preferred reward (Fig. 1D). The percentage of choices that were inconsistent with the subjects’ preferences did not differ between the session quarters for either subject (Kruskal–Wallis one-way ANOVA, p ⬎ 0.1 for both subjects). Neither subject had a response bias during the choice phase: both subjects made leftward movements on 51% of the trials. Thus, both subjects appeared to perform the task as we anticipated: they showed clear preferences between the outcomes, and monitored which outcome occurred following each sample response to ensure that they consistently chose their preferred juice at the choice phase of the task. We excluded two types of errors from our analysis of the neuronal data. The first was when the subject failed to maintain fixation for the duration of the trial. For subject H, 5.0 ⫾ 0.6% of the trials included break fixation errors, while for subject J, 12.5 ⫾ 1.2% of the trials included break fixation errors. The identity of the outcome did not affect the likelihood of a break fixation for either subject in either delay (one-way ANOVA, F ⬍ 1, p ⬎ 0.1 in all cases). The second type of error was when subjects made the wrong movement given the current block of trials. Subject H made wrong movements on 5.3 ⫾ 0.5% of trials, while subject J made wrong movements on 8.4 ⫾ 0.6%. Most of the wrong movements tended to occur on the first trial of a block. For subject H, 47% of his wrong movements occurred on the first trial of the block, while 38% did so for subject J. The remaining wrong movements occurred throughout the remainder of the block. The identity of the juice delivered as the first outcome did not influence the likelihood of making a wrong movement for sampling the second outcome. For subject H, the proportion of
J. Neurosci., June 10, 2009 • 29(23):7526 –7539 • 7529
incorrect movements made in sample 2 was 31 ⫾ 7% following orange juice, 22 ⫾ 7% following apple juice, and 23 ⫾ 7% following quinine. For subject J, the proportion of incorrect movements was 38 ⫾ 5% following apple juice, 23 ⫾ 3% following orange juice, and 35 ⫾ 5% following quinine. These proportions did not significantly differ from one another for either subject (Kruskal–Wallis one-way ANOVA, p ⬎ 0.05 for both subjects). In summary, both subjects performed the task at a high level of accuracy making errors on only a small proportion of trials. For both subjects, the first sample response (H: median 402 ms, J: median 285 ms) was significantly slower than the second sample response (H: median 319 ms, J: median 247 ms, Wilcoxon’s rank-sum test, p ⬍ 1 ⫻ 10 ⫺15 for both subjects). In addition, the second sample response was significantly slower than the choice response (H: median 248 ms, J: median 231 ms, Wilcoxon’s rank-sum test, p ⬍ 1 ⫻ 10 ⫺15 for both subjects). The identity of the first outcome did not affect subsequent reaction times for the second sample response (Kruskal–Wallis one-way ANOVA, p ⬎ 0.1 for both subjects), nor did the identity of the second outcome affect reaction times for the choice response (Kruskal– Wallis one-way ANOVA, p ⬎ 0.1 for both subjects). Thus, the subjects’ responses became quicker as the trial progressed, but the juices that they received did not affect their reaction times. Neurophysiology Comparison of response and outcome encoding across brain areas We recorded from 172 LPFC neurons (H: 77, J: 95) and 112 MPFC neurons (H: 60, J: 52). Our initial characterization of the neuronal response properties focused on the first-outcome epoch. It is in this epoch that the subject learns which outcome is associated with the first sample response. We found that the majority of the neurons encoded either response-related information or information about the reward the subject received for making that response. To quantify this selectivity, for each neuron we performed a two-way ANOVA on the neuron’s mean firing rate on each trial, using the factors of which response the subject made (the leftward or rightward lever movement) and which outcome he received (orange, apple, or quinine). Figure 2 A illustrates an LPFC neuron that showed a significant main effect of response evident as a higher firing rate when the subject had made a rightward as opposed to the leftward response (F(1,427) ⫽ 562, p ⬍ 1 ⫻ 10 ⫺15), but no main effect or interaction with outcome. Figure 2 B illustrates an MPFC neuron that showed a significant main effect of outcome (F(2,392) ⫽ 61, p ⬍ 1 ⫻ 10 ⫺15), but no main effect or interaction with response. The neuron showed its highest firing rate when the subject had just received quinine, a lower firing rate when the subject had received apple juice, and its lowest firing rate when the subject had received orange juice. This neuron was from subject H, and so the neuronal firing rate inversely correlated with the subject’s preferences. Figure 2C illustrates an MPFC neuron that showed a significant interaction between response and outcome (F(2,371) ⫽ 5.0, p ⬍ 0.01). The neuron showed a higher firing rate for apple juice than for orange juice, and a higher firing rate for orange juice than for quinine. This neuron was from subject J, so the neuronal firing rate directly correlated with the subject’s preferences. However, the encoding of the outcome information was stronger when the subject had made a rightward response than for a leftward response. We contrasted the prevalence of these different types of neuronal encoding in LPFC and MPFC. In LPFC, nearly twice as many neurons showed a main effect of response (83/172 or 48%) as showed a main effect of outcome (49/172 or 28%). In contrast,
Luk and Wallis • Response–Outcome Encoding in Medial Prefrontal Cortex
7530 • J. Neurosci., June 10, 2009 • 29(23):7526 –7539 B
C 25
0
0 -0.5
0.5
Time from onset of first outcome (s)
0
Firing rate (Hz)
H0071301
J0062001
0 -0.5
Firing rate (Hz)
25
Firing rate (Hz)
10
0 -0.5
0.5
Time from onset of first outcome (s)
J0231001
A
0
0.5
Time from onset of first outcome (s)
Left then right: Orange
Apple
Quinine
Right then left:
Figure 2. A, Spike density histograms illustrating an LPFC response-selective neuron. The plots are color coded according to which movement the subject made for the first sample response and which juice he received. Time along the x-axis is plotted from the onset of the juice delivery, and the red tick mark indicates the offset of the juice. The gray shading illustrates the extent of the first-outcome epoch that we used for statistical analysis. This neuron had a significantly higher firing during the first-outcome epoch when the subject had made a leftward lever movement, but did not discriminate between the delivery of the three different juices. B, An MPFC neuron that had a higher firing rate to the delivery of quinine than to apple juice and a higher firing rate to apple juice than to orange juice. This neuron was from subject H, and so the neuronal firing rate inversely correlated with the subject’s preferences. The neuron did not discriminate between the different lever movements. C, An MPFC neuron that showed a higher firing rate for apple juice than for orange juice and a higher firing rate for orange juice than for quinine. This neuron was from subject J, and so the neuronal firing rate directly correlated with the subject’s preferences. The encoding of outcome information was stronger when the subject had made a rightward response than when the subject had made a leftward response.
A
B 90
LPFC
C 10
MPFC
MPFC
% firing rate variance explained by factor
% firing rate variance explained by response
% firing rate variance explained by response
90
LPFC
0
% firing rate variance explained by outcome
70
0
70
% firing rate variance explained by outcome
0 Outcome
Response
Figure 3. For each neuron from LPFC (A) and MPFC (B), we plotted the percentage of variance in the neuron’s firing rate during the first-outcome epoch that could be attributable to either the response or outcome factor as determined from a two-way ANOVA. Those neurons whose firing rates showed a significant main effect of one or both of the experimental factors are color coded (red, response only; blue, outcome only; pink, response and outcome). The data points circled in red, blue, and black indicate the data from the neurons illustrated in Figure 2 A–C, respectively. C, Plot of the mean percentage of variance in the LPFC or MPFC neurons’ firing rates that was explainable by either the response or the outcome factor.
in MPFC, more neurons showed a main effect of outcome (67/ 112 or 60%) than showed a main effect of response (52/112 or 46%). Few neurons in either area showed a response ⫻ outcome interaction (LPFC: 20/172 or 12%, MPFC: 10/112 or 9%). A comparison of the proportion of selective neurons between the areas revealed that outcome-selective neurons were significantly more prevalent in MPFC than in LPFC ( 2 ⫽ 26.3, p ⬍ 5 ⫻ 10 ⫺6), while the proportion of response-selective neurons did not significantly differ between the areas ( 2 ⫽ 0, p ⬎ 0.1). We next examined the magnitude of the experimental effects using 2 for each of the experimental factors (see Materials and Methods). For each neuron, this provided us with two selectivity measures: the degree to which the neuron encoded the response and the degree to which the neuron encoded the outcome. We then plotted these two measures against one another (Fig. 3 A, B). This confirmed our findings from the prevalence analysis: the main difference between the two areas was that MPFC encoded both the response and the outcome, whereas LPFC encoded the response alone. We performed a two-way ANOVA using these
selectivity measures as the dependent variable and independent variables of encoding (outcome or response) and area (LPFC or MPFC). There was a significant interaction between the factors (Fig. 3C) (F(1,564) ⫽ 12.7, p ⬍ 0.0005). A post hoc simple effects analysis revealed that there was significantly higher response encoding in LPFC than outcome encoding (F(1,564) ⫽ 19, p ⬍ 0.00005), whereas there was no significant difference in the strength of response and outcome encoding in MPFC (F(1,564) ⫽ 1, p ⬎ 0.1). Furthermore, outcome encoding was significantly higher in MPFC than in LPFC (F(1,564) ⫽ 18, p ⬍ 0.00005), but there was no significant difference in the strength of response encoding between the two areas (F(1,564) ⬍ 1, p ⬎ 0.1). In summary, while LPFC encoded information about the response, only MPFC encoded both pieces of information that were necessary to solve the task, namely the response and the outcome. In addition, the low incidence of neurons showing an interaction between the response and outcome factors, as well as the L-shaped pattern of the scatter in Figure 3B, suggests that the two experimental factors were encoded by separate populations of
Luk and Wallis • Response–Outcome Encoding in Medial Prefrontal Cortex
J. Neurosci., June 10, 2009 • 29(23):7526 –7539 • 7531
performed for the first-outcome epoch. Of the 116 neurons (MPFC: 67, LPFC: 49) that were outcome selective in the firstoutcome epoch, 76 (MPFC: 43, LPFC: 33) MPFC MPFC were also selective during the secondoutcome epoch. However, only 8 of these neurons (MPFC: 6, LPFC: 2) showed the same rank ordering of the outcomes in both epochs. Thus, the neuronal response to the juice did not depend solely on the LPFC LPFC physical properties of the juice, but also 0 0 0 -1 1 2 3 0 1 2 3 -2 -2 -1 depended on the context within the task in Time from onset of first outcome (s) Time from onset of first outcome (s) which the juice occurred. We also examined the time course over Figure 4. A, Time course of selectivity related to encoding the first outcome across the two neuronal populations as determined by the sliding ANOVA analysis. The bold line indicates the mean of the population, while the colored shading indicates the SEM. which neurons encoded outcome inforThe gray shaded bar indicates the extent of the first-outcome epoch that we used for statistical analysis. The left pair of green mation. We performed a sliding two-way vertical lines indicate the mean time across all trials at which the subject acquired fixation (subject H, dark green; subject J, light ANOVA and calculated for each time green). The right pair of green vertical lines indicate the mean time at which the subjects made their response to sample the point the percentage of variance in the second outcome. The horizontal brown bar indicates time points at which the outcome selectivity was significantly stronger in neuron’s firing rate that could be attributMPFC relative to LPFC as determined by a t test. B, Time course of selectivity related to encoding the first response as determined able to the outcome factor (see Materials by the sliding ANOVA analysis. and Methods). Figure 4 A shows that the encoding of the outcome was stronger in MPFC than LPFC. An analysis of the latency at which neurons reached our criteneurons in MPFC. In other words, neurons either strongly enrion for encoding of outcome information revealed that this occoded the outcome or strongly encoded the response but were curred earlier in MPFC (median 360 ms) than in LPFC (median unlikely to encode both factors. Our subsequent analyses focus 520 ms, Wilcoxon’s rank-sum test ⫽ 8855, p ⬍ 0.00005), alon determining more precisely what aspect of the outcome and though our interpretation of this must be tempered by the very response neurons are encoding. weak encoding of outcome information that was present in Specific information encoded by outcome-selective neurons LPFC. To characterize more specifically how the neurons were encoding Previous studies have shown that as a subject becomes satiated outcome information, we began by determining, for each neuwith a specific outcome, the value of that outcome diminishes, ron, its mean firing rate when each of the different outcomes causing changes in the subject’s choice behavior (Balleine and occurred. We then determined the rank order of those means. Dickinson, 1998). Thus, we examined whether there was any There were three different outcomes and consequently six potenevidence that the neuronal responses changed across the course tial rank orderings of those three outcomes. Two of the six posof the session. We divided each session into quarters and repeated sible rank orderings were consistent with the subject’s preferour previous analyses across these quarters. We did not find any ences: either a monotonically increasing or decreasing evidence that encoding of the outcome differed across the course relationship between firing rate and preference. The other four of the session. Across the four quarters, there was no difference in possible rank orderings were not consistent with the subject’s the proportion of neurons that encoded the outcome, the repreferences. In MPFC, 47/67 (70%) of the outcome-selective sponse, or the interaction between the two factors (Fig. 5A) ( 2, neurons encoded the outcomes in a manner consistent with the p ⬎ 0.1 for both areas and all comparisons). Nor was there a subject’s preferences, which was significantly greater than the difference between the quarters in the proportion of outcome⫺9 one-third expected by chance (binomial test, p ⬍ 1 ⫻ 10 ). In selective neurons that encoded the outcome in a manner that was LPFC, a similar proportion of outcome-selective neurons enconsistent with the subjects’ preferences (Fig. 5B) ( 2, p ⬎ 0.1 for coded the outcome in a manner consistent with the subject’s all comparisons). Finally, there was no difference in the mean preferences (28/49 or 57%, binomial test, p ⬍ 0.0005). In other strength encoding of the outcome across the session as deterwords, despite consistent orderings making up only one-third of mined by calculating the percentage of variance in neuronal firthe possible orderings, approximately two thirds of the neurons ing rates attributable to the identity of the outcome (Fig. 5C). encoded the outcomes in a manner consistent with the subject’s Thus, there was no evidence for any change in the neuronal enpreferences. Of these neurons, there was a tendency to show a coding of the outcome across the course of the session. This was negative relationship between the subject’s preferences and their consistent with the lack of any behavioral change (Fig. 1C), which firing rate (MPFC: 32/47 or 68%, binomial test, p ⬍ 0.005, LPFC: might suggest that our subjects were not fully sated on any of the 23/28 or 82%, binomial test, p ⬍ 0.0001). In other words, these specific juices by the end of the recording session. neurons tended to show their highest firing rate to the least preIn summary, MPFC neurons showed stronger encoding of the ferred juice and their lowest firing rate to the most preferred juice. three different juice outcomes. The nature of this encoding was We confirmed that the neuronal selectivity was not a simple consistent with the neurons signaling the value of the juices in sensory response to the juice, by comparing each neuron’s firing terms of the subject’s preferences. Furthermore, the encoding rate during the first- and second-outcome epochs. If the neurons was dynamic, as the neurons did not encode the second juice were encoding the sensory properties of the juice, then their firing outcome in the same way as the first. We examined the encoding rate should show the same rank ordering of the juices in both of the second juice outcome in more detail in subsequent analyses epochs. To determine this, we performed the same analysis of (see below). neuronal activity during the second-outcome epoch as we had
B
14
% firing rate variance explained by response
% firing rate variance explained by outcome
A 14
Luk and Wallis • Response–Outcome Encoding in Medial Prefrontal Cortex
7532 • J. Neurosci., June 10, 2009 • 29(23):7526 –7539 MPFC
LPFC A
Response Outcome Both
% selective neurons
40
*
0
1
2
3
4 * p = 0.04
1
2
3
4
3
4
1
2
3
4
3
4
1
2
3
4
B 20
% selective neurons
Consistent Inconsistent
0
1
C
Response Outcome Both
% firing rate variance explained by factor
12
0
2
1
2
Quarter of session
Quarter of session
Figure 5. A, There was no difference across the quarters of the session ( 2, p ⬎ 0.1 for both areas and all comparisons) in terms of the prevalence of neurons encoding the response, outcome, or the interaction of the two factors. (Although there were significantly fewer responseselective neurons between the second and third quarters in LPFC, this effect did not survive the correction for multiple comparisons.) B, There was no difference across the session in the prevalence of neurons encoding outcome information in a manner that was either consistent or inconsistent with the subjects’ preferences across the course of the session ( 2, p ⬎ 0.1 for all comparisons). C, There was no difference across the session in terms of the strength of outcome selectivity. For each neuron and each quarter in turn, we calculated the percentage of variance in the neuron’s firing rate that could be attributed to either the outcome or the response. We performed a three-way ANOVA using the strength of selectivity as the dependent variable, and quarter, area, and encoding (outcome or response) as independent variables. None of the main effects or interactions with the quarter factor were significant ( p ⬎ 0.1 in all cases), although there was a significant area ⫻ encoding interaction (F(1,2254) ⫽ 43, p ⬍ 1 ⫻ 10 ⫺10), consistent with the interaction shown in Figure 3C.
Specific information encoded by response-selective neurons To determine more precisely what information the responseselective neurons were encoding, we compared the encoding of response information during the first-outcome epoch with the encoding during the presample epoch. Over a third of the neurons showed significant response encoding during the presample epoch, and there was no significant difference between the two areas in the proportion of such neurons (LPFC: 60/172 or 35%, MPFC: 43/112 or 38%, 2 ⬍ 1, p ⬎ 0.1). A comparison of the neuronal selectivity during the presample and first-outcome epochs revealed that neurons appeared to be encoding upcoming motor responses. For example, the neuron in Figure 2 A showed a higher firing rate during the presample epoch on left-then-right trials, and a higher firing rate in the first-outcome epoch on rightthen-left trials. Thus, the neuron showed a higher firing rate whenever the subject intended to make a leftward response. To investigate these effects at the population level, for each neuron and each epoch in turn we calculated a direction index (see Materials and Methods). This index was positive when the neuron showed a higher firing rate for upcoming leftward lever movements and negative when the neuron showed a higher firing
rate for upcoming rightward movements. There was a significant correlation between the value of this measure in the two epochs in both LPFC and MPFC (Fig. 6 A, B). This pattern of results is consistent with neurons encoding the upcoming motor response, with activity during the presample epoch encoding the upcoming first sample response and activity during the first-outcome epoch encoding the upcoming second sample response. We also examined the value of the direction index during the prechoice epoch. If a neuron was encoding the upcoming response during this epoch, then its activity should reflect the direction of the lever movement that the subject intended at the choice phase of the task, in the same way that it encoded the intended first sample response during the presample epoch. Indeed, there was a positive correlation between the direction index in the prechoice and presample epochs in LPFC (Pearson product-moment correlation coefficient, r ⫽ 0.34, p ⬍ 0.00001), although not in MPFC (r ⫽ 0.1, p ⬎ 0.1). However, in both areas response encoding during the prechoice epoch was noticeably weaker than in the presample epoch, with 44/172 (26%) of LPFC neurons and 20/112 (18%) of MPFC neurons encoding the upcoming response. We confirmed this by contrasting the absolute magnitude of the direction index during the presample epoch with that in the prechoice epoch (Fig. 6C). We performed a twoway ANOVA on these index values with the factors of epoch (presample or prechoice) and area (LPFC or MPFC). There was a significant main effect of epoch (F(1,564) ⫽ 15, p ⬍ 0.0005) with no other significant main effects or interactions (F ⬍ 1, p ⬎ 0.1). Thus, the direction index was significantly smaller during the prechoice epoch, and this effect was consistent across both areas. We also examined whether the strength of response encoding at the choice phase depended on the identity of the first outcome. For example, there might be weaker encoding at the choice phase when the first outcome is the most preferred, since the subject could potentially decide their final choice when they receive the first outcome. To examine whether this was the case, we grouped the trials according to the identity of the first outcome and calculated the direction index for each epoch and for each group of trials (Fig. 6 D). We then performed a three-way ANOVA using the direction index values as the dependent variable and epoch (presample or prechoice), area (MPFC or LPFC), and juice (the subject’s preference for the first outcome) as independent variables. This revealed a significant epoch ⫻ juice interaction (F(1,1692) ⫽ 19, p ⬍ 0.00005). A post hoc analysis of the simple effects revealed that direction selectivity was significantly weaker in the prechoice epoch when the first outcome was either the least preferred (F(1,1692) ⫽ 11, p ⬍ 0.005) or the intermediately preferred (F(1,1692) ⫽ 19, p ⬍ 0.00005) outcome, but not when the first outcome was the most preferred (F(1,1692) ⬍ 1, p ⬎ 0.1). Thus, although the subject could potentially make their choice earlier in the trial when the first outcome was the most preferred juice, this did not appear to be what produced weak encoding of the final choice response. We examined the time course of response encoding by performing a sliding two-way ANOVA and calculating for each time point the percentage of variance in the neuron’s firing rate that could be attributable to the response factor (see Materials and Methods). Encoding of the upcoming sample responses began shortly after the presentation of the fixation cue and peaked shortly after the performance of the first sample response (Fig. 4 B). It dropped rapidly once the subject had made the second sample response. The time course of response selectivity in MPFC and LPFC was very similar, although it was slightly stronger in MPFC around the time of the second sample response.
Luk and Wallis • Response–Outcome Encoding in Medial Prefrontal Cortex
J. Neurosci., June 10, 2009 • 29(23):7526 –7539 • 7533
formed three t tests comparing firing rates for (1) apple juice versus quinine (when the first outcome was orange juice), (2) orange juice versus quinine (first outcome was apple juice), and (3) orange juice versus apple juice (first outcome was qui0 0 nine). Significantly more neurons in MPFC than in LPFC showed a significant difference between the two outcomes for at least one of these t tests (MPFC: 71/112 or 63%, LPFC: 53/172 or 31%, 2 ⫽ 28, -2 0 +2 -2 0 +2 p ⬍ 5 ⫻ 10 ⫺6). Direction index during presample epoch Direction index during presample epoch In both areas, the majority of the selective responses (MPFC: 47/71 or 66%, C D LPFC: 44/53 or 83%, binomial test, p ⬍ 0.4 0.4 0.005 in both cases) consisted of a higher LPFC firing rate when the second outcome was the less preferable of the two potential outMPFC LPFC comes (as was the case for all of the neuMPFC rons in Fig. 7). These responses were not simply to the sensory properties of the juice, since the response to the second outFirst outcome: come depended on the identity of the first Intermediately Most preferred Least preferred preferred outcome. For example, the neuron in Fig0 0 ure 7A showed a strong response to quiPrePrePrePrePrePrePresample Prechoice sample sample choice sample choice choice nine when it followed the delivery of apple, Figure 6. For each neuron from LPFC (A) and MPFC (B), we plotted the direction index during the presample and first-outcome but not when it followed the delivery of epochs. The direction index consisted of the normalized difference in the neuron’s firing rate on those trials in which the subject orange. This type of selectivity accounted made a leftward lever movement to sample the first outcome and those in which he made a rightward lever movement. There was for 35/71 (49%) of the MPFC neurons that a significant correlation between the value of this measure in the two epochs in both LPFC (Pearson product-moment correlation encoded the second outcome and 35/53 coefficient, r ⫽ 0.4, p ⬍ 5 ⫻ 10 ⫺7) and MPFC (r ⫽ 0.35, p ⬍ 0.0005). C, Comparison of the mean response selectivity, defined (66%) of the selective LPFC neurons. In as the absolute magnitude of the direction index, in LPFC and MPFC during the presample and prechoice epochs. Response LPFC, the vast majority of these selective selectivity was significantly weaker in the prechoice epoch, and the effect was consistent across both areas. The horizontal dotted responses (34/35 or 97%) occurred when line indicates the chance level of selectivity as calculated via a Monte Carlo analysis. D, Comparison of the mean response the intermediately preferred juice was the selectivity in LPFC and MPFC during the presample and prechoice epochs, separated according to the identity of the first outcome. first outcome. In MPFC, encoding of the Response selectivity was significantly weaker in the prechoice when the first outcome was either the intermediately preferred second outcome was also most prevalent juice or the least preferred juice, but not when it was the most preferred juice. The horizontal dotted line indicates the chance level of selectivity as calculated via a Monte Carlo analysis (the chance level of selectivity was higher than in Fig. 5C, as the analyses were when the intermediately preferred juice was the first outcome (15/35 or 43%), but based on fewer trials, and so the index showed more variability). selective responses also occurred when the first outcome was the most preferred juice In summary, when the subject needed to monitor the out(5/35 or 15%) or the first outcome was the least preferred juice come associated with his response there was strong encoding of (13/35 or 37%). the response in both MPFC and LPFC. In contrast, once the Some neurons appeared to encode a more abstract version of subject had received both the first and second outcome, such that this information. For example, the neuron in Figure 7B consishe could make his choice between them, there was very little tently showed a higher firing rate whenever the less preferred of encoding of the behavioral response that would lead to the final the two possible second outcomes occurred, which for subject H delivery of the reward. This result begs the question as to where in was quinine following orange, quinine following apple, and apple the brain the final choice response is encoded. Although MPFC following quinine. Figure 7C shows an analogous neuron in subappears to be important for encoding response and outcome ject J. Thus, these neurons appeared to encode the relative value information, the final action selection may occur in an area of the two outcomes that could potentially follow the first outdownstream of MPFC. come, regardless of the specific identities of those outcomes. Such responses accounted for 10/71 (14%) of selective MPFC neurons Encoding of outcome information during the second delay Our analysis of the first sample response and its associated outand 2/53 (4%) of LPFC neurons. Of these neurons, the majority come revealed that neither MPFC nor LPFC encoded specific RO showed a higher firing rate to the less preferable outcome, with associations. Furthermore, while both areas encoded the reonly one neuron (in MPFC) showing a higher firing rate to the sponse, a critical difference was that MPFC encoded the value of more preferable outcome. the outcome associated with that response. Finally, some neurons appeared to encode the juice that the We next examined neuronal selectivity during the second subject expected in the choice phase of the task. For example, the sample response. To quantify neuronal selectivity, we first sepaneuron in Figure 7D showed a strong response to quinine followrated the trials into three sets depending on the identity of the first ing apple juice and apple juice following quinine. This neuron outcome. Then, for each set of trials, we determined whether the was from subject H, and these are the two juice combinations neuron’s firing rate was affected by the identity of the two possiwhere he will receive apple juice as his final reward rather than ble second outcomes (see Materials and Methods). Thus, we perorange juice. Such neurons accounted for 17/71 (24%) of the
A
B
LPFC
+2
Direction index
Direction index
Direction index during first-outcome epoch
Direction index during first-outcome epoch
+2
MPFC
Luk and Wallis • Response–Outcome Encoding in Medial Prefrontal Cortex
7534 • J. Neurosci., June 10, 2009 • 29(23):7526 –7539 Left then right:
Orange
Apple
Quinine
Right then left:
A 40
B 40
First outcome: most preferred
40
0 40
0
C
0
First outcome: intermediately preferred
Firing rate (Hz)
Firing rate (Hz)
0 40
0 40
First outcome: least preferred
-0.5
0
0.5
1
0
1.5
D
40
0
0 20
0
0
40
20
% firing rate variance explained by second outcome
E 15
-0.5
0
0.5
1
0
1.5
0
-0.5
0
0.5
1
1.5
1
1.5
1
1.5
20
40
0
-0.5
0.5
F
LPFC
15
MPFC
First outcome: Most preferred Intermediately preferred Least preferred
0
-0.5
0
0.5
1
1.5
0
-0.5
0
0.5
Time from onset of second outcome (s)
Figure 7. Spike density histograms illustrating the firing rate of neurons to the delivery of the second outcome. In each plot, the top panel indicates trials in which the first outcome was the most preferred juice, the middle panel indicates trials in which the first outcome was the intermediately preferred juice, and the bottom panel indicates trials in which the first outcome was the least preferred juice. The colored drop indicates the identity of the first outcome (orange, orange juice; green, apple juice; blue, quinine). The red tick mark indicates the offset of the juice delivery. The gray shading illustrates the second-outcome epoch that we used for statistical analysis. A, An MPFC neuron that had a significantly higher firing rate when the second outcome was quinine, but only when the intermediately preferred reward (apple juice for subject H) was the first outcome. B, An MPFC neuron, recorded from subject H, which showed a higher firing rate to the less preferable of the two potential outcomes that might follow each of the first outcomes. C, Another MPFC neuron that showed a higher firing rate to the less preferable of the two potential outcomes, this time recorded from subject J. D, An MPFC neuron that had a significantly higher firing rate to quinine following apple juice and to apple juice following quinine. In both cases, the subject would receive apple juice for his final choice, and consequently the most likely explanation for this pattern of selectivity is that it reflected the subject’s expectancy of the reward that he would receive for his choice. Time course of selectivity related to encoding the second outcome in LPFC (E) and MPFC (F ), separated according to the identity of the first outcome. The bold line indicates the mean of the population, while the colored shading indicates the SEM. The horizontal colored lines indicate significant differences between the plots as determined by a t test. Orange points indicate a significant difference between the yellow and red plot, green points indicate a significant difference between the yellow and blue plot, and pink points indicate a significant difference between the blue and red plot. For example, the orange points indicate those times when the selectivity for the second outcome was stronger when the first outcome was intermediately preferred (yellow plot) than when the first outcome was the most preferred (red plot).
selective MPFC neurons and 8/53 (15%) of the LPFC neurons. This left just 12/71 (17%) of the selective MPFC neurons and 8/53 (15%) of LPFC neurons whose responses could not be accounted for by one of the above patterns of selectivity. We also examined the time course over which neurons encoded the identity of the second outcome. We performed a sliding one-way ANOVA and calculated for each time point the percentage of variance in the neuron’s firing rate that could be attributable to the identity of the second outcome (Fig. 7 E, F ). The results supported our conclusions from the analysis of the single neuron activity. Encoding of the second outcome was stronger in MPFC than in LPFC, and it was most evident when the first outcome was the intermediately preferred outcome. In MPFC, encoding of the second outcome was also present when the first outcome was either the most or least preferred, but this was not the case in LPFC. In summary, encoding of the second outcome was most prevalent in MPFC. Most neurons appeared to encode the value of the second outcome relative to the first. This signal could take the form of a response to a specific second outcome in the context of a specific first outcome, or it could take a more abstract form in which the neuron responded whenever the less preferable of the two potential outcomes (as indicated by the first outcome) occurred. This was particularly evident when the first outcome was the intermediately preferred juice. It is these trials in which the identity of the second juice is most critical. This is because on half the trials following the intermediately preferred outcome, the second outcome will be less preferable than the first, while on the other half of the trials the second outcome will be more preferable than the first. In addition, they are also the trials in which the difference in value between the two potential outcomes (the most and least preferred outcomes) is greatest. Either or both of these reasons may explain the bias toward encoding the second outcome when it follows the intermediately preferred juice. Encoding of the chosen outcome Our final analysis of neuronal selectivity focused on the responses that occurred when the subject received their chosen outcome. Many neurons encoded the identity of the chosen outcome. For example, the neuron in Figure 8 A showed a higher firing rate when the subject received apple juice than when the subject received orange juice. In addition, on 25% of the trials the subject received a reward that was approximately twice as large as the standard reward size. Many neurons responded differentially depending on the magnitude of the received reward. For example, the neuron in Figure 8 B showed a phasic response at the time of the offset of the small reward, which did not occur when the subject received a large reward. To quantify the prevalence of these different types of neuronal selectivity in our neuronal populations, we performed a threeway ANOVA for each neuron and both the chosen and smalloffset epochs in turn. We used the neuron’s mean firing rate on each trial as the dependent variable and independent variables of juice (whether the subject had chosen the most preferred or intermediately preferred juice), response (whether the subject had made a leftward or rightward lever movement to indicate their choice), and magnitude (small or large reward trials). During the chosen epoch, a small number of neurons in each area showed a main effect of juice or a main effect of response (Fig. 8C). No other main effects or interactions accounted for ⬎3% of the neurons. During the small-offset epoch, the majority of selective neurons encoded the magnitude of the received juice while a smaller
Luk and Wallis • Response–Outcome Encoding in Medial Prefrontal Cortex A
B
Leftward movement
25
J. Neurosci., June 10, 2009 • 29(23):7526 –7539 • 7535
Leftward movement
Large-Orange
50
Small-Orange Large-Apple
0
Rightward movement
0
J0251502
25
0
1
2
Time from onset of chosen outcome (s)
0
Rightward movement 50
H0201501
Firing rate (Hz)
Firing rate (Hz)
Small-Apple
0
0
1
2
3
Time from onset of chosen outcome (s)
C 50
*
% selective neurons
LPFC MPFC
†
0
Magnitude
Juice
Response
Magnitude
Juice
Response
Small-offset epoch
Chosen epoch
E 20
0
Chosen epoch
Small-offset epoch
LPFC MPFC
Firing rate (Hz)
MPFC
0
ou Fir tc stom e Ch os en
Number of neurons
LPFC
ou Fir tc stom e Sm of a fs llet
D 12
Figure 8. A, Spike density histograms illustrating an MPFC neuron that encodes the identity of the chosen juice. The plots are color coded according to the identity and magnitude of the juice reward. The red tick marks illustrate the offset of the small and large juice reward. The dark gray shading illustrates the extent of the chosen epoch, and the light gray shading indicates the extent of the small-offset epoch. This neuron had a significantly higher firing rate when the subject received his preferred juice (apple for subject J) than when he received his intermediately preferred juice. B, An MPFC neuron that fired in response to the offset of the smaller reward. Note that this was not a generic reward offset response, since a similar strong response did not occur to the offset of the large reward. C, Percentage of neurons that encoded either the magnitude of the chosen reward (magnitude), the identity of the chosen reward (juice), or the direction of the behavioral response to select the chosen reward (response). For those neurons encoding the magnitude of the reward, the darker shading indicates the proportion that showed a stronger response to the larger reward. For those encoding the juice, the darker shading indicates the proportion that showed a stronger response to the more preferred juice. For those neurons encoding the response, the darker shading indicates the proportion that showed a stronger response for a leftward movement. The asterisk indicates that the prevalence of encoding the magnitude of the reward was significantly greater in MPFC than in LPFC ( 2, p ⬍ 0.05). The dagger indicates that there were significantly more MPFC neurons that showed a stronger response to the more preferred juice than the less preferred juice (binomial test, p ⬍ 0.05). D, Proportion of neurons that encoded outcome information during both the first-outcome epoch and the choice phase of the task that showed either the same (dark shading) or opposite (light shading) preference among the juices. E, Comparison of the firing rate elicited by the neuron’s preferred juice for those neurons that encoded outcome information during both the sample and choice phases of the task.
population encoded the juice’s identity. The prevalence of neurons encoding the magnitude of the juice was greater in MPFC than LPFC, and MPFC tended to respond more strongly to the most preferred juice. In summary, the identity of the juice and its
magnitude both drove neuronal activity, and the encoding of reward-related parameters was biased toward MPFC. We also examined the relationship between encoding juice information during the sample phase of the task (specifically the first-outcome epoch) and the choice phase of the task (the chosen and small-offset epochs). There was no evidence that neurons that encoded juice information during the first-outcome epoch were any more or less likely to encode juice information during the chosen and small-offset epochs than were neurons that did not encode juice information during the first-outcome epoch ( 2 test, p ⬎ 0.1 in all cases). For those neurons that did encode juice information during both phases of the task, we examined how their selectivity compared. (Too few LPFC neurons encoded juice information at both phases of the task to permit a meaningful statistical test of their response properties, so for this and subsequent analyses, we focused solely on MPFC neurons.) MPFC neurons tended to encode juice information during the choice phase of the task in the opposite direction to how they encoded it during the sampling phase of the task (Fig. 8 D). To ensure sufficient neurons to permit us to examine this statistically, we combined the two groups, i.e., those that encoded juice information during the first-outcome epoch and the chosen epoch, and those that encoded juice information during the first-outcome epoch and the small-offset epoch. (Only one neuron was common to both groups, and our analyses were unaffected by whether we included or excluded this neuron as a member of both groups.) This analysis confirmed that neurons were more likely to switch their juice preference between the sample and choice phases of the task than they were to maintain the same preference (binomial test, p ⬍ 0.05). We also compared the firing rates that were elicited by the juices in the sample and choice phases of the task (Fig. 8 E). For each neuron and each epoch, we calculated the neuron’s preferred juice, defined as the juice that elicited the highest firing rate, and determined how this firing rate compared between those epochs. For those neurons encoding juice in both the first-outcome and chosen epochs, the firing rate to the neuron’s preferred juice was significantly less in the chosen epoch (Wilcoxon signed-rank test, p ⬍ 0.05). In contrast, for those neurons encoding juice in the first-outcome and small-offset epochs, there was no significant difference between the mean firing rates (Wilcoxon signed-rank test, p ⬎ 0.1). In summary, MPFC neurons tended to encode juice preference at the choice phase in the opposite direction to how they encoded this information during the sample phase. In addition, the neurons showed lower firing rates to chosen rewards than to rewards received during the sample phase. Thus, MPFC neurons showed their strongest activity when the subject had to monitor the outcome of a response, as in the sampling phase, or when it was not possible to predict the outcome of the response, as in the small-offset epoch, which is when the subject learned whether he would receive a small or large reward. Functional anatomy within areas Figure 9 illustrates the location of neurons that were response selective and outcome selective during the first-outcome epoch. To determine whether there was a relationship between the incidence of selective neurons and their anterior–posterior position, we performed a logistic regression using whether or not a neuron was selective as the dependent variable and the anterior–posterior position of the recording location as the predictor variable. We did this for each area and each variable (response or outcome) in turn. Response-selective neurons were significantly more prevalent in more posterior recording locations in LPFC
Luk and Wallis • Response–Outcome Encoding in Medial Prefrontal Cortex
7536 • J. Neurosci., June 10, 2009 • 29(23):7526 –7539
Cortical distance from ventral bank of principal sulcus (mm)
( p ⬍ 0.00005). However, there was no reOutcome selective lationship between location and response A B selectivity in MPFC, and no relationship 30 20 Subject H: MPFC Subject J: MPFC between location and outcome selectivity in either area. 40 30 In addition, we have previously reported that neurons encoding the value of 1 5 9 1 5 9 50 40 multiple decision-related parameters are restricted to the anteriormost portion of 20 20 Subject H: LPFC Subject J: LPFC MPFC, with a marked drop-off in the prevalence of such neurons as one moves 15 15 posterior to the genu of the corpus callo10 sum (Kennerley et al., 2009). To examine 10 whether such a functional dissociation ex5 5 isted in the current task, we recorded an 26 28 30 32 20 25 30 additional dataset that focused on the dorAnterior-posterior position (mm) sal bank of the cingulate sulcus posterior to the genu of the corpus callosum (anteroposterior ⫹20 to ⫹23) in subject J. We Response selective recorded 34 neurons from this area (MPFC D Cpostgenual). We treated this as a separate 30 20 Subject H: MPFC Subject J: MPFC dataset: it was not included in our previous analyses. 40 30 Neuronal selectivity in MPFCpostgenual 1 5 9 1 5 9 was markedly different from the anterior 50 40 part of MPFC. During the first-outcome epoch, 28/34 (82%) of the neurons en20 20 Subject H: LPFC Subject J: LPFC coded the response compared with 5/34 15 (15%) that encoded the outcome. When 15 we plotted the magnitude of the experi10 10 mental effects of outcome and response, it was clear that the majority of neurons en5 5 coded the response with little effect of the 26 28 30 32 20 25 30 outcome (Fig. 10 A). To confirm that the Anterior-posterior position (mm) neuronal encoding in MPFCpostgenual was indeed different from our original MPFC Figure 9. Flattened reconstructions of the cortex indicating the location of all recorded neurons (open circles) and outcomedataset, we performed a two-way ANOVA selective neurons (filled circles) in subject H (A) and subject J (B). The size of the circles indicates the number of neurons recorded using the magnitude of the experimental at that location. Red circles indicate neurons recorded from LPFC, blue circles indicate those recorded from MPFC, and green circles effects as the dependent variable and inde- indicates those recorded from MPFCpostgenual. Gray shading indicates the unfolded cingulate sulcus in MPFC and the unfolded principal sulcus in LPFC. We measured the anterior–posterior position from the interaural line (x-axis) and the dorsoventral pendent variables of encoding (outcome position relative to the lip of the ventral bank of the principal sulcus (0 point on y-axis). For ease of viewing, each plot is presented or response) and area (MPFCpostgenual or so that dorsal regions are at the top and ventral regions are at the bottom. C and D indicate the location of response-selective MPFC). There was a significant interac- neurons recorded from subject H and subject J, respectively. tion between the factors (Fig. 10 B) (F(1,288) ⫽ 29, p ⬍ 5 ⫻ 10 ⫺6). A post hoc simple dence that this was the case: selectivity relating to the encoding of effects analysis revealed that there was significantly greater rethe final response did not differ between MPFCpostgenual and the sponse encoding in MPFCpostgenual than outcome encoding original MPFC dataset during the prechoice epoch (Fig. 10 D). ⫺7 (F(1,288) ⫽ 32, p ⬍ 5 ⫻ 10 ). In addition, outcome encoding was We confirmed this by performing a two-way ANOVA on the significantly weaker in MPFCpostgenual than in the original MPFC absolute magnitude of the direction index values with the factors dataset (F(1,288) ⫽ 5, p ⬍ 0.05), and response encoding was sigof epoch (presample or prechoice) and area (MPFCpostgenual or nificantly greater in MPFCpostgenual (F(1,288) ⫽ 29, p ⬍ 5 ⫻ 10 ⫺6). MPFC). There was a significant interaction between the two facThese results supported our previous findings (Kennerley et al., tors (F(1,288) ⫽ 39, p ⬍ 5 ⫻ 10 ⫺8). A post hoc analysis of the simple 2009): in MPFCpostgenual there is a clear decrease in the encoding effects revealed that the direction index was significantly smaller of outcome-related information and a clear increase in the enin the prechoice epoch than in the presample epoch in both areas coding of response-related information relative to more anterior (MPFCpostgenual: F(1,288) ⫽ 91, p ⬍ 1 ⫻ 10 ⫺15, MPFC: F(1,288) ⫽ regions of MPFC. 18, p ⬍ 0.00005). Furthermore, whereas the direction index was To examine the nature of the response selectivity evident in significantly stronger in MPFCpostgenual than our original MPFC MPFCpostgenual, we compared our direction index in the presadataset during the presample epoch (F(1,288) ⫽ 88, p ⬍ 1 ⫻ mple and first-outcome epochs. There was a significant positive 10 ⫺15), there was no difference between the areas in its strength correlation indicative of the neurons encoding the upcoming reduring the prechoice epoch (F ⬍ 1, p ⬎ 0.1). Thus, although sponse (Fig. 10C). The predominance of response selectivity MPFCpostgenual encoded the upcoming response strongly during raised the possibility that MPFCpostgenual might be an area downthe presample epoch, there was little evidence that it was responstream of the anterior regions of MPFC that could be responsible sible for implementing the final choice response. for encoding the final choice response. In fact, there was no evi-
Luk and Wallis • Response–Outcome Encoding in Medial Prefrontal Cortex
J. Neurosci., June 10, 2009 • 29(23):7526 –7539 • 7537
that led to the reward (Matsumoto et al., 2003; Williams et al., 2004). The results of the current study help to define what inMPFCpostgenual formation MPFC encodes. Neurons encoded outcome information in a manner that was consistent with the subjects’ preferences. This supports the idea that MPFC neurons encode outcome information via an abstract value signal (Amiez et al., 2006; Wallis, 2007; Kennerley et al., 2009). In contrast, despite a good deal of focus MPFC on LPFC in the control of goal-directed 0 behavior (Shallice and Burgess, 1991; 0 70 Outcome Response % firing rate variance Duncan et al., 1996; Watanabe, 1996; explained by outcome Miller and Cohen, 2001), it is becoming increasingly apparent that its role in this C+2 D0.9 process is relatively constrained. Neuropsychological studies show that LPFC MPFCpostgenual damage does not impair decision making (Bechara et al., 1998; Fellows, 2006; Fel0 lows and Farah, 2007; Baxter et al., 2008). Neurophysiological studies show that MPFC neurons encode multiple decision MPFC parameters, such as the amount of available juice, the amount of work necessary to 0 -2 0 +2 Presample Prechoice earn the juice or the probability of juice Direction index during delivery, while LPFC neurons show much the presample epoch weaker encoding of such information Figure 10. A, Percentage of variance in MPFCpostgenual neuronal firing rates during the first-outcome epoch that could be (Kennerley et al., 2009). Results from Maattributable to either the response or outcome factor as determined from a two-way ANOVA. Conventions are as in Figure 3. B, Plot tsumoto et al. (2003) have also supported of the mean percentage of variance in MPFCpostgenual or MPFC neuronal firing rates that was explainable by either the response or this conclusion. In a task that required the outcome factor. C, Scatter plot of the direction index values during the presample and first-outcome epochs for every neuron subjects to learn associations between in MPFCpostgenual. There was a significant positive correlation (Pearson product-moment correlation coefficient, r ⫽ 0.55, p ⬍ 0.001) indicative of the neurons encoding the upcoming response. D, Comparison of the mean response selectivity, defined as the stimuli (two different pictures), responses absolute magnitude of the direction index, in MPFCpostgenual and MPFC during the presample and prechoice epochs. The horizontal (holding or releasing a lever), and outcomes (receiving or not receiving a juice dotted line indicates the chance level of selectivity as calculated via a Monte Carlo analysis. reward), MPFC neurons encoded the RO association, while LPFC neurons encoded Discussion the stimulus–response association. Using a task that required subjects to maintain information about In addition, we saw a marked decline in the prevalence of which of three potential outcomes was associated with one of two encoding outcomes in the more posterior parts of MPFC. In a possible responses, we observed marked differences in the propprevious study, we saw a marked decrease in the complexity of the erties of MPFC and LPFC neurons. Whereas both areas encoded encoding of decision parameters in the more posterior MPFC the responses, MPFC neurons also encoded the value of the out(Kennerley et al., 2009). This raises the possibility that the dorsal comes associated with those responses. MPFC neurons encoded bank of the cingulate sulcus anterior to the genu of the corpus the value of the first outcome with respect to the subjects’ prefcallosum is functionally distinct from the more posterior regions erences. They subsequently encoded the value of the second outof the dorsal bank. We note that there is considerable disagreecome relative to the first outcome. This information would be ment regarding the cytoarchitectonic designation of the dorsal sufficient for the subject to determine their choice, but neurons bank of the anterior MPFC, with it variously labeled as area 9 showed much weaker encoding of both responses and outcomes (Vogt et al., 2005), 32 (Petrides and Pandya, 1994), 9/32 (Paxinos during the choice phase of the task, compatible with the notion et al., 2000), or 24b (Carmichael and Price, 1994). Regardless of that PFC is more important for monitoring behaviors than imthe cytoarchitectonic labels, our results highlight the functional plementing them. diversity of the cingulate sulcus. In addition to the anterior/posterior distinction, the dorsal and ventral banks of the cingulate Differential control of action selection by LPFC and MPFC sulcus also appear to be functionally distinct (Hoshi et al., 2005). Our results suggest that MPFC is important for monitoring the These differences in functional anatomy must be considered if we value of an outcome that results from a specific behavioral reare to understand MPFC function (Rushworth et al., 2004). sponse. This conclusion is compatible with recent theories of MPFC function, which suggest this region may be important for The specific nature of response encoding in MPFC valuing actions (Rushworth et al., 2007; Quilodran et al., 2008; Some neurophysiological studies of MPFC find strong encoding Rushworth and Behrens, 2008). For example, MPFC lesions renof behavioral responses (Matsumoto et al., 2003), while others der monkeys unable to sustain rewarded responses in an find little evidence for such encoding (Ito et al., 2003; Matsumoto outcome-guided choice task (Kennerley et al., 2006), while et al., 2007). Our own data seem to suggest that MPFC response MPFC neurons tend to encode both rewards as well as the action encoding is most evident at the point in the trial when the subject % firing rate variance explained by factor Direction index
B
% firing rate variance explained by response
90
Direction index during the first-outcome epoch
A
25
Luk and Wallis • Response–Outcome Encoding in Medial Prefrontal Cortex
7538 • J. Neurosci., June 10, 2009 • 29(23):7526 –7539
must monitor the outcome associated with a response. Those studies that did not observe strong response encoding, may not have required such monitoring, either because a cue instructed which movement to make (Ito et al., 2003) or because the subject could adopt a simple “win-stay, lose-shift” strategy (Matsumoto et al., 2007). A further issue relates to why our study found segregation of neuronal response properties: neurons tended to encode either the outcome or the response but not both. Although similar segregation occurs in the striatum (Lau and Glimcher, 2007), previous studies of MPFC found that neurons integrated response and outcome information (Matsumoto et al., 2003). The segregation that we observed might be a consequence of our task design, since information in our task was only relevant for the current trial. Integration of response and outcome information may only occur when it is necessary to keep track and update an action’s value across multiple trials. Both MPFC and LPFC strongly encoded the responses to sample the outcomes but only weakly encoded the final choice response. These findings are compatible with accounts of prefrontal function that emphasize its role in monitoring behavior, rather than planning and executing responses (Petrides, 1996). They are also consistent with studies that show stronger encoding in both MPFC (Matsumoto et al., 2007; Quilodran et al., 2008) and LPFC (Procyk and Goldman-Rakic, 2006) when a subject is determining which response is rewarded than when they are repeating a known rewarded response. More generally, we can interpret such findings within the framework of exploration (discovering what outcomes are associated with specific responses) versus exploitation (repeating responses that lead to known outcomes), with prefrontal neurons more involved in exploration than exploitation. This raises the question as to whether there is a downstream motor area responsible for implementing the final choice, although our data seem to exclude MPFCpostgenual from such a role. For example, reward-dependent modulation of motor responses increases in progressively downstream motor structures (Roesch and Olson, 2003). Alternatively, exploitation may be a default strategy that exploration must override, with the consequence that neuronal responses to exploration will always be stronger than exploitative responses (Daw et al., 2006). Biased encoding of valence in MPFC Both EEG (Gehring et al., 1993; Miltner et al., 1997) and fMRI (Carter et al., 1998; Ullsperger and von Cramon, 2003; Holroyd et al., 2004) studies have found that MPFC activity is stronger to failures than successes. Our finding that neurons responded more strongly to the less preferable outcomes during both the first- and second-outcome epochs supports this view. This valence bias is the opposite of that reported in other areas involved in value-based decision making, such as orbitofrontal cortex, where neuronal responses were stronger for positive events (Roesch and Olson, 2004). This has prompted some theories to argue that choice behavior involves the integration of benefits from orbitofrontal cortex and costs from MPFC (Cohen et al., 2007). However, such a conceptualization may be overly simplistic. Several studies have found comparable responses in MPFC to successes and failures (Knutson et al., 2000; Holroyd and Coles, 2002; Walton et al., 2004). We previously found an even split between neurons that increased their firing rate as the value of a choice increased compared with those that increased their firing rate as the value of a choice decreased in both MPFC and orbitofrontal cortex (Kennerley et al., 2009). MPFC neurons are equally likely to respond to gains (when a subject was cued that they would receive more juice than expected) and losses (when a sub-
ject learned they would receive less juice than expected) (Sallet et al., 2007). Furthermore, MPFC neurons respond to rewards in a manner that is highly sensitive to the reward context in which they occur (Sallet et al., 2007). For example, the response of an MPFC neuron to a large reward will be larger if it occurs in a block of relatively small rewards versus a block of relatively large rewards. This suggests that MPFC neurons may be relatively susceptible to framing (Tversky and Kahneman, 1981): their response may depend on the context in which the choice is presented. A possible explanation for why we observed larger signals for negative outcomes may be because subjects tend to be overly optimistic about the likelihood of a positive outcome (Miller and Ross, 1975). Thus, our subjects may have hoped for their most preferred juice to occur following a sample, and the MPFC signaled when this did not occur. Conclusion In summary, our results support the notion that MPFC is important for monitoring the value of an outcome produced by a specific behavioral response and highlight the relative lack of outcome encoding in LPFC. These neuronal populations in MPFC could contribute to many of the functions in which MPFC has been implicated, including action valuation, error detection, and decision making.
References Amiez C, Joseph JP, Procyk E (2006) Reward encoding in the monkey anterior cingulate cortex. Cereb Cortex 16:1040 –1055. Balleine BW, Dickinson A (1998) Goal-directed instrumental action: contingency and incentive learning and their cortical substrates. Neuropharmacology 37:407– 419. Barraclough DJ, Conroy ML, Lee D (2004) Prefrontal cortex and decision making in a mixed-strategy game. Nat Neurosci 7:404 – 410. Baxter MG, Gaffan D, Kyriazis DA, Mitchell AS (2008) Dorsolateral prefrontal lesions do not impair tests of scene learning and decision-making that require frontal-temporal interaction. Eur J Neurosci 28:491– 499. Bechara A, Damasio H, Tranel D, Anderson SW (1998) Dissociation of working memory from decision making within the human prefrontal cortex. J Neurosci 18:428 – 437. Brown JW, Braver TS (2005) Learned predictions of error likelihood in the anterior cingulate cortex. Science 307:1118 –1121. Carmichael ST, Price JL (1994) Architectonic subdivision of the orbital and medial prefrontal cortex in the macaque monkey. J Comp Neurol 346:366 – 402. Carmichael ST, Price JL (1995a) Limbic connections of the orbital and medial prefrontal cortex in macaque monkeys. J Comp Neurol 363:615– 641. Carmichael ST, Price JL (1995b) Sensory and premotor connections of the orbital and medial prefrontal cortex of macaque monkeys. J Comp Neurol 363:642– 664. Carmichael ST, Price JL (1996) Connectional networks within the orbital and medial prefrontal cortex of macaque monkeys. J Comp Neurol 371:179 –207. Carter CS, Braver TS, Barch DM, Botvinick MM, Noll D, Cohen JD (1998) Anterior cingulate cortex, error detection, and the online monitoring of performance. Science 280:747–749. Cipolloni PB, Pandya DN (1999) Cortical connections of the frontoparietal opercular areas in the rhesus monkey. J Comp Neurol 403:431– 458. Cohen JD, McClure SM, Yu AJ (2007) Should I stay or should I go? How the human brain manages the trade-off between exploitation and exploration. Philos Trans R Soc Lond B Biol Sci 362:933–942. Daw ND, O’Doherty JP, Dayan P, Seymour B, Dolan RJ (2006) Cortical substrates for exploratory decisions in humans. Nature 441:876 – 879. Dum RP, Strick PL (1993) Cingulate motor areas. In: Neurobiology of cingulate cortex and limbic thalamus: a comprehensive handbook (Vogt BA, Gabriel M, eds), pp 415– 441. Cambridge, MA: Birkhaeuser. Duncan J, Owen AM (2000) Common regions of the human frontal lobe recruited by diverse cognitive demands. Trends Neurosci 23:475– 483. Duncan J, Emslie H, Williams P, Johnson R, Freer C (1996) Intelligence and
Luk and Wallis • Response–Outcome Encoding in Medial Prefrontal Cortex the frontal lobe: the organization of goal-directed behavior. Cogn Psychol 30:257–303. Fellows LK (2006) Deciding how to decide: ventromedial frontal lobe damage affects information acquisition in multi-attribute decision making. Brain 129:944 –952. Fellows LK, Farah MJ (2007) The role of ventromedial prefrontal cortex in decision making: judgment under uncertainty or judgment per se? Cereb Cortex 17:2669 –2674. Funahashi S, Bruce CJ, Goldman-Rakic PS (1993) Dorsolateral prefrontal lesions and oculomotor delayed-response performance: evidence for mnemonic “scotomas.” J Neurosci 13:1479 –1497. Gaffan D, Easton A, Parker A (2002) Interaction of inferior temporal cortex with frontal cortex and basal forebrain: double dissociation in strategy implementation and associative learning. J Neurosci 22:7288 –7296. Gehring WJ, Goss B, Coles MGH, Meyer DE, Donchin E (1993) A neural system for error detection and compensation. Psychol Sci 4:385–390. Hadland KA, Rushworth MF, Gaffan D, Passingham RE (2003) The anterior cingulate and reward-guided selection of actions. J Neurophysiol 89:1161–1164. Halsband U, Passingham R (1982) The role of premotor and parietal cortex in the direction of action. Brain Res 240:368 –372. Holroyd CB, Coles MG (2002) The neural basis of human error processing: reinforcement learning, dopamine, and the error-related negativity. Psychol Rev 109:679 –709. Holroyd CB, Nieuwenhuis S, Yeung N, Nystrom L, Mars RB, Coles MG, Cohen JD (2004) Dorsal anterior cingulate cortex shows fMRI response to internal and external error signals. Nat Neurosci 7:497– 498. Hoshi E, Sawamura H, Tanji J (2005) Neurons in the rostral cingulate motor area monitor multiple phases of visuomotor behavior with modest parametric selectivity. J Neurophysiol 94:640 – 656. Ito S, Stuphorn V, Brown JW, Schall JD (2003) Performance monitoring by the anterior cingulate cortex during saccade countermanding. Science 302:120 –122. Kennerley SW, Walton ME, Behrens TE, Buckley MJ, Rushworth MF (2006) Optimal decision making and the anterior cingulate cortex. Nat Neurosci 9:940 –947. Kennerley SW, Dahmubed AF, Lara AH, Wallis JD (2009) Neurons in the frontal lobe encode the value of multiple decision variables. J Cogn Neurosci 21:1162–1178. Knutson B, Westdorp A, Kaiser E, Hommer D (2000) FMRI visualization of brain activity during a monetary incentive delay task. Neuroimage 12:20 –27. Lara AH, Kennerley SW, Wallis JD (2009) Encoding of gustatory working memory by orbitofrontal neurons. J Neurosci 29:765–774. Lau B, Glimcher PW (2007) Action and outcome encoding in the primate caudate nucleus. J Neurosci 27:14502–14514. Matsumoto K, Suzuki W, Tanaka K (2003) Neuronal correlates of goalbased motor selection in the prefrontal cortex. Science 301:229 –232. Matsumoto M, Matsumoto K, Abe H, Tanaka K (2007) Medial prefrontal cell activity signaling prediction errors of action values. Nat Neurosci 10:647– 656. Miller DT, Ross M (1975) Self-serving biases in the attribution of causality: fact or fiction. Psychol Bull 82:213–225. Miller EK, Cohen JD (2001) An integrative theory of prefrontal cortex function. Annu Rev Neurosci 24:167–202. Miltner WHR, Braun CH, Coles MGH (1997) Event-related brain potentials following incorrect feedback in a time-estimation task: evidence for a “generic” neural system for error detection. J Cogn Neurosci 9:788 –798. Modirrousta M, Fellows LK (2008) Dorsal medial prefrontal cortex plays a necessary role in rapid error prediction in humans. J Neurosci 28:14000 –14005. Paxinos G, Huang X, Toga AW (2000) The rhesus monkey brain in stereotaxic coordinates. San Diego: Academic.
J. Neurosci., June 10, 2009 • 29(23):7526 –7539 • 7539 Petrides M (1982) Motor conditional associative-learning after selective prefrontal lesions in the monkey. Behav Brain Res 5:407– 413. Petrides M (1995) Impairments on nonspatial self-ordered and externally ordered working memory tasks after lesions of the mid-dorsal part of the lateral frontal cortex in the monkey. J Neurosci 15:359 –375. Petrides M (1996) Specialized systems for the processing of mnemonic information within the primate frontal cortex. Philos Trans R Soc Lond B Biol Sci 351:1455–1461; discussion 1461–1462. Petrides M, Pandya DN (1994) Comparative architectonic analysis of the human and macaque frontal cortex. In: Handbook of neuropsychology (Boller F, Grafman J, eds), pp 17–57. New York: Elsevier. Petrides M, Pandya DN (1999) Dorsolateral prefrontal cortex: comparative cytoarchitectonic analysis in the human and the macaque brain and corticocortical connection patterns. Eur J Neurosci 11:1011–1036. Procyk E, Goldman-Rakic PS (2006) Modulation of dorsolateral prefrontal delay activity during self-organized behavior. J Neurosci 26:11313–11323. Quilodran R, Rothe´ M, Procyk E (2008) Behavioral shifts and action valuation in the anterior cingulate cortex. Neuron 57:314 –325. Roesch MR, Olson CR (2003) Impact of expected reward on neuronal activity in prefrontal cortex, frontal and supplementary eye fields and premotor cortex. J Neurophysiol 90:1766 –1789. Roesch MR, Olson CR (2004) Neuronal activity related to reward value and motivation in primate frontal cortex. Science 304:307–310. Rossi AF, Bichot NP, Desimone R, Ungerleider LG (2007) Top down attentional deficits in macaques with lesions of lateral prefrontal cortex. J Neurosci 27:11306 –11314. Rushworth MF, Behrens TE (2008) Choice, uncertainty and value in prefrontal and cingulate cortex. Nat Neurosci 11:389 –397. Rushworth MF, Walton ME, Kennerley SW, Bannerman DM (2004) Action sets and decisions in the medial frontal cortex. Trends Cogn Sci 8:410 – 417. Rushworth MF, Behrens TE, Rudebeck PH, Walton ME (2007) Contrasting roles for cingulate and orbitofrontal cortex in decisions and social behaviour. Trends Cogn Sci 11:168 –176. Sallet J, Quilodran R, Rothe´ M, Vezoli J, Joseph JP, Procyk E (2007) Expectations, gains, and losses in the anterior cingulate cortex. Cogn Affect Behav Neurosci 7:327–336. Seo H, Barraclough DJ, Lee D (2007) Dynamic signals related to choices and outcomes in the dorsolateral prefrontal cortex. Cereb Cortex 17 [Suppl 1]:i110 –i117. Shallice T, Burgess PW (1991) Deficits in strategy application following frontal lobe damage in man. Brain 114:727–741. Tversky A, Kahneman D (1981) The framing of decisions and the psychology of choice. Science 211:453– 458. Ullsperger M, von Cramon DY (2003) Error monitoring using external feedback: specific roles of the habenular complex, the reward system, and the cingulate motor area revealed by functional magnetic resonance imaging. J Neurosci 23:4308 – 4314. Vogt BA, Vogt L, Farber NB, Bush G (2005) Architecture and neurocytology of monkey cingulate gyrus. J Comp Neurol 485:218 –239. Wallis JD (2007) Orbitofrontal cortex and its contribution to decisionmaking. Annu Rev Neurosci 30:31–56. Wallis JD, Miller EK (2003) From rule to response: neuronal processes in the premotor and prefrontal cortex. J Neurophysiol 90:1790 –1806. Walton ME, Devlin JT, Rushworth MF (2004) Interactions between decision making and performance monitoring within prefrontal cortex. Nat Neurosci 7:1259 –1265. Watanabe M (1996) Reward expectancy in primate prefrontal neurons. Nature 382:629 – 632. Williams ZM, Bush G, Rauch SL, Cosgrove GR, Eskandar EN (2004) Human anterior cingulate neurons and the integration of monetary reward with motor responses. Nat Neurosci 7:1370 –1375.