Apr 4, 2010 - gloss variation exceed acceptable values. This measured variation occurs in the whole running speed range of the paper machine. In addition ...
Estonian Journal of Engineering, 2010, 16, 4, 285–296
doi: 10.3176/eng.2010.4.04
Dynamic geometry of a rotating cylinder with shell thickness variation Jari Juhanko, Esa Porkka, Thomas Widmaier and Petri Kuosmanen Aalto University, School of Science and Technology, Department of Engineering Design and Production, Otakaari 4, P.O. Box 14100, 00760 AALTO, Finland; {firstname.lastname}@tkk.fi Received 5 October 2010, in revised form 1 November 2010 Abstract. This research is based on observations on paper quality problems. These observed quality problems were found out to be synchronous to the half of the perimeter of the backing roll of the blade coating station, and to be a function of the running speed. The backing roll has a large diameter compared with its shell thickness. Run-out measurement of the roll showed a running speed dependent run-out behaviour. Ultrasonic shell thickness measurement showed a relatively large systematic variation. The thickness measurement data was used as geometry information in two different FE models. The results from the analyses of these two FE models showed rotational speed dependent geometry changes, showing that the shell thickness variation is a possible cause of the observed paper quality problems. Key words: paper machine, roll geometry, roll dynamics, deformation, dynamic roundness.
1. INTRODUCTION The research is based on observations on quality problems of light-weight coated magazine paper [1,2]. The wavelength of harmonic coating grammage variation is found to be synchronous to half of the perimeter of the backing roll in the blade coating station as shown in Fig. 1. The observed coating grammage and gloss variation exceed acceptable values. This measured variation occurs in the whole running speed range of the paper machine. In addition, the variation seems to increase as a function of running speed. The dynamic behaviour of a typical rotating shaft is often characterized by an unbalance [5,6] and bending stiffness variation [7,8]. Unbalance can be observed as a vibration component at the rotating frequency. Unbalance causes bending of the flexible rotor as a function of the rotating speed and it excites excessive vibration when rotation frequency and natural frequency coincide. 285
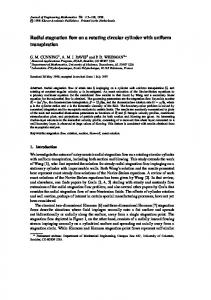
Fig. 1. Tapio PMA-analyser [3] is used to find the source for the single quality variation component of a machine direction paper sample. In the gloss spectrum two major components, caused by a backing roll of a coating station, are marked (°) at 4 and 8 Hz. The profile (lower) is generated from the harmonic components of one backing roll [4].
Asymmetry of paper machine rolls, i.e., asymmetry of inertia moments Ix and Iy, causes bending stiffness variation of the roll. Bending stiffness variation is found to be one cause for half-critical vibrations. At half-critical speed, i.e., at the rotating frequency, which is only 0.5 times the natural frequency, the harmonic excitations twice per revolution cause excitation at the resonance frequency. This frequency corresponds to the wavelength of the discovered grammage variation. In typical cases, resonance vibration occurs in a relatively narrow frequency band; therefore this resonance vibration phenomenon does not explain the observed behaviour in paper quality variation. In most cases, this vibration problem has been tackled with improved manufacturing technology. In the studied case, run-out measurements, carried out with one displacement sensor, show an increase in the 2nd harmonic component of the run-out as a function of the running speed to the power of two. The measured behaviour is somehow similar to the deflection of a flexible roll caused by unbalance as a function of the running speed. A typical balancing machine with a run-out measurement system cannot be used to analyse the cause of the run-out behaviour. Run-out consists of two components, i.e., run-out is a sum of the geometry error and rotational error motion of the rotor axis. These basic components cannot be distinguished from 286
each other with a simple measurement set-up using only one measurement sensor. In earlier studies [1,2,4] it is shown that the geometry of a roll is not perfect after grinding, but a varying amount of irregularities exists in the roundness profile of a roll. The original hypothesis is that the geometry of a rotating cylinder is not constant, but changes as a function of the running speed and of the mechanical and thermal loading conditions. In this study, the focus is on the effect of the running speed although the technology may as well be adapted to studying mechanical and thermal loads. 2. MATERIAL AND METHODS This research aims to find out the relation between the manufacturing accuracy and its effect on the dynamic geometry of a rotating cylinder. Wall thickness variation of the cylinder is measured and FE models are used to analyse the behaviour. 2.1. Ultrasonic measurement Ultrasonic measurement can be used for different purposes to analyse material structure. Ultrasound is characterized as the sound with frequency over 20 kHz. Precision ultrasonic thickness gages usually operate in a frequency range from 0.5 to 100 MHz. Typically, lower frequencies are used to optimize penetration when measuring thick, highly attenuating or highly scattering materials. For measuring the thickness of a paper machine roll made of steel the applicable frequency range is from 1 to 10 MHz, which optimizes the resolution and penetration [9]. A pulse-echo ultrasonic thickness gauge determines the thickness of a part or structure by accurately measuring the time required for a short ultrasonic pulse, generated by a probe, to travel through the thickness of the material, reflect from the back or the inside surface, and return to the probe (Fig. 2). The measured two-way time of flight is divided by two to account for the down-and-back travel path, and then multiplied by the velocity of sound in the test material. The result is expressed as:
s=
vt , 2
where s is the thickness of the work piece, v is the velocity of sound waves in the material and t is the measured time of flight (ToF). Continuous on-line ultrasonic thickness gauging is done by coupling the sound beam into the test piece through a water column generated by a squirter probe. Ultrasonic probe is calibrated by setting the sound velocity with respect to the material being measured. A calibration block with known thicknesses is used. Uncertainty of the measurement is estimated to be less than ± 0.1 mm. 287
Fig. 2. Typical echoes from an ultrasonic measurement with little damping in the material. The 1st echo is the sensor surface, the 2nd echo is the outer surface and the 3rd echo comes from the backside wall of the measured object.
In this study, the measurement is carried out in a grinding machine and the probe is fixed on the tool carriage (Fig. 3). The probe is aligned perpendicular to the measured surface and the set-up is steady during the measurement. The rotational angle of the roll and the axial position of the ultrasonic probe are measured by two incremental encoders (Heidenhain ROD450). A squirter probe Krautkrämer H5KF Krautkrämer is connected to a USPC2100 ultrasonic PC board for measurements. The used probe operates at 5 MHz.
Fig. 3. Ultrasonic measurement system consists of an ultrasonic probe, a computer with ultrasonic measurement unit and two position encoders to map the data [10].
288
2.2. FE analysis
Two FE models of a roll are created in order to evaluate the significance of geometry errors due to normal wall thickness tolerances.
2.2.1. Cross-section model The first FE model used in this study does neither take into account the measured wall thickness distribution nor the end plate support. The wall thickness variation is simplified by the allowed tolerances of the inner wall roundness. FE analysis is done for the cross-sections only. The FE model is not endsupported and the inner surface profile is assumed to be the same for the whole cylinder. The cross-section of the outer surface of the cylinder is an ideal circle (D = 2188 mm), nominal wall thickness t is 30 mm. The material of the cylinder is cast iron (E = 150 GPa, v = 0.33, ρ = 7000 kg/m3). The analysis is performed by variation of the surface velocity (0, 1200, 1500 and 1700 m/min) and inner surface profile errors for harmonics 2, 3 and 4, one at a time (A2 = 0.5, 1.0 or 2.0 mm, A3 and A4 = 0.25, 0.5 or 1.0 mm), as shown in Fig. 4. In the model the cross-section rotates around the geometric centre of the outer surface. The centrifugal forces are distributed according to the mass distribution and corresponding rotation radius. Each analysis consists of one harmonic of the inner surface profile, only A2, A3 or A4. The run-out profile of the outer surface is therefore the roundness profile. The FE analysis is performed using conventional 24 degrees of freedom 8node brick elements. Mesh consists of 64 elements in hoop and 3 elements radially in the cross-section resulting in 512 nodes, 192 elements and 1536 degrees of freedom. The FE model is constrained on the plane of the crosssection. The analysis is performed in Matlab 6.1 using a code, based on linear structural FEM-FEA [11].
Fig. 4. Cross-section verification model with varying amplitudes of the 2nd (left), 3rd (middle) and 4th (right) harmonic components of wall thickness variation.
289
2.2.2. Cylinder model The cylinder is modelled by Forsberg [12] using Elmer FE software, and the model is verified using another FE model built with Abaqus FE software. By verification, only main components of the wall thickness variation are modelled (Fig. 5). The nodes, defining the outer surface of the cylinder, are modelled as for perfect cylinder geometry. The measured wall thickness variation defines the inner surface nodes. This applies well for the actual manufactured geometry, because the outer surface has been either turned or ground within the tolerance that is only a fraction of the wall thickness tolerance. The program uses the measured wall thickness that defines mesh coordinates based on Lagrange interpolation. The program writes element, node and boundary conditions together with header files for the Elmer FE software. In this study the analysis is carried out by tetrahedral elements. The following assumptions and simplifications are used in the modelling: – the end plates are fixed, – Young’s modulus of the shell material is constant, including the welding seam, – the outer surface is a perfect cylinder, – spiral measurement results matrix is orthogonal, – eccentricity of the shaft is neglected, – the load is applied on the elements as volume forces.
Fig. 5. Cylindrical verification model with only 2nd harmonic component of wall thickness variation [12].
290
3. RESULTS 3.1. Wall thickness
Wall thickness variation is obtained by spiral measurement on a grinding machine. With a pitch of 10 mm/rev the measured matrix is 1024 × 690 points, hence a total of 720 000 measured points are acquired. Low-pass filtering is used to remove some high frequency noise and peaks. The filtered measurement result is shown in Fig. 6. The values measured at welding seams are excluded. The back wall echo is scattered at welding seams, hence it is hard to determine the material thickness accurately. The roll is welded from two rolled cylinders with one radial welding seam close to the lengthwise centre of the roll. Also, there are two axial welding seams on the opposite sides of the roll shell. The welding seam positions can be seen in Fig. 6 (they are shown also in Fig. 8). The roundness of the outer surface is typically less than 20 µm, hence the wall thickness variation is determined by the inner surface geometry. The most
Fig. 6. Wall thickness of a measured cylinder varies in the range of 37 to 43 mm. The values measured at welding seams are excluded. The cylinder shell is 7000 mm in length and 4700 mm in perimeter.
291
important component in wall thickness variation is the second harmonic component (oval geometry). The FFT analysis shows that the average value of the 2nd harmonic component is about 2 mm. The other harmonic components are negligible. In this study, only the mean value of the error component is used to find the initial values for the FE analysis. The welding seam is not modelled and therefore the effect of the welding seam is not analysed. Because of the manufacturing technology, the welding seam and the geometry of the roll are related so that the basic harmonic components are typically “phase locked” with the seam. 3.2. FE analysis of the cross-section model
The cylinder tube is analysed using shell thickness variation obtained from the thickness measurement data by operating speed up to 1700 m/min. The results are shown in Fig. 7. Each graph consists of the simulated data from three analysed amplitudes of error for the harmonic components of thickness variation. For example, 1 mm of systematic thickness variation component at 2nd harmonic (oval inner geometry) results in dynamic geometry change of about 2 mm. The dynamic geometry changes with 3rd and 4th harmonic variation components are 0.3 and 0.09 mm, respectively. 3.3. FE analysis of the cylindrical model
When the structure and the measured wall thickness of the cylinder are used in FE analysis at a rotational speed of 5.6 Hz, the result is a deformed profile, shown in Fig. 8. The midsection roundness from the linear quasi-static FE analysis of the cylinder shell behave similarly to a simple cross-section model and the main component is ovality. The ends remain unchanged because of the used boundary conditions. The advantage of the FE analysis is that the centrifugal forces and shell stiffness are linked together with finite element formulations of solid elements. The dynamic roundness profile changes clearly as a function of the rotating speed, as shown in Fig. 9. At the speed of 0.2 Hz the roundness is less than 40 µm. Increasing of the rotating speed has a clear effect on the dynamic geometry. The major component in the roundness profile at the maximum speed of 5.6 Hz is the 2nd harmonic component, i.e. the profile is oval.
292
Fig. 7. The effect of the wall thickness variation on the dynamic roundness of a paper machine roll. The 2nd (top), 3rd and 4th (bottom) harmonic components of the wall thickness variation and matching run-out harmonics of the outer surface are shown.
293
Fig. 8. Dynamic geometry of the cylinder at simulated rotating speed of 5.6 Hz. The roundness at the middle cross-section is 196 µm. Thick lines show the position of welding seams [12].
Fig. 9. Dynamic roundness of the middle cross-section of the cylinder at simulated rotating speeds of 0.2, 1.4, 2.8, 4.2 and 5.6 Hz. The roundness error increases from 37 to 196 µm.
4. DISCUSSION
The wall thickness of a paper machine roll shows systematic variation. The most important result was that the wall thickness has harmonic variation with one main component. The measured ovality of the inner surface geometry is in the range of millimetres instead of tens of micrometres that is the tolerance for outer geometry. The welded roll structure can be determined from the results. In the analysed finite element cases for a single cross-section, the outer surface deformation consists mainly of the harmonics of the inner surface profile. Centrifugal forces tend to increase the dynamic geometry error at the lowest harmonics of the inner surface profile. The higher harmonics of the inner surface profile have a small effect on the dynamic geometry under centrifugal forces. 294
As the inner profile does not change without machining, the worst case is low inner surface harmonics with high amplitudes and a small wall thickness with increased rotating speed. The FE analysis with the actual measured wall thickness variation matrix revealed the dynamic geometry change to be systematic with the maximum change in the middle section of the cylinder and less in the proximity of the fixed ends. The rotating cylinder deformations are mainly dependent on the centrifugal forces and the stiffness variation of the cylinder shell. The effect of centrifugal forces on the dynamic geometry is a function of the rotating speed. Therefore the amplitudes of the outer surface run-out harmonics can be relatively high at an operation speed of the paper machine due to the manufacturing tolerance of the roll. The normal engineering tolerance of the inner surface is total run-out, which is not a suitable solution for this kind of dynamic problems as it takes into account neither the harmonic content of the surface profiles nor the rotating speed. 5. CONCLUSIONS
The measurements show systematic wall thickness variation of the studied roll due to manufacturing inaccuracy. The main variation component is used in the cross-section finite element analysis to find out if manufacturing inaccuracy can be the cause for dynamic geometry change. The analysis shows that the wall thickness variation can cause dynamic geometry change. The dynamic geometry change is more sensitive to lower harmonic variation components, i.e., minimizing the ovality component profits most in the manufacturing process. A cylindrical FE model is created and the measured wall thickness matrix is used to define the inner surface nodes. This analysis shows similar dynamic geometry change, although the dynamic geometry is more complex due to fixed end plates. Furthermore, the studied behaviour could explain the observed quality variation of the LWC paper. The measured wall thickness variation can be the cause of the dynamic geometry change. The finite element model together with an ultrasonic wall thickness measurement system can be used in advanced manufacturing process to minimize dynamic deformations in operating conditions. ACKNOWLEDGEMENTS
Finnish paper and paper machine industry together with TEKES are greatly acknowledged for funding the research. Thanks to Tommi Uski and Kimi Forsberg for their work in the development of the ultrasonic measurement device and the FE model. 295
REFERENCES 1. Juhanko, J. and Kuosmanen, P. New method for proactive maintenance of paper machine rolls. In Proc. 2nd World Congress on Engineering Asset Management and the 4th International Conference on Condition Monitoring. Harrogate, UK, 2007, 812–921. 2. Kuosmanen, P. Predictive 3D Roll Grinding Method for Reducing Paper Quality Variations in Coating Machines. Thesis, Helsinki University of Technology, Publications in Machine Design 2/2004, Espoo, 2004. 3. Hilden, K. and Peranto, J. Paper analysis: the key to optimizing and troubleshooting paper machines. Pulp and Paper Canada, July 2000. 4. Juhanko, J. Dynamic Behaviour of a Paper Machine Roll. Licentiate Thesis. Helsinki University of Technology, Laboratory of Machine Design, Espoo, 1999 (in Finnish). 5. ISO 11342 Mechanical vibration – Methods and criteria for the mechanical balancing of flexible rotors, 1994. 6. Keskiniva, M. and Lauste, L. Dynamic balancing of flexible rolls of paper machines subjected to distributed unbalance loads. In Proc. Ninth World Congress on the Theory of Machines and Mechanisms. Milan, 1995. 7. Jei, Y.-G. and Lee, C.-W. Modal analysis of continuous asymmetrical rotor-bearing systems. J. Sound Vibration, 1992, 152, 245–262. 8. Kang, Y., Shih, Y.-P. and Lee, A.-C. Investigation of the steady state responses of asymmetric rotors. J. Vibration Acoustics, Trans. ASME, 1992, 114, 194–208. 9. Fowler, K. A., Elfbaum, G. M., Smith, K. A. and Nelligan, T. J. Theory and application of precision ultrasonic thickness gaging. NDTnet – October 1997, 2, No. 10. J. British Inst. Non-Destruct. Testing, www.ndt.net/article/wt1097/ panam/panam.htm 10. Uski, T. Ultrasonic Inspection of Coatings of Paper Machine Rolls. Master’s Thesis, Helsinki University of Technology, Laboratory of Machine Design, Espoo, 1999 (in Finnish). 11. Bathe, K. J. and Wilson, E. L. Numerical Methods in Finite Element Analysis. Prentice-Hall, Englewood Cliffs, 1976. 12. Forsberg, K. Modelling of the Shell Deformations of the Tube Roll. Master’s Thesis, Helsinki University of Technology, Laboratory of Machine Design. Espoo, 2006 (in Finnish).
Muutuva seinapaksusega pöörleva rulli dünaamiline geomeetria Jari Juhanko, Esa Porkka, Thomas Widmaier ja Petri Kuosmanen Uurimus põhineb paberi kvaliteedi monitooringul. On leitud seos kvaliteedi ja trükiseadme tugirulli perimeetri vahel funktsioonina seadme töökiirusest. Tagarulli kooriku paksusega võrreldes on rulli läbimõõt suur. Rulli viskumise mõõtmised võimaldasid määrata seose pöörlemiskiiruse ja viskumise iseloomu vahel. Kooriku paksuse ultrahelimõõtmised näitasid selle suhteliselt suurt süstemaatilist varieerumist. Paksuse mõõtmise andmeid kasutati kahe erineva lõplike elementide meetodil loodud mudeli geomeetriliste parameetrite sisendina. Nende mudelite analüüsi tulemused näitasid pöörlemissageduse sõltuvust rulli geomeetria muutustest, mis tähendab, et kooriku seinapaksuse ebaühtlus on paberitootmisel kvaliteediprobleemide üheks võimalikuks põhjuseks.
296