Probabilistic approach is the most popular one to build occupancy grids. It was developed by Alberto Elfes [Elfes 1990] and Hans Moravec [Moravec 1988]. It as-.
Mathware & Soft Computing 13 (2006) 5-22
Dynamic Gridmaps: Comparing Building Techniques J.M. Ca˜ nas and V. Matell´an Robotics Group Universidad Rey Juan Carlos C/ Tulip´an s/n, 28933 M´ostoles (Madrid) Spain {jmplaza,vmo}@gsyc.escet.urjc.es Abstract Mobile robots need to represent obstacles in their surroundings, even moving ones, to make right movement decisions. For higher autonomy the robot should automatically build such representation from its sensory input. This paper compares the dynamic character of several gridmap building techniques: probabilistic, fuzzy, theory of evidence and histogramic. Two criteria are defined to rank such dynamism in the representation: time to show a new obstacle and time to show a new hole. The update rules for first three such techniques hold associative property which confers them static character, inconvenient for dynamic environments. Major contribution of this paper is the introduction of two new approaches are presented to improve the perception of mobile obstacles: one uses a differential equation to update the map and another uses majority voting in a limited memory per cell. Their dynamisms are also evaluated and the results presented.
1
Introduction
One main capability in mobile robots is the environment representation, especially representing obstacles which the robot can collide with while it is moving around. Historically this environment map was introduced in the robot by the robot engineer. The advance towards increasing autonomy in mobile robots has led to provide them with mechanisms to build and autonomously update those maps from their sensor measurements. Besides topological maps, two paradigms can be distinguished in metric maps: geometric elements models [Leonard 1992] and occupancy grids [Elfes 1990] [Moravec 1988]. In the first one there is a set of representation primitives (such points, corners, walls, etc) whose position is constantly estimated from sensor information. We use the second one, that partitions the space in a regular net of cells. Each cell stores the belief in its occupancy or emptiness. It doesn’t need structure in the environment to build a convenient representation and makes easier 5
6
J.M. Ca˜ nas & V. Matell´an
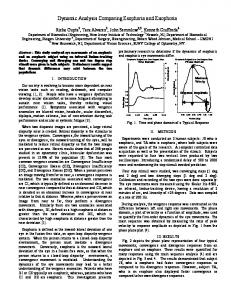
the fusion of data coming from different sensors. Figure 1 shows an example of occupancy grid around the robot, dark cells mean obstacle surface in them and clear ones mean empty space. Most literature in environment representation divides the information in two parts attending to their nature. First, a global map including the static obstacles such walls, furniture, etc. allows long term path planning. Second, an instantaneous representation, mainly the last sensor readings, allows fast reaction to unexpected obstacles. The last reading of all sensors provides an snapshot, continuously updated, of robot surroundings’ state, as shown in right part of figure 1. Due to its simplicity (in Pioneer robot 15 integers coming from 15 sonar sensors) and its liveliness, this representation has been used in many cases to build reactive behaviors upon it, for instance obstacle avoidance.
Figure 1: Occupancy grid example (left). Instantaneous sonar readings (right) In this paper we will compare several map building techniques, with the aim of keeping a representation local to the robot that implements sensor fusion to some extent and at the same time catches the dynamism of mobile obstacles in its surroundings. We use a grid to fuse data coming from different sensor readings. The grid can store information of nearby areas that suddenly become occluded by an obstacle. Fusion also helps to eliminate sensor errors and to obtain better obstacle surfaces, balancing faulty readings with correct ones, hopefully more frequent. This counterbalance is very convenient, especially with sonar sensors because they are noisy and error prone. Finally, fusion also allows identification of more complex stimuli, that don’t fit into one single sensor reading. It allows accumulation of suspects and partial evidence integration. This is crucial when a sensor measurement, by itself, it is not concluding about the existence of such an such stimulus. For instance the wall stimulus. The last sonar reading it is already affected by the wall existence but from that reading it is impossible to distinguish whether there is a wall or another object. The accumulation of several readings and the alignment of occupied cells will allow us to infer that the object is actually a wall and not another different
Dynamic Gridmaps: Comparing Building Techniques
7
obstacle. The main requirement about this local representation is that it has to be dynamic. The environment maps are intended to be the information platform to build all robot behaviors, including the reactive ones. So it has to timely catch the changes in the environment, not only the new appearing obstacles, but the new holes that appear when the obstacles move around or a door is opened. The robot sensors are continuously sensing the environment. The map building algorithm should be efficient enough to run on the fly and should consume low computer power to work together with decision making programs. This dynamic, continuous scenario is completely different to static map building, where the main purpose of maps is to store the location of static obstacles and they can be built off line from a finite set of readings. Usually the robot will be continuously sensing its environment while it makes its movements. Instead of having an static and finite set of sensor readings we will have a constant flow of them. The reliable map building in real time will be carried out at the same time of decision making upon that map.
2
Dynamic approaches
Map building and maintenance has been broadly dealt with in the robot community. As it will be shown in 3 most popular approaches have an implicit static nature, in which the speed in getting a occupancy belief doesn’t matter as much as its correctness. This way, balance between different readings aims to correct uncertainties inherent to sensors. In dynamic maps the real state of a given cell can change in time, so the update rule must also balance old readings with recent ones. Belief should change very fast if new readings pointed to a real occupancy state different from the current one, lively showing an obstacle moving. We propose in this section two new approaches to improve the dynamism of the representation exhibited by most popular techniques, and the metrics used to compare such dynamism.
2.1
Dynamic ratings
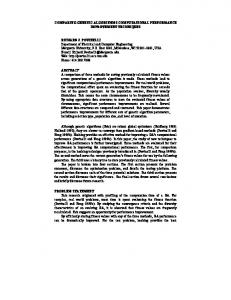
We define two features to measure the dynamic behavior of representation building algorithms: time to show an obstacle (TSO) and time to show a hole(TSH), which give the number of readings required to accept a change in belief, confirming a new surface or a new empty cell. To measure such quantities we have used test series that correspond to sequences of independent observations impinging the same given cell. For instance, horizontal axis in figure 2 holds time, each tick represents a new sensor observation: positive bars (+0.1) mean surface evidence in the cell and negative ones (-0.1) emptiness. All those readings seen in sequence are the test series. In figure 2 such test series has 10 initial readings pointing emptiness and 40 following readings pointing surface in the cell. In this case vertical axis holds the current probability estimation, normalized to [−1, 1] (the sensor model was
8
J.M. Ca˜ nas & V. Matell´an
Figure 2: TSO and TSH in probabilistic approach.
p(occ/obs(t)) = 0.7 and 0.3). It can be seen that strong probability change takes 15 readings long, from tick 10 to tick 25, that is, time to show an obstacle is 15 ticks for probabilistic approach. In the same figure time to show a hole is measured at the end of that test series. Opposite to liveliness criterion (low TSO and TSH) we have the robustness against uncertain observations criterion. The balance among readings needed to have robust estimations requires some latency to take place, and a single new reading doesn’t bias significantly the global belief until it is confirmed with new ones. Whatever the map building algorithm was, it sets a tradeoff somewhere in between this two criteria.
2.2
Differential equation approach
Usually map building has been divided in two steps. First, a sensor model catches all the information about space occupancy carried in every sensor reading. Second, this model is used to update the current belief, fusing it with all the prior readings. In this work sensor model’s geometry has been ignored, focusing on the dynamic character of the update rule. For simplicity we will deal with digital observations obs(t) = ±1, -1 for emptiness and +1 for surface evidence although this approach accepts gradual evidence according to different readings reliability. The occupancy state of a given cell in this proposal is a continuous variable taking values inside [Emin , Emax ]. Emax shows surface certainty in that cell and Emin = −Emax means emptiness certainty. Its value is updated using the differential equation (1), which stems in the equation proposed by Hans Moravec in
Dynamic Gridmaps: Comparing Building Techniques
9
[Moravec 1988]. e(t) = e(t − 1) + obs(t) ∗ sat(t) ∗ seq(t) ∗ speed � obs(t) > 0 |Emax − e(t − 1)| sat(t) = obs(t) < 0 |Emin − e(t − 1)|
(1) (2)
Depending on the sign of obs(t) the occupancy belief will increase or decrease. The change amplitude depends on several terms: • Saturation term, sat(t) (2), truncates the increment size to keep state within boundaries. It makes the same reading to have different impact on overall belief depending on current state. In addition, when the grid is very confident on cell occupancy, new surface readings add almost no information and so they don’t change cell state much. • Sequence term, seq(t), takes values in [0, 1] and is calculated over a small memory attached to each cell. If current obs(t) appears in coherent sequence with the last readings, that is, has the same sign then seq(t) will be close to 1. The longer the sequence the bigger the value. If the current reading contradicts the last observation then seq(t) will be close to 0. This term delays the effect of surprises a little bit until the trend is confirmed. Doing so it reduces the influence of spurious faulty readings. • Finally, Speed term, ranging from 0 to 1, modulates the state change speed. It is constant for the whole grid . Equation (1) can be seen as Integral controller from PID family, e˙ = τ1 (eref −e), where belief e is the controller output and obs(t) sets the target belief reference eref = ±Emax . The well known solution to such equation is an exponential func1 tion e(t) = eref (1 − e− τ t ). So in this approach the belief evolves as a negative exponential function trying to reach the current belief target, which can change in time. Such evolution has a time constant τ1 = seq(t) ∗ speed which determines the speed of such change: high τ means slow belief change. One of the advantages of this approach is that all the parameters of the dynamism are explicitly in the equation, and can be tuned at will, choosing a tradeoff between liveness and robustness criteria. For instance, tuning speed term we can set the critical mass of readings required to change the belief completely: smaller the term, faster the change. Figure 3 shows the negative exponential evolution of belief in this approach for speed parameters 1, 0.6, 0.4 and 0.25. In this case, the test series used is a sequence of five fixed intervals alternating among occupancy and free space evidence. It also displays that differential equation belief takes short to reflect possible obstacle movements, it has small TSO and TSH, so occupancy state follows changes in reality with a short tunable delay. In addition saturation can be observed in figure 3 when several evidences with same sign are accumulated, so recurrent incoming readings cause shorter increments in belief. It can also be seen that first contradictory observation doesn’t have as much impact on certainty value as the second and third ones, due to sequence term.
10
J.M. Ca˜ nas & V. Matell´an
Figure 3: Latency in differential equation approach. The proposed differential equation, by its own nature, offers a high dynamism in the belief evolution and makes recent readings to have systematically more influence on current belief than older ones. Additionally we have included a forgetting mechanism that periodically (i.e. each second) multiplies the belief by a f orgetting term = 0.98 This mechanism pushes iteratively the belief in all cells to the unknown state e(t) ' 0, even in the absence of incoming observations and forces them to refresh their belief with new readings.
2.3
Majority voting
A second map building approach is proposed to work on dynamic scenarios. In this one, each cell stores in temporal order the last N readings impinging the cell: obs(t − 1), obs(t − 2), . . . obs(t − N ). Adding all evidences in memory we PN have the accumulated evidence, i=1 obs(t − i), that ranges from -N to +N. The occupancy state of the cell is estimated with this accumulated evidence using a shaping function as the one in figure 4. Vertical axis represents the occupancy state estimation and horizontal axis the accumulated evidence for that cell. The noise threshold in figure 4 shows the minimum evidence required to start believing that the cell is either occupied or empty as shown in picture 5. True surface cells or true empty ones quickly surpass that threshold as new readings impinge them. As new occupancy evidences are stored in the cell memory the occupancy state estimation increases linearly until it reaches a saturation threshold as can be seen in 5. This threshold equalizes areas where the robot has been most of the time and the areas with less observations, but enough to conclude something about
Dynamic Gridmaps: Comparing Building Techniques
11
Figure 4: Occupancy state estimation given the accumulated evidence
occupancy state. There can be several contradictory evidences on the same cell. The balance among emptiness evidences and surface ones is pretty clear in this approach, they have different signs and are all added up. A single faulty reading doesn’t bias the belief against a majority of good ones. This approach also allows different weight to each reading according to its sign, distance, probability of specular reflection, angle, etc. to tune such balance, but it falls outside the scope of this paper. As new readings are inserted in cell memory the older ones are forgotten, so the surface belief is always fresh. Additionally we have included a forgetting mechanism which periodically inserts neutral observations to push old readings out of memory. This way the belief tends slowly to unknown if no new readings are obtained. Experiments done with N = 10, noise th = 2 and saturation th = 8 are displayed in figure 5, which shows that majority voting belief can change from one end to the other as many times as required whenever enough new readings support that change. TSO and TSH depend on memory size, N , and threshold values.
3
Experimental comparison
In this section we have grouped most representative approaches to store occupancy belief and to update such belief from sensor readings: probabilistic Bayesian approach, theory of evidence, fuzzy sets and Borenstein’s histogramic algorithm. There are many comparisons in the literature [Gambino 1996],[Ribo 2001], [Poloni 1995],[Peignot 1998] but none of them have explicitly evaluated the dynamic behavior of map building algorithm.
12
J.M. Ca˜ nas & V. Matell´an
Figure 5: Latency in majority voting.
3.1
Probabilistic approach
Probabilistic approach is the most popular one to build occupancy grids. It was developed by Alberto Elfes [Elfes 1990] and Hans Moravec [Moravec 1988]. It assumes each grid cell can only be in one of two states, empty or occupied, and that has to be estimated from sensor observations. The knowledge that robot has in time t about occupancy of a given cell is stored as probability of those two states, given all the prior sensor observations (3), that is, the current sensor value obs(t) and the set of sensor readings up to t − 1, data(t − 1). When occupancy probability falls near 0 then the robot is very confident that the cell is empty. On the other hand, when yields a value close to 1 there are strong evidences to support the belief the cell is occupied. At the beginning all cells are initialized at 0.5 to mean absolute ignorance about their state. In recent probabilistic papers [Peignot 1998] the posterior sensor model is used which states the occupancy probability of a cell given certain sensor reading obs(t), i.e. p(occ/obs(t)). For instance given a sonar measurement r, [Peignot 1998] uses a cone model with p(occ/obs(t)) = 0.4 in cells closer to the sensor and p(occ/obs(t)) = 0.6 in cells on that radius. For further cells p(occ/obs(t)) = 0.5, that doesn’t provides any information in probabilistic approach.
3.1.1
Update with Bayes rule
As new readings are collected by sensors the stored probability changes to integrate their information. Incremental Bayes rule in (5) can be obtained following a development similar to [Martin 1996] and [Margaritis 1998]. This equation uses a
Dynamic Gridmaps: Comparing Building Techniques
13
posterior sensor model and probability ratios, defined in (4). pocc (t) = p(occ/obs(t), data(t − 1)) ρmap = pocc /(1 − pocc ) ρobs(t) ρmap (t) = ∗ ρmap (t − 1) ρprior
(3) (4) (5)
If a sensor measurement provides information about cell then the sensor model value p(occ/obs(t)) for that cell determines, through ρobs(t) , whether the stored probability increases of falls down after that observation. The denominator ρprior normalizes the effect of ρobs(t) . When both are equal then the new observation doesn’t give any additional information and the probability doesn’t change. If ρobs(t) > ρprior then the stored probability increases and decreases when ρobs(t) < ρprior . Probability provides a reliable theory framework to make inferences, calculi, and hypothesis with available information. Another advantage of this approach is the incremental formulation of Bayes rule (5), that allows an efficient implementation of the algorithm both in update time and in required memory space. A relevant drawback is that it doesn’t provide any confidence measurement in current probability value. 3.1.2
Probabilistic dynamism
Its implicit static nature is shown when we have got a absolutely reliable sensor reading. For instance p(occ/obs(t)) = 0 if the cell is empty, so ρobs(t) = 0 and using (5) it pushes the stored probability ratio ρmap (t) and p(occ/data(t)) to 0, and they will not change ever regardless the following readings. Similarly when p(occ/obs(t)) = 1 ρmap (t) is pushed to ∞ , probability will get trapped in p(occ/data(t)) = 1 and will not change ever. These deadlocks are due to the static nature of probabilistic estimation. When a reading is absolutely reliable then it gives the real state, whatever the current estimation was, and probability should not change anymore. Nevertheless this feature doesn’t take into account that real state can change in time. We have observed that the more evidences support the current probability value, the longer it takes to change the probability estimation (bigger TSO and TSH). This can be observed in figure 6, where the test series is a sequence of alternating periods, progressively longer, of occupancy readings and emptiness ones. The TSO to TSH ratio depends on the concrete sensor model, but for symmetric values (around 0.5) both features hold exactly the same number. This inertia slow down the speed in probability change when current belief has many readings supporting it. It seems sensible, but if we look at it carefully it is not. Let’s imagine a cell that has been empty for a long time, and we have got a series of 1000 independent readings confirming such belief. Suddenly an obstacle in the environment moves and its surface enters into that cell. After 20 new readings pointing to occupancy in the cell the probability hasn’t changed much, it will need another 980 readings to discount the effect of past observations. Nevertheless 20 independent readings
14
J.M. Ca˜ nas & V. Matell´an
Figure 6: Probability inertia depends on number of evidences supporting current value.
are enough to be confident they come from a change in real state, not from faulty readings. It can be argued that stronger sensor models, with values closer to probability extremes, may speed up this dynamism. Experiments about this are displayed in figure 7, where the evolution of probability estimation is shown using different symmetric sensor models, p(occ/obs(t)) =0.55, 0.6, 0.7 and 0.8 (and so p(emptiness/obst(t))=0.45, 0.4, 0.3 and 0.2 respectively). Nevertheless time to change probability are exactly the same for 0.55, 0.6 and 0.7. This latency is constant regardless the sensor model. This can be explained from equation (5) where the balance among different readings is determined by ρobs(t) . Using symmetric models around 0.5 that term holds inverse values. For instance for p(occ/obs(t)) = 0.6 and 0.4 it can be proven that ρobs(t) (0.4) = ρobs(t)1 (0.6) . So multiplying by ρobs(t) (0.4) and later by ρobs(t) (0.6) lets the probability unaffected. This means that one surface reading discounts one free space reading, and vice versa. If the current probability estimation is supported by n observations then another n readings pointing to the opposite state are required to discount their effect. For stronger models the probability grows up and decreases faster than for smoother ones, but it takes the same time to change its mind because probability reaches higher values. In practice, Bayes rule (5) is not applied for probability values close to the extremes. Due to representation limitations computers can not distinguish values pretty close to 1 from 1 itself, neither values pretty close to 0 from 0 itself. As we have described once the stored probability reaches 1 or 0 Bayes rule doesn’t modify its value ever, regardless the new observations. To avoid this deadlock,
Dynamic Gridmaps: Comparing Building Techniques
15
Figure 7: Probability evolution with symmetric sensor models p(occ/obs(t)) =0.55, 0.6, 0.7 and 0.8. due only to practical implementation, probability values are bounded to [δ, 1 − δ]. For instance, we used δ = 10−7 for our experiments ([Martin 1996] uses a ±128 in the log probability) and the output value from (5) update is truncated inside that range. This saturation prevents the evidence accumulation on the extremes, that would approximate even more the probability to 1 or 0. This threshold bounds the implicit probabilistic inertia and makes stronger sensor models effectively exhibit faster dynamism in belief changes when they reach saturation. They reach it sooner than lighter models. This explains smaller latency in belief change for model p(occ/obs(t)) = 0.8 in figure 7. It is the only one that really changes the probability according to new readings because it is the only one that reaches saturation in the test series period. The exact value of δ and the sensor model determine TSO and TSH, which are now more independent of past readings.
3.2
Theory of evidence
Theory of evidence stems in the definition of a frame of discernment Θ, that is a set of labels representing mutually exhaustive events. As described in [Pagac 1998] the interesting labels for map building application are Θ = {E, F }, meaning that grid cells can be empty E or occupied F . A basic probability assignment is a function m : Ψ → [0, 1], where Ψ is the set of all subsets of Θ, in our case Ψ = {∅, E, F, {E, F }}. A basic probability assignment is used to define the current state of each cell, in our case four numbers. They can be reduced to two of them (mmap (E), mmap (F )), assuming mmap (∅) = 0 and applying (6). (0,0) means total ignorance, and so mmap (E, F ) = 1. When robot can be sure of cell occupancy then mmap (F ) = 1,
16
J.M. Ca˜ nas & V. Matell´an
and that makes 0 the other labels. Reversely mmap (E) = 1 when the robot is sure a cell is empty. A basic probability assignment also defines the information provided by a new sensor reading, (mobs (E), mobs (F )). For instance, the geometry of sonar sensor model used in [Pagac 1998] is a propagation cone: for cells inside the arc (0, n1 ), where n is the total number of cells in the arc, and for cells inside the cone (ρ, 0), where ρ is a equalization constant. m(E) + m(F ) + m(E, F ) = 1 3.2.1
(6)
Update with Dempster-Shafer rule
Dempster-Shafer rule allows to combine independent evidences about a certain event A, m1 (A) and m2 (A). In our case they will be the basic probability assignments for the stored belief and the current sensor reading. For the event E the update formulation follows (7) as shown in [Pagac 1998]. t mtmap (E) = (mt−1 map ⊕ mobs )(E) = t−1,(E)
mmap
t,(E)
t−1,(E)
mobs + mmap t−1,(E)
1 − mmap
t,(E,F )
mobs
t,(F )
t−1,(E,F )
+ mmap
t−1,(F )
mobs − mmap
t,(E)
t,(E)
mobs
(7)
mobs
One advantage of this approach is that explicitly represents ambiguity not only in sensor readings mobs (E, F ), but also in stored belief mmap (E, F ). Contradiction is also represented: in a given period a cell can store evidences pointing at its occupancy (mtmap (F )) and also contradictory evidences supporting free space (mtmap (E)). As stated in [Murphy 1998], for a single step contradiction can also be measured as the denominator in equation (7), which is the Dempster normalization factor. If we want summarize the belief in only one number we will have to distill it from these two accumulated values. Such combination will carry a certain balance among occupancy and emptiness evidences stored in each cell. 3.2.2
Dynamism of theory of evidence
Using Dempster-Shafer combination rule stored evidences mmap (E) and mmap (F ) can increase or decrease in time depending on new readings. As in the probabilistic case, completely reliable readings, either surface (0,1) or a free space ones (1,0), push the accumulated evidence to certainty, and it will remain there forever, regardless new observations. For the same practical limitation explained above, stored evidences are truncated inside [δ, 1 − δ] to avoid the deadlock. This means that we enforce a minimum uncertainty of mmap (E, F ) = 2δ. In the experiments performed, using (0, 0.7) and (0.7, 0), the evolution of evidence is very similar to probabilistic one after some initial readings. Actually those initial readings reduce the accumulated uncertainty mmap (E, F ) to very small values and then Dempster Shafer rule exhibits the same dynamism as Bayes rule. The same comments about inertia depending on supporting evidence also apply to this approach.
Dynamic Gridmaps: Comparing Building Techniques
3.3
17
Fuzzy maps
In the fuzzy approach, described in [Poloni 1995], [Gambino 1996], [Oriolo 1998] and [Ribo 2001], the map is stored in two not complementary global fuzzy sets: the empty area set ε and the occupied area set o. Each cell C(x, y) has a membership degree for both sets, expressed as a fuzzy membership µε (x, y), µo (x, y).
Figure 8: Example of fuzzy sonar models for occupancy (left) and emptiness information (right). The information in a single sonar reading k is also captured in two fuzzy sets εk y ok , representing the emptiness and surface evidence carried in the reading k for different space cells. For instance figure 8 shows the sonar sensor models used in [Poloni 1995]. 3.3.1
Update with union fuzzy operator
Global fuzzy sets are defined as fuzzy union of all local evidences from sonar readings. For emptiness it follows equation (8). Fuzzy union holds the associative property, and thus equation (8) allows an incremental implementation, which is very efficient from a practical point of view. In the classic formulation [Poloni 1995] several union operators were proposed: algebraic sum (9), bounded sum (10), Dombi and Yager operators, etc. i=k [
i=k−1 [
εi ) ∪ ε k
(8)
(A ∪ B)(x) = µA (x) + µB (x) − µA (x) ∗ µB (x) (A ∪ B)(x) = min(1, µA (x) + µB (x))
(9) (10)
ε=
i=1
εi = (
i=1
One advantage of fuzzy approach, given in [Gambino 1996], stems in the few assumptions required, far less than probabilistic approach. This means that the designer has more freedom to choose sensor model and fuzzy operator. Occupancy and emptiness evidences are not contradictory in fuzzy theory, so in general µε (x, y) 6= 1 − µo (x, y). This is the reason for this approach to be more robust to spurious faulty readings than probabilistic one, as stated in [Gambino 1996]
18
J.M. Ca˜ nas & V. Matell´an
and [Oriolo 1998]. Combining both global fuzzy sets one can separate ambiguous areas from unknown ones, that is, contradictory information from absence of it. Both sets can also be combined to summarize occupancy state, balancing all evidences, for example F = ε ∩ o. 3.3.2
Fuzzy dynamism
In general, any T-conorm can work as fuzzy union operator because all them satisfy commutative, associative, monotonic properties and boundary conditions. As we will discuss in 4 associative property results in bad dynamic behavior. In addition any non idempotent operator as algebraic sum (9), bounded sum (10), Dombi and Yager operators used for fuzzy union in [Poloni 1995], [Gambino 1996] and [Ribo 2001] exhibit an unacceptable block when many readings are fused. With all of them membership functions are monotonic increasing. When both µε and µo get closer to 1 then final estimation for the cell state blocks forever, whatever combination equation be. The main problem lies in that stored evidence never decreases, preventing any correction. This is especially harmful in dynamic maps. For instance, imagine a given cell is initially empty, so it stores many free space evidences. If its real state changes, then it will start accumulating surface evidences so current belief, but prior emptiness evidences are never forgotten. They affect the final estimation, say F = ε ∩ o, despite don’t match with current cell state anymore. This shortcoming shows the need for a forgetting mechanism to override the weight of such past readings. We also claim that results given in [Oriolo 1997] with Dombi operator are possible only because there is a finite set of readings and the number of them that impinge any cell is small. Additionally, sensor model itself (k� ) and λ parameter for Dombi operator were selected looking at the size of the data set to avoid any saturation. Such adaption is impossible with continuous stream of readings, and in such scenario fuzzy evidence eventually gets blocked. To avoid such undesirable behavior recent works in fuzzy maps have explored other fuzzy union operators. For instance, [Oriolo 1998] uses a weighted average, biasing the combination to previous map evidence. In such case, membership functions µε and µo can already decrease when new readings are fused. Another option is to use max or other idempotent operator for fuzzy union, because they don’t suffer from such blocking. Nevertheless, they don’t come to certainty with infinite number of partial evidences, which is a useful feature for this kind of maps. A third alternative is to enforce some normalization among µε and µo to recover consistency from conflicting readings on that cell, maybe breaking down the associativity of the maps.
3.4
Histogramic approach
Histogramic approach was presented by Johann Borenstein and Y. Koren [Borenstein 1991]. Each cell keeps a Certainty Value CV showing the confidence
Dynamic Gridmaps: Comparing Building Techniques
19
in the existence of an obstacle in such position. It ranges from CVmin = 0 to CVmax = 15. Histogramic sonar model used in [Borenstein 1991] has axial geometry, it only modifies the cells located on the central axis of the beam. For a cell over the distance already measured ∆(t) = +3 and for closer cells ∆(t) = −1. 3.4.1
Histogramic update rule
Information fusion is done through and additive heuristic update rule (11), that adds the sensor model value for the given cell to the already stored value. CVi,j (t + 1) = CVi,j (t) + ∆(t)
(11)
In Borenstein’s work [Borenstein 1991] there is an explicit study of dynamic character of the environment representation. Update rule accepts that belief can change completely with a finite number of sensor readings, as many times as required, and independently of readings supporting the prior belief. It defines the critical mass of readings required to accept a belief as a solid one which determines the maximum speed incorporating the obstacles and holes to the grid. Another advantage is that it doesn’t need the readings be independent, all of them are integrated. Neither hypothesizes how the sensor data are distributed given a world configuration. The balance among all of them builds a probability distribution in the space. 3.4.2
Histogramic dynamism
This approach has a very clear arithmetic to balance between free space readings and surface ones. It is given by sensor model which gives a +3 weight for occupancy readings and -1 for emptiness observations. For this reason, it takes three times shorter to realize a new obstacle (TSO) than to perceive a new hole (TSH), as shown in figure 9. Surface belief moves lineally inside [0, 15], with saturation in both ends.
4
Discussion
Most popular approaches in grid maps building have been reviewed and their dynamism have been evaluated quantitatively and focusing on its own nature. Probabilistic approach, theory of evidence and fuzzy paradigms are not suitable to represent features which can change in time, as occupancy when there are moving obstacles. The main reason behind this assertion is that Bayes rule, Dempster-Shafer combination rule, and fuzzy union operator hold associative property: given a readings sequence, final state of grid cells is the same regardless the order in which such readings were incorporated. Dealing with probability p(occ/r1 , r2 ...rn ) = Si=k p(occ/rn , rn−1 ...r1 ), fuzzy union operator ε = i=1 εi is associative and DempsterShafer rule also complies ((m1 ⊕ m2 ) ⊕ m3 )(E) = ((m2 ⊕ m3 ) ⊕ m1 )(E), with and without Dempster normalization.
20
J.M. Ca˜ nas & V. Matell´an
Figure 9: Latency in histogramic approach. Such property confers an implicit static character to them and disables them to represent dynamic features. With dynamic features it is convenient that recent sensor values weight more in global belief estimation than older ones, maybe obsolete. Nevertheless, in these approaches the influence of a reading in the estimation doesn’t depend on its age and its influence is never forgotten. For clarification let’s imagine a given sequenceA with 200 readings, the first hundred signaling occupancy and the last hundred pointing free space on the same cell, corresponding to an obstacle moving away from its prior location. Let’s have another sequenceB , exactly the inverse one, corresponding to an obstacle arriving to a new location previously in empty state. Saying nothing about deadlocks, the final cell state would be the same for both sequences due to associative property. Common sense says that final belief for sequenceA should the opposite one than for its inverse sequenceB . Bayesian probabilistic approach has an inertia proportional to supporting evidences, making probability change too slow. In general it needs as many occupancy readings as free space readings to change the sign of its estimation. In practice, it exhibits faster dynamism due to a representation limitation that enforces to deal only with probability values inside [δ, 1 − δ]. This limitation breaks all probability assumptions done in theoretical formulation and doesn’t belong to Bayesian formalism itself. Classic fuzzy operators cause unacceptable deadlock after few initial readings. It doesn’t work properly with a continuous stream of observations. The reason for this deadlock lies in increasingly monotonic character of some fuzzy operators as algebraic sum and bounded addition. Other works inside fuzzy paradigm [Oriolo 1998] propose new operators, closer to weighted average, to overcome such serious drawback. One solution for inertia due to associative property is to set a time window and calculate the current occupancy estimation using previous approaches but only for
Dynamic Gridmaps: Comparing Building Techniques
21
readings in such window. To make it incremental maybe undo operators need to be developed to explicitly forget the influence of an old observation. We have proposed two new approaches, differential equation and majority voting, which do follow real dynamism in objects, as histogramic paradigm. In addition they have several parameters to tune its dynamic behavior. Both distinguish among sequenceA and sequenceB , concluding different final states. No matter how confident the robot could be about occupancy of a given cell, a significant number of readings in the opposite way are enough to change the sign of current estimation. Such dynamism is essential to represent moving obstacles properly and when the robot itself moves with imperfect dead reckoning, even if all obstacles are static. Approaches holding associative property, that is infinite memory, enforce to keep a good localization to avoid mixing evidences for different cells.
Acknowledgments The authors would like to acknowledge Alessandro Saffiotti and Hans-Ulrich Kobialka for their helpful comments. Support for this work has been provided by project DPI2004-07993-C03-01 from Spanish Education and Science Ministry.
References [Borenstein 1991] J.Borenstein, Y. Koren, Histogramic in-motion mapping for mobile robot obstacle avoidance, IEEE Journal of Robotics and Automation, Vol 7#4, 1991, pp. 535-539. [Delhoche 1998] L. Delahoche, C. P´egard, E. M. Mouaddib, P. Vasseur, Incremental map building for mobile robot navigation in an indoor environment, Proceedings of the 1998 IEEE International Conference on Robotics & Automation ICRA-98, Leuven (Belgium), 1998. [Elfes 1989] Alberto Elfes, Occupancy grids: a probabilistic framework for mobile robot perception and navigation, PhD Thesis, Electrical and Computer Engineering Department, Carnegie Mellon University, 1989. [Elfes 1990] Alberto Elfes, Occupancy grids: a stochastic spatial representation for active robot perception, Proceedings of the Sixth Conference on Uncertainty in AI, July 1990, Morgan Kaufmann Publishers, Inc.. [Gambino 1996] Fabio Gambino, Giuseppe Oriolo and Giovanni Ulivi, A comparison of three uncertainty calculus techniques for ultrasonic map building, Proceedings of the 1996 SPIE Symp. on Aerospace/Defense Sensing and Control, Applications of fuzzy logic technologies-III, pp. 249-260, 1996. [Howards 1996] A. Howard y L. Kitchen, Generating sonar maps in highly specular environments, Proceedings of the 4th International Conference on Con-
22
J.M. Ca˜ nas & V. Matell´an
trol, Automation, Robotics and Vision ICARCV’96, pp. 1870-1874, Singapore, 1996. [Leonard 1992] J.J. Leonard, H. Durrant-Whyte and I.J. Cox, Dynamic Map Building for an Autonomous Mobile Robot, Int J. of Robotics Research, 11, 4, pp. 286-298, (1992). [Margaritis 1998] D. Margaritis y S. Thrun, Learning to locate an object in 3D space from a sequence of images. Proceedings of International Conference on Machine Learning, pp. 332-340, 1998. [Martin 1996] Martin C. Martin y Hans P. Moravec, Robot Evidence Grids, Technical Report CMU-RI-TR-96-06, Robotics Institute, Carnegie Mellon University, 1996. [Mat´ıa 1998] F. Mat´ıa y A. Jim´enez, Multisensor fusion: an autonomous mobile robot, Journal of Intelligent and Robotic Systems, 22, 1998, pp. 129-141, Kluwer Academic Publishers. [Moravec 1988] H.P. Moravec, Certainty grids for sensor fusion in mobile robots, AI Magazine, Vol 9#2, pp. 61-77, 1988. [Murphy 1998] Robin R. Murphy, Dempster-Shafer theory for sensor fusion in autonomous mobile robots IEEE Transactions on Robotics and Automation, Vol 14#2, pp 197-206, April 1998. [Oriolo 1997] G. Oriolo, G. Ulivi, M. Venditelli, Fuzzy maps: a new tool for mobile robot perception and planning, Journal of Robotic Systems, Vol 14#3, pp. 179-197, 1997. [Oriolo 1998] G. Oriolo, G. Ulivi, M. Venditelli, Real-time map building and navigation for autonomous robots in unknown environments, IEEE Transactions on Systems, Man and Cybernetics, Part B-cybernetics, Vol 28#3, June 1998. [Pagac 1998] D. Pagac, E. Nebot, H. Durrant-Whyte, An evidential approach to probabilistic map-building, IEEE Transactions on Robotics and Automation, Vol 14#4, August 1998, pp. 623-629. [Peignot 1998] C. Peignot, F. Wawak, F. Mat´ıa y E.A. Puente, Integration of heterogeneus world mapping techniques in the navigation system of an autonomous mobile robot, Computer Vision and Mobile Robotics Workshop CVMR’98, Santorini (Greece), 1998. [Poloni 1995] M. Poloni, G. Ulivi, M. Venditelli, Fuzzy logic and autonomous vehicles: experiments in ultrasonic vision Fuzzy Sets and Systems 69, pp. 15-27, 1995. [Ribo 2001] M. Ribo, A. Pinz, A comparison of three uncertainty calculi for building sonar-based occupancy grids, Robotics and Autonomous Systems, Vol 35, 2001, pp. 201-109, Elsevier.