Marine Policy 58 (2015) 42–50
Contents lists available at ScienceDirect
Marine Policy journal homepage: www.elsevier.com/locate/marpol
Dynamic ocean management: Defining and conceptualizing real-time management of the ocean Sara M. Maxwell a,b,n, Elliott L. Hazen c, Rebecca L. Lewison d, Daniel C. Dunn e, Helen Bailey f, Steven J. Bograd c, Dana K. Briscoe a, Sabrina Fossette c, Alistair J. Hobday g, Meredith Bennett h, Scott Benson i, Margaret R. Caldwell h,j, Daniel P. Costa k, Heidi Dewar l, Tomo Eguchi i, Lucie Hazen h, Suzanne Kohin l, Tim Sippel l, Larry B. Crowder a,h a
Stanford University, Hopkins Marine Station, Pacific Grove, CA, USA Old Dominion University, Department of Biological Sciences, Norfolk, VA, USA NOAA National Marine Fisheries Service, Southwest Fisheries Science Center, Environmental Research Division, Pacific Grove, CA, USA d San Diego State University, Biology Department, San Diego, CA, USA e Duke University Marine Laboratory, Beaufort, NC, USA f University of Maryland Center for Environmental Science, Chesapeake Biological Laboratory, Solomons, MD, USA g Commonwealth Scientific and Industrial Research Organisation, Hobart, Australia h Center for Ocean Solutions, Stanford University, Monterey, CA, USA i NOAA National Marine Fisheries Service, Southwest Fisheries Science Center, Marine Mammal and Turtle Division, La Jolla, CA, USA j Stanford Law School, Stanford University, Palo Alto, CA, USA k University of California Santa Cruz, Long Marine Laboratory, Santa Cruz, CA, USA l NOAA National Marine Fisheries Service, Southwest Fisheries Science Center, Fisheries Resources Division, La Jolla, CA, USA b c
art ic l e i nf o
a b s t r a c t
Article history: Received 5 January 2015 Received in revised form 4 March 2015 Accepted 13 March 2015
Most spatial marine management techniques (e.g., marine protected areas) draw stationary boundaries around often mobile marine features, animals, or resource users. While these approaches can work for relatively stationary marine resources, to be most effective marine management must be as fluid in space and time as the resources and users we aim to manage. Instead, a shift towards dynamic ocean management is suggested, defined as management that rapidly changes in space and time in response to changes in the ocean and its users through the integration of near real-time biological, oceanographic, social and/or economic data. Dynamic management can refine the temporal and spatial scale of managed areas, thereby better balancing ecological and economic objectives. Temperature dependent habitat of a hypothetical mobile marine species was simulated to show the efficiency of dynamic management, finding that 82.0 to 34.2 percent less area needed to be managed using a dynamic approach. Dynamic management further complements existing management by increasing the speed at which decisions are implemented using predefined protocols. With advances in data collection and sharing, particularly in remote sensing, animal tracking, and mobile technology, managers are poised to apply dynamic management across numerous marine sectors. Existing examples demonstrate that dynamic management can successfully allow managers to respond rapidly to changes on-the-water, however to implement dynamic ocean management widely, several gaps must be filled. These include enhancing legal instruments, incorporating ecological and socioeconomic considerations simultaneously, developing ‘out-of-the-box’ platforms to serve dynamic management data to users, and developing applications broadly across additional marine resource sectors. & 2015 The Authors. Published by Elsevier Ltd. This is an open access article under the CC BY-NC-ND license (http://creativecommons.org/licenses/by-nc-nd/4.0/).
Keywords: Adaptive management Fisheries management Marine spatial planning Mobile marine protected areas Real-time management Shipping
n Corresponding author at: Old Dominion University, Department of Biological Sciences, Norfolk, VA 23529, USA. Tel.: þ 1 206 355 3249. E-mail addresses:
[email protected] (S.M. Maxwell),
[email protected] (E.L. Hazen),
[email protected] (R.L. Lewison),
[email protected] (D.C. Dunn)
[email protected] (H. Bailey),
[email protected] (S.J. Bograd),
[email protected] (S. Fossette),
[email protected] (A.J. Hobday),
[email protected] (M. Bennett),
[email protected] (S. Benson),
[email protected] (M.R. Caldwell),
[email protected] (D.P. Costa),
[email protected] (H. Dewar),
[email protected] (T. Eguchi),
[email protected] (L. Hazen),
[email protected] (S. Kohin),
[email protected] (T. Sippel).
1. Introduction Marine resource management has historically paralleled management in terrestrial systems [1]. Marine protected areas, marine spatial planning, and quota-based systems (e.g., individual transferable quotas, bag limits) are all based on terrestrial management [2–7], but the open oceans differ from terrestrial systems in several important ways. In terrestrial and nearshore marine systems,
http://dx.doi.org/10.1016/j.marpol.2015.03.014 0308-597X/& 2015 The Authors. Published by Elsevier Ltd. This is an open access article under the CC BY-NC-ND license (http://creativecommons.org/licenses/by-nc-nd/4.0/).
S.M. Maxwell et al. / Marine Policy 58 (2015) 42–50
stationary or long-lived primary producers often create or aid in the creation of habitat structure (e.g., terrestrial forests, grasslands; kelp forests, seagrass beds, coral reefs) [5,8]. In contrast, marine autotrophs in pelagic systems are primarily microscopic and short-lived, and three-dimensional habitat structure is instead created by oceanographic features where primary producers are retained, forming the foundation for food webs that attract larger consumers [9,10]. Additionally, compared with terrestrial ecosystems, the oceans are in constant flux, affecting the species and resource users which are being managed. Physical forcing of the oceanographic seascape spans multiple spatial and temporal scales [9], and dynamic biogeographic provinces are delineated by these oceanographic variables [11]. Oceanographic features that both animals and resource users follow, like fronts and eddies, move dynamically across similar scales [9,12,13]. While fisheries often focus on coarse-scale features such as the upwelling domain of eastern boundary currents [14], fisheries catch rates often vary at spatio-temporal scales matching fine-scale oceanographic features [15,16]. Similarly, animal migrations and foraging or breeding aggregations track dynamic oceanographic features across multiple scales [17–21], making habitat more difficult to define than in terrestrial systems. Because the scale of temporal and spatial variability in the oceans is unmatched in terrestrial systems, terrestrially-derived management approaches may be too static for dynamic marine systems [2,9,10,22]. The ocean itself and the majority of ocean uses (e.g., shipping, fishing) are highly dynamic, but the majority of marine management approaches (e.g., marine protected areas, marine spatial planning, total allowable catches and quota setting) are relatively static [2,23–26]. To meet the challenge of managing this highly dynamic system, management must become as fluid in space and time as both the marine environment and the marine resource users [2,27].
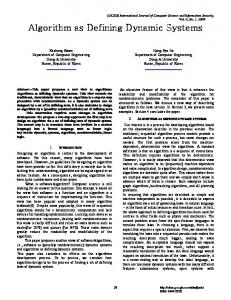
2. Dynamic ocean management Mismatches in the rate and scale at which either the marine environment changes or marine resource users act, and, in some cases, the speed with which marine resource management responds, may result in decreased efficiency and effectiveness. Toward this end, it is suggested that managers make a shift towards dynamic ocean management, defined as ‘management that changes rapidly in space and time in response to the shifting nature of the ocean and its users based on the integration of new biological, oceanographic, social and/or economic data in near real-time’ (Fig. 1). Application of dynamic management requires a shift from static management measures to near real-time management. In dynamic management approaches, we can integrate: (1) existing datasets, such as remote sensing, animal tracking or fisheries observer data, (2) advanced analytical processing and modeling techniques that allow us to predict key species distributions, user behavior or oceanographic habitats in space and time, and (3) rapid datasharing technology such as handheld devices to implement dynamic tools that respond at finer scales than have been implemented in the past. This kind of approach has only become practical in recent decades due to improvements in related technology, and due to long-term datasets on which models can be based, and datasets that will be reliably collected into the future, such via remote sensing. While dynamic management does not necessarily require a full suite of advanced technology, the capacity exists to integrate multiple data types and technology platforms. Remote sensing data are readily and often freely available [28]. Advances in animal tracking data have allowed a greater understanding of animal movement and habitats in near real-time [17,29]. Analytical processing has advanced to allow us to predict animal habitats
43
using animal distribution data and habitat modeling techniques that incorporate near real-time remote sensing data [30–32]. Further, these models can integrate numerous data sources such as animal tracking, at-sea surveys, industry observer or usercollected data. Equally critical, data sharing technologies exist to support dynamic management [33]. Low-technology communication via radio or email is readily available and more complex communication systems through mobile technology (e.g., smartphones and tablets), and corresponding satellite and cellular data capabilities, are rapidly improving and declining in cost [34,35]. These technologies are more than adequate to engage ocean users in the two-way data sharing required by dynamic management approaches.
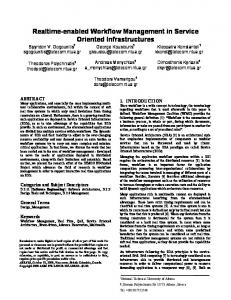
2.1. Dynamic management in practice Dynamic ocean management is perhaps best illustrated by existing examples. In practice, dynamic ocean management has been applied across several sectors using both voluntary and compulsory measures [36,37]. The complexity of data driving dynamic management may vary – from simple compilation of user-generated data, to complex habitat modeling approaches – and all incorporate new data on time scales from days to months (Fig. 2). Fishermen in the New England scallop fishery voluntarily report bycatch of yellowtail flounder (Limanda ferruginea) on a daily basis to the School of Marine Science and Technology (SMAST), University of Massachusetts Dartmouth. SMAST then compiles the bycatch data by fishing block and distributes it by email the following day to scallop fishermen, instructing them which areas to avoid (Fig. 2a). Since the program started in 2010, fishermen have been able to fish the entire duration of the scallop season, resulting in economic gains upwards of $10 million/year over previous years [38]. In the East Australian multispecies longline fishery, managers regulate fishing effort and allocate observer coverage for quota-managed southern bluefin tuna (Thunnus maccoyii) [39,40] using real-time habitat predictions based on tuna’s temperature-dependent habitat preferences (Fig. 2b). Using expected habitat preferences of the fish and seasonal forecasts of environmental conditions, scientists have developed models that predict where tuna are likely to occur in coming months, and as a result fishermen have avoided long-term costs associated with going over quota limits [30]. Similarly, TurtleWatch is a program developed by the NOAA Pacific Islands Fisheries Science Center designed to reduce bycatch of loggerhead sea turtles (Caretta caretta) in the shallow-set longline fishery based in Hawaii (Fig. 2c) [41]. NOAA scientists determined the temperature preferences of loggerhead turtles using satellite tracking and highlight areas longline fishermen should avoid to reduce sea turtle bycatch. This information is posted online every several days, based on the movements of temperature fronts in the Central North Pacific. In a non-fishery application, passive acoustic buoys and aerial surveys are used to detect the realtime presence of North Atlantic right whales (Eubalaena glacialis) along the US East Coast to reduce lethal ship strikes of this critically endangered species (Fig. 2d) [42]. Dynamic management area locations are distributed to ship captains via mobile applications to alert them to the whales' presence and to recommend avoiding areas or reducing speeds when whales are present [43–45]. Dynamic management areas are also paired with traditional seasonal closures of the whales' breeding grounds [42]. The ability to use near-real time management responses goes beyond animal distribution information; applications exist that integrate resource user distribution as well, including tools that leverage mobile technology. eCatch, a program designed by The Nature Conservancy, uses smartphones and tablets to rapidly share data on the location and amount of bycatch species, and has allowed the central California groundfish fishery to remain below fishery-wide quotas [46]. While these and
44
S.M. Maxwell et al. / Marine Policy 58 (2015) 42–50
Fig. 1. Schematic of dynamic ocean management. Multiple data types can be integrated in dynamic management including biological, remotely-sensed, socio-economic and user distribution data. Data is processed and then distributed to users (e.g., managers, resource users), often taking advantage of mobile data-sharing technologies such smartphones and tablets.
other examples of dynamic management exist [36,37], this approach has the capability to be greatly expanded.
3. Enhancing traditional management with dynamic ocean management Dynamic management has the capacity to enhance traditional management in several ways. In contrast to traditional management, dynamic ocean management more closely aligns management response times with the scales of variability in the environment, in marine species movements, and in resource use. While traditional marine spatial management techniques such as shipping lanes or fishery time-area closures can achieve similar objectives as dynamic management, traditional spatial closures are not responsive to rapid changes on-the-water. As a result, they may incorporate larger areas or times to achieve the same objectives (e.g., incorporating changing animal habitat over multiple seasons and years using large static area closures) [36]. In a simple example similar to TurtleWatch, the habitat of a species with temperature dependent habitat was simulated, ranging from 12 to 151 C sea surface temperature dependance (Fig. 3, Table 1, Movie S1, Supplementary Material for methods). Across these temperature scenarios, annual restricted time-area was between 62.1 and 86.1 percent less in a dynamic management approach than a static management area that encompasses the same area. To simulate traditional time-area closures (e.g., static closures but over shorter time frames), time-area closures across seasons were simulated, and area managed was 82.0 to 34.2 percent less using dynamic management approaches (Table 1). When we are able to accurately describe animal habitat, dynamic management may greatly increase the efficacy of management responses over traditional approaches by reducing amount of area managed or areas closed to resource users.
Supplementary material related to this article can be found online at http://dx.doi.org/10.1016/j.marpol.2015.03.014. Such dynamic approaches can integrate well with existing management techniques and frameworks. Dynamic management can be used as an alternative to or in conjunction with traditional spatial and non-spatial management techniques (e.g., marine spatial planning, time area closures, gear shifts, single species stock assessments, and quotas). For example, dynamic management has already proven successful at limiting target catch or reducing non-target bycatch when used in conjunction with fisheries quotas [38] and individual transferable quotas [46]. It can also be used as one of a suite of tools applied to complex problems (e.g., ship strikes on whales) [42,44]. Rather than replacing existing management tools, both dynamic and traditional approaches can be used in concert to maximize management goals. 3.1. Integration of adaptive and dynamic management A number of theoretical frameworks for the governance of marine resources already exist, including adaptive management, ecosystem-based management, and systematic conservation planning [22,47,48]. It is not suggested that dynamic management replace existing frameworks, but rather be used to more efficiently implement their objectives, particularly adaptive management. The juxtaposition of the different time scales on which adaptive management and dynamic ocean management implementation operate can work in concert to create a more effective management structure. Adaptive management is decision-making via a structured, iterative framework supported by monitoring and assessment [47,49] (Fig. 4), however, adaptive management is often collaborative and as a result, a relatively slow process. The adaptive management process defines the goals of management and the rules to meet management objectives (e.g., the amount of habitat that should be closed to fishing activity to protect a
S.M. Maxwell et al. / Marine Policy 58 (2015) 42–50
45
Fig. 2. Examples of existing dynamic ocean management applications. (a) New England scallop fishery, from [38]: Grids used by scallop fishermen to denote fishing areas showing the yellowtail flounder bycatch advisory for 9 July 2010 with high (red), medium (yellow), and low (green) bycatch areas; advisories are distributed to fishermen daily. (b) East Australian multi-species longline fishery adapted from [39]: Example habitat predictions and management lines for southern bluefin tuna in the multi-species longline fishery. The core zone (red), buffer (yellow) and OK zone (green) are shown. Core zone areas may be fished by fishermen with high levels of bluefin tuna quota, while OK zone may be fished regardless of quota. The management line dividing the core and buffer zone is the lower magenta line, and the management line dividing the buffer and OK zone is the upper magenta line. (c) TurtleWatch from [41] and http://www.pifsc.noaa.gov/eod/turtlewatch.php: Shows average sea surface temperature over a 3-day period and small gray arrows show the direction and strength of the average ocean currents over the most recent week of available data. The solid black lines mark the 63.51F and 65.51F temperature contours. The red area between these lines represents the region where more than 50% of loggerhead turtle interactions have occurred during the first quarter of the year. (d) WhaleAlert from http://stellwagen.noaa.gov/protect/whalealert.html: Example image from WhaleAlert showing locations of acoustic buoys in shipping lanes of the Cape Cod region and the level of right whale activity detected. Green indicates no whale activity, yellow indicates moderate and red (not shown) indicates high whale activity. Data is distributed via a smartphone and tablet application; other data distributed includes dynamic and seasonal management areas and mandatory ship reporting areas.
species); dynamic ocean management couples into the adaptive management framework at the implementation stage by updating spatial management areas quickly using protocols that are predefined through the adaptive management process (e.g., identifying where closed habitat will be on daily, weekly or monthly timescales; Fig. 3). The space-time scale at which the rules are implemented can change rapidly and these changes can be implemented via dynamic management without needing to return to the decision-making process. The adaptive management process is where the value judgments are made (how much habitat to protect, acceptable take levels, etc.), but dynamic management can help meet these goals by putting management into action in near real-time as conditions change on-the-water.
3.2. Balancing ecological and economic objectives Ocean resource managers are frequently tasked with balancing marine resource protection with sustainable use, but these objectives are often in conflict, such as protected species bycatch under the US Endangered Species Act or Marine Mammal Protection Act, and fisheries catch under the Magnuson–Stevens Fishery Conservation and Management Act [22,50]. Static management approaches can lead to large areas being placed off-limits to human uses [51], possibly generating a considerable economic cost, as occurred in the Hawaii pelagic longline fishery where a closure to protect sea turtles in 2000 cost fishermen over US$50,000 per turtle take reduction [52]. Dynamic ocean management can result in smaller,
46
S.M. Maxwell et al. / Marine Policy 58 (2015) 42–50
Fig. 3. Dynamic ocean management in a hypothetical scenario. A large static management area (gray box) would need to incorporate a large area along the US West Coast in order to capture all animal temperature dependent habitat (13–14 1C; see Supplementary Material for methods) over the span of a year (A-D). Dynamic managed areas that follow probable animal habitat (black polygons) would allow for smaller, mobile areas to be managed on a monthly basis, leaving more areas open to human activities. For animated version, see Movie S1.
dynamic management boundaries, providing protection equal to large-scale closures but with less impact on resource users, as demonstrated in the New England scallop fishery and the East Australian multi-species longline fishery [38,39] (Fig. 3, Supplementary Material, and Movie S1). 3.3. Reducing conflicts Dynamic management may also result in fewer conflicts between managers and resource users by reducing the spatio-temporal scope of management actions – and thereby creating a more politically palatable and sustainable process, potentially increasing compliance [37,40]. Knowing the likelihood of protected species occurrence in space and time may, for example, mean the difference between closing an entire fishery and regulating just a portion of the fishing
grounds through time [30]. These more flexible management approaches can potentially support high levels of compliance even when measures are voluntary; in some instances, applications of dynamic ocean management have resulted in increased compliance because the impact of management measures on resource users is being considered within the process, thus likely engendering greater buy-in by users [37,53]. Further, in existing dynamic management applications, stakeholders are included in the data collection process, often using handheld technology [38,46]; this inclusion can increase participation, buy in and potential compliance, though challenges do exist for data sharing of this kind [54]. Finally, by explicitly considering economic impacts (see Section 4 below) and reducing the spatio-temporal scale over which restrictions are implemented, dynamic management may represent the closest to a ‘win-win’ scenario that can be achieved.
54.0 68.1
72.3
62.1
825,680; 228,356
826,080; 313,204
438,320; 776,280 34.2 568,680; 374,022
43.5
330,860; 105,553
727,880; 334,922
65.8 712,300; 243,678 73.4 327,720; 87,244 42.9 431,920; 246,627
% difference between static and dynamic 86.1
Temperature dependency range 13–14 1C (11 total) 13-15 1C (21 total) 12–15 1C (31 total)
Static; Dynamic (mean monthly km2) 726,620; 100,806
772,560; 335,873
Static; Dynamic (mean monthly km2) 614,960; 138,049 % difference between static and dynamic 62.9 Static; Dynamic (mean monthly km2) 336,800; 124,964
56.2
% difference between static and dynamic 79.3 Static; Dynamic (mean monthly km2) 523,900; 108,576 Static; Dynamic (mean monthly km2) 175,580; 31,638
Spring
% difference between static and dynamic 77.6
% difference between static and dynamic 82.0
Fall Summer
47
4. Barriers and future directions
Winter Annual
Table 1 Dynamic ocean management in a hypothetical scenario. The managed or restricted time-area in static and dynamic management scenarios, using simulated, temperature-dependent species habitat, where sea surface temperature (SST) dependance ranges from 12–15 1C SST; time-area is calculated annually and across seasons. The percent difference is the difference in time-area between the mobile and static scenarios.
S.M. Maxwell et al. / Marine Policy 58 (2015) 42–50
Dynamic management can be widely applied; however, barriers to dynamic management exist. More complex dynamic habitat models depend on maintenance of remote sensing systems and satellites to fine-tune habitat projections. This dependence on monitoring programs could be problematic if key satellites go out of service and are not replaced [55]. Like other forms of management, dynamic ocean management has ongoing costs for data analysis and the necessary infrastructure for communication to resource users, as well as potential need for continued or occasional addition data collection for monitoring biological species (e.g., additional satellite tracking studies or boat-based surveys) [55]. Further, if dynamic habitat models are produced for target species of fisheries, rather than protected species, models could increase efficiency of exploitation. This approach can lead to cleaner harvests, but overall exploitation rates need to be monitored to avoid overfishing. 4.1. Compliance and enforcement Compliance and enforcement are perhaps some of the largest barriers to dynamic management. While compliance may increase in dynamic management scenarios (see Section 3.4 above), compliance and enforcement issues exist across marine resource management, and the spatio-temporal complexity of dynamic management poses additional challenges. Dynamic management shares enforcement challenges with pelagic marine protected areas and offshore fisheries in that dynamic management is likely to be applied in offshore, largely out-of-sight systems [27,56]. While social, legal and technological challenges to cost-effective enforcement exist [55], new cooperative and non-cooperative monitoring capabilities are increasing and rapidly evolving, such as gliders and vessel monitoring systems, and on-board electronic monitoring [56]. Still, proper incentive structures, such as those identified by Little et al. [37], have the potential to increase compliance and reduce the need for enforcement, and can result in compliance even in voluntary dynamic management [38]. Without proper incentives, however, dynamic management has shown to be ineffective [45], so increased socio-economic research into how to structure incentives that engender buy-in across both voluntary and compulsory approaches is critical to successful dynamic management. Additionally, dynamic management approaches need to be explicitly tested to be sure that increased ecological and economic efficiency is not lost if compliance is low, or enforcement is too costly; in such scenarios static management may be more efficient. 4.2. Gaps to large-scale implementation To address these concerns and for dynamic ocean management to be widely used, several additional gaps need to be filled. First, there are limitations to the use of dynamic, flexible management structures in domestic and international legislative instruments that must be addressed, particularly data-sharing, confidentiality, data security and enabling policies [55]. Second, current applications of dynamic management focus on a single management objective (e.g., reducing impact on a single protected or low-quota species). Inclusion of multiple management objectives into a single application must be demonstrated to show the full capacity of dynamic management for the marine environment [36]. Approaches that, for example, predict spatial bycatch patterns [57] and that determine the socioeconomic impacts of fisheries managed within spatial and non-spatial frameworks [58], have been developed independently but not yet considered in concert. Such approaches require the incorporation of socioeconomic, physical, and biological data simultaneously. Explicitly incorporating trade-off analyses [59] and management strategy
48
S.M. Maxwell et al. / Marine Policy 58 (2015) 42–50
ASSESS
ADJUST
DESIGN
ADAPTIVE MANAGEMENT EVALUATE
IMPLEMENT
MONITOR
Near real-time implementation of adaptive management regulations
DYNAMIC MANAGEMENT
Spatio-temporal sampling & forecasting
Fig. 4. Integration of dynamic ocean management with adaptive management. Adaptive management is constructed of several steps including making value judgments about how marine resources will be managed. Dynamic ocean management couples into the adaptive management process by using spatio-temporal data to rapidly implement adaptive management protocols in near real-time as conditions change on-the-water.
evaluations [60] into dynamic management responses will result in better and more rapid on-the-ground responses that can further balance ecological and economic objectives. Finally, while the technological components exist, better tools need to be built to serve these applications that incorporate many complex data types. Some platforms exist, such as SeaSketch and eCatch [46,61], as do the statistical tools to support expansion of these platforms to incorporate more complex models [62], but these applications need additional development to incorporate multiple, near real-time, dynamic variables and a suite of analytical approaches. Given the exponential rate of mobile application development, the capability exists but more readily available, ‘out-of-the-box’ tools that allow for rapid analysis and serving of data back to users will expand use and reduce costs for implementing dynamic management.
expanded to include other marine resource sectors including marine renewable resources, additional military applications, and perhaps most critically, mobile marine protected areas. Much of the theory and application of dynamic management can be readily applied to mobile marine protected areas to protect highly mobile species of concern, or track mobile oceanographic features as they move through the ocean particularly in the face of climate change [24,31,63,64]. Dynamic management approaches can provide the flexibility to incorporate the real-time, small-scale changes that add up to largescale shifts resulting from climate change and interannual variability in the marine environment. Such flexibility and responsiveness will lead to greater sustainability of marine ecosystems in the digital age.
5. Conclusion
Acknowledgments
The technology and data capacity (e.g., remote sensing, smartphone technology) exist to apply dynamic ocean management, particularly in developed countries, and dynamic management has particularly strong applications in pelagic ecosystems. The processing and analytical capability now exists to integrate disparate datasets, to produce reliable forecasts at appropriate timescales, and to communicate with vessels at sea, permitting resource users to adapt to management measures in near real time. Even in developing countries, the expansion of low-cost cellular coverage makes the application of dynamic management applications feasible [34,35]. While most applications of dynamic management revolve around fishing and shipping industries, its application can be
Funding provided by the Center for Ocean Solutions and NASA Research Opportunities in Space and Earth Sciences (ROSES) grant 12-ECOF12-0052. D.C. Dunn was supported by the NF-UBC Nereus Program. We thank Drew Briscoe for graphic design assistance, and Lisa Wedding for insightful comments. The authors dedicate this work to the memory of Dave G. Foley.
Appendix A. Supporting information Supplementary data associated with this article can be found in the online version at http://dx.doi.org/10.1016/j.marpol.2015.03. 014.
S.M. Maxwell et al. / Marine Policy 58 (2015) 42–50
References [1] Peel D, Lloyd MG. The social reconstruction of the marine environment: towards marine spatial planning? Town Plan Rev 2004;75:359–78. [2] Hyrenbach KD, Forney KA, Dayton P. Marine protected areas and ocean basin management. Aquat Conserv: Mar Freshwat Ecosyst 2000;10:437–58. [3] Sears PB. Ecological basis of land use and management. Nature 1940;146:309. [4] Duck RW. Marine spatial planning: managing a dynamic environment. J Environ Policy Plan 2012;14:67–79. [5] Carr MH, Neigel JE, Estes JA, Andelman S, Warner RR, Largier JL. Comparing marine and terrestrial ecosystems: implications for the design of coastal marine reserves. Ecol Appl 2003;13:S90–107. [6] Tyldesley D, Hunt D. Review of how the land use planning system could influence the development of a marine spatial planning system for England. English Nature Research Reports. Peterborough; 2003. p. 38. [7] Miller SD. Population management of bears in North America. Bears: Biol Manag 1990;8:357–73. [8] Levin SA. Patchiness in marine and terrestrial systems – from individuals to populations. Philos Trans R Soc Lond Ser B-Biol Sci 1994;343:99–103. [9] Steele JH. Marine ecosystem dynamics – comparison of scales. Ecol Res 1991;6:175–83. [10] Steele JH. A comparison of terrestrial and marine ecological systems. Nature 1985;313:355–8. [11] Reygondeau G, Longhurst A, Martinez E, Beaugrand G, Antoine D, Maury O. Dynamic biogeochemical provinces in the global ocean. Glob Biogeochem Cycles 2013;27:1046–58. [12] Stommel H. Varieties of oceanographic experience. Science 1963;139:572. [13] Yasuda I, Okuda K, Hirai M. Evolution of a Kuroshio warm-core ring – variability of the hydrographic structure. Deep-Sea Res Part A-Oceanogr Res Papers 1992;39:S131. [14] Gutierrez M, Swartzman G, Bertrand A, Bertrand S. Anchovy (Engraulis ringens) and sardine (Sardinops sagax) spatial dynamics and aggregation patterns in the Humboldt Current ecosystem, Peru, from 1983 to 2003. Fish Oceanogr 2007;16:155–68. [15] Dell J, Wilcox C, Hobday AJ. Estimation of yellowfin tuna (Thunnus albacares) habitat in waters adjacent to Australia's East Coast: making the most of commercial catch data. Fish Oceanogr 2011;20:383–96. [16] Soykan CU, Eguchi T, Kohin S, Dewar H. Prediction of fishing effort distributions using boosted regression trees. Ecol Appl 2014;24:71–83. [17] Block BA, Jonsen ID, Jorgensen SJ, Winship AJ, Shaffer SA, Bograd SJ, et al. Tracking apex marine predator movements in a dynamic ocean. Nature 2011;475:86–90. [18] Yen PPW, Sydeman WJ, Bograd SJ, Hyrenbach KD. Spring-time distributions of migratory marine birds in the southern California Current: oceanic eddy associations and coastal habitat hotspots over 17 years. Deep-Sea Res Part IITop Stud Oceanogr 2006;53:399–418. [19] Wingfield DK, Peckham SH, Foley DG, Palacios DM, Lavaniegos BE, Durazo R, et al. The making of a productivity hotspot in the coastal ocean. PLoS ONE 2011:6. [20] Hazen EL, Suryan RM, Santora JA, Bograd SJ, Watanuki Y, Wilson RP. Scales and mechanisms of marine hotspot formation. Mar Ecol Prog Ser 2013;487:177–83. [21] Pikesley SK, Maxwell SM, Pendoley K, Costa DP, Coyne MS, Formia A, et al. On the front line: integrated habitat mapping for olive ridley sea turtles in the southeast Atlantic. Divers Distrib 2013. [22] Crowder L, Norse E. Essential ecological insights for marine ecosystem-based management and marine spatial planning. Mar Policy 2008;32:772–8. [23] Foley MM, Halpern BS, Micheli F, Armsby MH, Caldwell MR, Crain CM, et al. Guiding ecological principles for marine spatial planning. Mar Policy 2010;34:955–66. [24] Maxwell SM, Hazen EL, Bograd SJ, Halpern BS, Breed GA, Nickel B, et al. Cumulative human impacts on marine predators. Nat Commun 2013;4:2688. [25] Agardy MT. Advances in marine conservation – the role of marine protected areas. Trends Ecol Evol 1994;9:267–70. [26] Norse E, Crowder LB, Gjerde K, Hyrenbach KD, Roberts C, Safina C, et al. Placebased ecosystem management in the open ocean. In: Norse E, Crowder LB, editors. Marine conservation biology. Washington: Island Press; 2005. p. 302–27. [27] Game ET, Grantham HS, Hobday AJ, Pressey RL, Lombard AT, Beckley LE, et al. Pelagic protected areas: the missing dimension in ocean conservation. Trends Ecol Evol 2009;24:360–9. [28] Rundel PW, Graham EA, Allen MF, Fisher JC, Harmon TC. Environmental sensor networks in ecological research. New Phytol 2009;182:589–607. [29] Hazen EL, Maxwell SM, Bailey H, Bograd SJ, Hamann M, Gaspar P, et al. Ontogeny in marine tagging and tracking science: technologies and data gaps. Mar Ecol Prog Ser 2012;457:221–40. [30] Hobday AJ, Hartog JR, Spillman CM, Alves O. Seasonal forecasting of tuna habitat for dynamic spatial management. Can J Fish Aquat Sci 2011;68:898–911. [31] Hazen EL, Jorgensen SJ, Rykaczewski R, Bograd SJ, Foley DG, Jonsen ID, et al. Predicted habitat shifts of Pacific top predators in a changing climate. Nat Clim Change 2012;3:234–8. [32] Halpin PN, Read AJ, Best BD, Hyrenbach KD, Fujioka E, Coyne MS, et al. OBISSEAMAP: developing a biogeographic research data commons for the ecological studies of marine mammals, seabirds, and sea turtles. Mar Ecol Prog Ser 2006;316:239–46.
49
[33] Teacher AGF, Griffiths DJ, Hodgson DJ, Inger R. Smartphones in ecology and evolution: a guide for the app-rehensive. Ecol Evol 2013;3:5268–78. [34] Alfaro-Shigueto J, Mangel JC, Dutton PH, Seminoff JA, Godley BJ. Trading information for conservation: a novel use of radio broadcasting to reduce sea turtle bycatch. Oryx 2012;46:332–9. [35] Kefela GT. The impact of mobile phone and economic growth in developing countries. Afr J Bus Manag 2011;5:269–75. [36] Dunn DC, Boustany AM, Halpin PN. Spatio-temporal management of fisheries to reduce by-catch and increase fishing selectivity. Fish Fish 2011;12:110–9. [37] Little AS, Needle CL, Hilborn R, Holland DS, Marshall CT. Real-time spatial management approaches to reduce bycatch and discards: experiences from Europe and the United States. Fish Fish 2014. http://dx.doi.org/10.1111/ faf.12080:1-27. [38] O’Keefe CE, DeCelles GR. Forming a Partnership to Avoid Bycatch. Fisheries 2013;38:434–44. [39] Hobday AJ, Hartog JR, Timmiss T, Fielding J. Dynamic spatial zoning to manage southern bluefin tuna (Thunnus maccoyii) capture in a multi-species longline fishery. Fish Oceanogr 2010;19:243–53. [40] Hobday AJ, Hartmann K. Near real-time spatial management based on habitat predictions for a longline bycatch species. Fish Manag Ecol 2006;13:365–80. [41] Howell E, Kobayashi D, Parker D, Balazs G. TurtleWatch: a tool to aid in the bycatch reduction of loggerhead turtles Caretta caretta in the Hawaii-based pelagic longline fishery. Endanger Species Res 2008;5:267–78. [42] Van Parijs SM, Clark CW, Sousa-Lima RS, Parks SE, Rankin S, Risch D, et al. Management and research applications of real-time and archival passive acoustic sensors over varying temporal and spatial scales. Mar Ecol Prog Ser 2009;395:21–36. [43] Wiley D, Hatch L, Schwehr K, Thompson M, MacDonald C. Proc Mar Saf Sec Council Coast Guard J Saf Sea. Marine sanctuaries and marine planning 2013;70:10–5. [44] Conn PB, Silber GK. Vessel speed restrictions reduce risk of collision-related mortality for North Atlantic right whales. Ecosphere 2013:4. [45] Sibler GK, Adams JD, Bettridge S. Vessel operator response to a voluntary measure for reducing collisions with whales. Endanger Species Res 2012;17:245–54. [46] Molteni M. How desperation, iPads, and real-time data revived a fishery. Conservation 2013:14. [47] Walters CJ, Holling CS. Large-scale management experiments and learning by doing. Ecology 1990;71:2060–8. [48] Crowder LB, Osherenko G, Young OR, Airame S, Norse EA, Baron N, et al. Sustainability – resolving mismatches in US ocean governance. Science 2006;313:617–8. [49] Ban NC, Maxwell SM, Dunn D, Hobday AJ, Bax N, Ardron JA, et al. Better integration of sectoral planning and management approaches for the interlinked ecology of the open oceans. Mar Policy 2014;49:127–36. [50] Moore JE, Wallace BP, Lewison RL, Žydelis R, Cox TM, Crowder LB. A review of marine mammal, sea turtle and seabird bycatch in USA fisheries and the role of policy in shaping management. Mar Policy 2009;33:435–51. [51] Palumbi SR. Marine reserves and ocean neighborhoods: The spatial scale of marine populations and their management. Annu Rev Environ Resourc 2004;29:31–68. [52] Curtis R, Hicks RL. The cost of sea turtle preservation: The case of Hawaii's pelagic longliners. Am J Agric Econ 2000;82:1191–7. [53] Cinner JE, McClanahan TR, MacNeil MA, Graham NAJ, Daw TM, Mukminin A, et al. Comanagement of coral reef social-ecological systems. Proc Natl Acad Sci USA 2012;109:5219–22. [54] Stojanovic T, Green DR, Lymbery G. Approaches to knowledge sharing and capacity building: The role of local information systems in marine and coastal management. Ocean Coast Manag 2010;53:805–15. [55] Hobday AJ, Maxwell SM, Forgie J, McDonald J, Darby M, Seto K, et al. Dynamic ocean management: Integrating scientific and technological capacity with law, policy and management. Stanford Environ Law J 2014;33:125–65. [56] Maxwell SM, Ban N, Morgan LE. Pragmatic approaches for effective pelagic marine protected area management. Endanger Species Res 2014;26:59–74. [57] Zydelis R, Lewison R, Shaffer SA, Moore JE, Boustany A, Roberts J, et al. Dynamic habitat models: using telemetry data to project fisheries bycatch. In: Proceedings of the Royal Society of London Series B-Biological Sciences; 2011, http://dx.doi.org/10.1098/rspb.2011.0330. [58] Charkravorty U, Nemoto K. Modeling the effects of area closure and tax policies: a spatial-temporal model of the Hawaii longline fishery. Mar Resour Econ 2001;15:179–204. [59] White C, Halpern BS, Kappel CV. Ecosystem service tradeoff analysis reveals the value of marine spatial planning for multiple ocean uses. Proc Natl Acad Sci USA 2012;109:4696–701. [60] Levin PS, Fogarty MJ, Murawski SA, Fluharty D. Integrated ecosystem assessments: Developing the scientific basis for ecosystem-based management of the ocean. PLoS Biol 2009;7:23–8. [61] Gleason M, McCreary S, Miller-Henson M, Ugoretz J, Fox E, Merrifield M, et al. Science-based and stakeholder-driven marine protected area network planning: A successful case study from north central California. Ocean Coast Manag 2010;53:52–68. [62] Roberts JJ, Best BD, Dunn DC, Treml EA, Halpin PN. Marine Geospatial Ecology Tools: An integrated framework for ecological geoprocessing with ArcGIS, Python, R, MATLAB, and C plus. Environ Model Softw 2010;25:1197–207.
50
S.M. Maxwell et al. / Marine Policy 58 (2015) 42–50
[63] Palacios D, Bograd S, Foley D, Schwing F. Oceanographic characteristics of biological hot spots in the North Pacific: a remote sensing perspective. DeepSea Res II 2006;53:250–69.
[64] Freestone D, Varmer O, Bennett M, Wilhelm TA, Beuttler TM, Ardron J, et al. Place-based dynamic management of large-scale Ocean Places: Papahā naumokuā kea and the Sargasso Sea. Stanford Environ Law J 2014;33:191–248.
1"
Supplementary Material
2"
Dynamic Ocean Management for a Dynamic Marine Environment
3" 4"
Methods
5"
Following the concept of TurtleWatch [41]
6"
(http://www.pifsc.noaa.gov/eod/turtlewatch.php), monthy GHRSST Global 1-km sea
7"
surface temperature (SST), aggregated to 0.04 degrees for a period of 36 months (2003-
8"
2005) was downloaded from NOAA’s Coastwatch website
9"
(http://coastwatch.pfeg.noaa.gov) and used to represent temperature-dependent habitat of
10"
a marine species, simulated across three temperature ranges: 13-14°C (1°C difference),
11"
13-15°C (2°C difference) and 12-15°C (3°C difference). Calculations were conducted
12"
across several years to incorporate interannual variability and similar methods could be
13"
applied to other dynamic marine animal habitats.
14"
We calculated restricted or managed time-area (M) as the area being restricted or
15"
managed (a, in km2) multiplied by the time (t, months) it is managed or restricted. This
16"
analysis was conducted across seasons (winter: January-March; spring: April-June;
17"
summer: July-September; fall: October-December) and across all months of the years
18"
across all three years. For dynamic management areas, managed time-area was calculated
19"
as:
20"
M=Σaxt
(1)
21"
For static management areas, managed time-area was calculated as the union of all areas
22"
across a season or year times the number of months being managed (seasonal: 9 months
23"
across 3 years; annual: 36 months across 3 years), or:
24"
U a x t.
(2)
25"
Movie S1. Animated dynamic ocean management in a hypothetical scenario. A large
26"
static closure (grey box) would need to incorporate a large area along the US West Coast
27"
in order to capture all animal habitat over the span of several months. Dynamic managed
28"
areas that follow probable animal habitat (black polygons) would allow for smaller,
29"
mobile areas to be managed on a monthly basis, leaving more areas open to human
30"
activities.