J Psychopathol Behav Assess (2013) 35:173–185 DOI 10.1007/s10862-012-9331-4
Dynamic of Change in Pathological Personality Trait Dimensions: A Latent Change Analysis Among at-Risk Women Baptiste Barbot & Scott R. Hunter & Elena L. Grigorenko & Suniya S. Luthar Published online: 21 November 2012 # Springer Science+Business Media New York 2012
Abstract This study explores longitudinally a four-factor structure of pathological personality trait dimensions (PPTDs) to examine both its structural stability and intraindividual changes among PPTDs over time. Personality Disorder (PD) scales of the Millon Clinical Multiaxial Inventory-III were administered to 361 low-income women with various psychiatric conditions (drug dependence, depression), who were followed in a two-wave study over 5-years. Cross-sectional and longitudinal factor analyses outlined a robust factorial structure of PPTDs, extrinsically invariant over time, representing Negative Emotionality, Introversion, Antagonism and Impulsivity. Despite moderate rank-order stability in the PPTDs, results also indicated substantial intra-individual variability in the degree and direction of change, consistent with trajectories of change in participants’ clinical diagnoses. Results are discussed in light of current debates on the structure and dynamic of pathological personality. Keywords Pathological personality . Personality disorders . MCMI . Longitudinal factor analysis B. Barbot : E. L. Grigorenko : S. S. Luthar Yale University, New Haven, CT, USA S. R. Hunter University of California, Los Angeles, CA, USA E. L. Grigorenko Moscow State University, Moscow, Russia E. L. Grigorenko : S. S. Luthar (*) Department of Counseling and Clinical Psychology, Teachers College, Columbia University, P.O. Box 133, West 120th Street, New York, NY 10027, USA e-mail:
[email protected]
Introduction Current debates on the nature of personality disorders (PD) have included calls for an empirical structure of personality pathology to be incorporated in the new edition of the Diagnostic and Statistical Manual of Mental Disorders (DSM-5). Toward this end, cross-sectional studies of clinical and non-clinical samples have sought to identify a factor structure of pathological personality trait dimensions (PPTD) that underlie PDs. While consensus is building for a four- to five-factor structure, longitudinal evidence for this structure is lacking, precluding the structural debate to be informed by developmental data. The need for longitudinal evaluation of PPTD is highlighted by a growing body of longitudinal research reporting significant rates of change in PDs over time, a finding that calls into question the notion that PDs are stable and enduring. Thus, ongoing developments in the understanding of PD will require such studies as the present one to determine (a) whether the structure of personality pathology is stable and reproducible over time, and (b) if structural stability excludes intra-individual changes in naturalistic and/or treatment conditions. The present study integrates the structural and developmental controversies of PD in a single model, through a longitudinal structural analysis of the PD scales of the Millon Clinical Multiaxial Inventory III (MCMI-III; Millon et al. 2006) among a sample of at-risk women followed over 5-years (Luthar and Sexton 2007).
The Dimensional Nature of Personality Disorders and the Empirical Structure of Pathological Personality Traits Proposed changes to the categorical conceptualization of PDs in the American Psychiatric Association’s (APA) Diagnostic and Statistics Manual of Mental Disorders
174
(American Psychiatric Association 2000) reflect a broader conceptual question of whether to define and describe personality pathology dimensionally, as a quantitatively extreme expression of normal functioning, or categorically, as a qualitatively distinct process (Wright 2011). Limitations of the categorical model are well-recognized and dimensional models of PDs are favored by many (Eaton et al. 2011; Krueger et al. 2007; Widiger and Samuel 2005; Widiger and Simonsen 2005). As noted by Westen and Muderrisoglu (2006), virtually all these dimensional models are “trait models” derived from the factor analysis of self-report data. Research on the empirical structure of pathological personality trait dimensions (PPTDs) has identified four broad domains appearing with reasonable consistency in cross-sectional studies. They include: (a) negative emotionality or emotional dysregulation, (b) introversion or detachment, (c) antagonism, and (d) disinhibition (Krueger et al. 2011; Livesley 2007; Sheets and Craighead 2007; Widiger and Simonsen 2005). Many studies (e.g., Tackett et al. 2008), and meta-analyses (e.g., O'Connor 2005), have identified these same domains that purportedly tap the core traits underlying pathological personality functioning through structural analysis of numerous self-rated pathological personality inventories. Many have also observed that these four factors are recognizable as maladaptive variants of “normal” personality, as operationalized for instance with the Five Factor Model (FFM) of personality (e.g., Lenzenweger 2010; Widiger and Costa In press). Therefore, researchers and clinicians alike have advocated for the reconceptualization of personality pathology within the multidimensional space of a “normal” personality model such as the FFM (e.g., Lynam in press; Markon et al. 2005; O'Connor 2005; Samuel and Gore in press). Accordingly, meta-analyses have confirmed the relationship between current DSM personality disorders and the FFM, with strong relationships observed in four of the five domains, excepting the domain of Openness, which overlaps only weakly (Samuel and Widiger 2008). Consistently, the maladaptive variant of Openness (often referred to as Psychoticism, and covering major features of Schizotypal PD) is the smallest (Widiger and Simonsen 2005) and least stable, and as such is often under-identified in factor analyses of PD inventories that are not specifically designed to capture this domain, while the other domains appears with great consistency in many PD inventories. For example, attempts to validate the theoretical model of personality pathology underlying the MCMI-III have found little consistency for the presumed theoretical model (Mullins-Sweatt and Widiger 2007; O'Connor and Dyce 1998). In addition, questions have emerged regarding the ability of this instruments to discriminate between distinct PD categories and to serve as robust diagnostic tool in practical settings given the rather high overlap between MCMI-III PD scales (e.g., Rogers et al. 1999). This overlap
J Psychopathol Behav Assess (2013) 35:173–185
suggests that a careful examination of MCMI structure is needed to reveal the higher-order constructs (PPTDs) underlying the covariation between scale scores (Philippe Rushton and Irwing 2009). In this line, a four-factor structure often appeared to be the best underlying model with MCMI data gathered from various clinical and non-clinical samples across cultures (e.g., Cuevas et al. 2008; Dyce et al. 1997; Rossi et al. 2010). These four factors have been observed to align well with the four PPTDs introduced above (Krueger et al. 2011; Rossi et al. 2010), thus further supporting the relevance of the four-factor model of maladaptive personality traits underlying PDs, as this structure is identifiable across a number of assessments of personality pathology which sample a comprehensive range of PD facets, such as the MCMI-III. In the present study, we seek to explore the extrinsic (i.e. structural) and intrinsic (i.e. within-individual) stability of this four-factor structure of PD over time, as represented in the MCMI-III. Although the MCMI was designed to understand the development and course of individual psychopathology in the context of an individuals’ personality (Millon 1983), relatively few longitudinal analyses have been conducted with this instruments.
Stability and Change of Pathological Personality Structure and Diagnosis Until recently, the empirical literature documenting long-term stability of personality pathology has been limited (Lenzenweger 1999, 2010). Moreover, most longitudinal studies on PDs have exhibited methodological problems that limited their conclusions (Skodol 2008), including ignoring inherent unreliability in the measurement of change (Ferguson 2010). A new generation of rigorous longitudinal studies of community population and clinical samples has emerged (Lenzenweger 2006; Skodol et al. 2005; Skodol 2008) and has revitalized a debate regarding the stability of PDs (Clark 2007; Krueger and Tackett 2005; Skodol 2008). Longitudinal evidence from clinical and non-clinical samples has revealed that individual change in pathology personality traits occurs for individuals both in- and out-of-treatment, and these changes differ considerably across individuals (Johnson et al. 2000; Lenzenweger et al. 2004; Watson et al. 2008). As a general trend, longitudinal studies suggest that personality pathology improves over time (i.e. symptoms decrease) at significant rates (Grilo et al. 2004, 2010; Johnson et al. 2000; Lenzenweger et al. 2004; Lenzenweger 2010; Sanislow et al. 2009; Skodol et al. 2005; Skodol 2008). However, several studies report rank-order and mean-level stability difference according to the diagnostic approach used: dimensional or categorical (Johnson et al. 2000; Samuel et al. 2011). The dimensional system yields significantly greater stability, especially when using self-report questionnaires as
J Psychopathol Behav Assess (2013) 35:173–185
opposed to structured interviews (Samuel et al. 2011). These findings suggest conceptual limitations inherent in categorical models of PDs, in particular, the use of arbitrary thresholds (Grilo et al. 2004) leading to measurement error in diagnosis (Clark 2007). Research has also evidenced differential stability across PD categories regardless of the method for diagnosis (e.g., Durbin and Klein 2006; Nestadt et al. 2010). Usually, Cluster B disorders (Antisocial, Borderline, Histrionic Narcissistic) tend to exhibit the highest long-term stability (Durbin and Klein 2006). The mechanisms by which change in personality pathology occurs are still not well understood. Lenzenweger and Willett (2007) proposed that change in PD features result from changes in neurobehavioral systems that manifest as pathological personality traits. Consistently, Warner and colleagues (2004) have proposed that personality traits (such as the PPTDs) may represent causally proximal mechanisms that influence the expression and variability of PD over time. If so, a greater understanding of the dynamic of change of maladaptive personality traits is of paramount importance for both theory and treatment (see Warner et al. 2004). Despite evidence of change in personality pathology, the DSM-IV-TR still defines PDs as “stable and enduring, reflecting a persistent pattern of maladaptive personality throughout the life course” (e.g., Skodol 2008). Although evidence for such stability is mixed, researchers have made limited attempts to integrate the developmental and the structural controversies of personality traits underlying PDs, placing the “core structure” of PPTDs (i.e., the fourfactor structure outlined above) in a longitudinal perspective. Among these attempts, an integrative hypothesis suggests that PDs may be characterized by maladaptive trait constellations that are stable in their structure but can change or fluctuate in severity or expression over time (Grilo et al. 2004). Nevertheless, only Sanislow and collaborators (2009) examined the longitudinal invariance of such PD latent constructs (i.e. their “extrinsic” stability), but these constructs were not aligned with the more widely accepted maladaptive variants of the FFM, that is, the core PPTDs. Such a longitudinal examination would provide additional support for the empirical structure of personality pathology. Furthermore, longitudinal analyses of the PPTDs will likely contribute to a better understanding of PDs development and change. The objective of the present study was (a) to investigate the longitudinal stability of the four PPTDs structure by testing its factorial invariance over a 5-year delay (i.e., extrinsic stability), while examining (b) within-individual change in PPTD levels (i.e., intrinsic stability). We then compared the average levels of PPTDs as a function of various groups (such as substance-abusing, depressed, and a non-clinical group), as well as within-individual change in the PPTD levels as a function of patterns of stability, remission, and other forms of change in the clinical diagnosis as derived through an
175
external DSM-based assessment. This focus was meant to elucidate (c) the ability of the PPTD constructs to discriminate various clinical groups, and (d) their sensitivity to change in participant’s mental health condition, informing their usefulness to capture the pathological personality component of various psychopathological conditions beyond PDs solely.
Method The study sample chosen for the study consisted of high-risk clinical and non-clinical mothers, as such a population is expected to have a high prevalence of pathological personality traits. To address many methodological issues generally disregarded in the study of personality stability and change, and in particular, the unreliability in the measurement of change (Ferguson 2010), both PPTD structure and development were examined at a latent level, in a structural equation modeling framework. Participants Data used in the present study was collected through a longitudinal research project on maternal drug abuse, psychopathology, and child adaptation (Luthar and Sexton 2007). The initial sample consisted of 361 low-income mother-child dyads living in an urban area of Connecticut, who have been followed since 1996. At the launch of the project, mothers’ age ranged from 23.5 to 55.8 (Mage 0 38.2 years, SD 06.2) and included women of AfricanAmerican (51.5 %), Caucasian (34.2 %), Hispanic (6.3 %), Native American (0.8 %), Asian (0.3 %) or Mixed (5 %) descent (2 % of the participants were unidentified ethnically or culturally). Women were recruited from outpatient treatment facilities for substance abuse and other mental health problems (chiefly depression and anxiety), as well as from community settings. Therefore, the sample comprises both clinical and non-clinical groups, including a high prevalence of substance use disorders, historically associated with PDs (e.g., Jahng et al. 2011). “Clinical group” membership in this study was defined by the presence of a DSM diagnosis at the time of data collection (see “Data Analyses”). Instruments DSM Diagnoses The Computerized Version of the Diagnostic Interview Schedule (DIS-IV; Robins et al. 2000) was used to assess major psychiatric disorders as defined in the DSM-IV. The DIS-IV is a fully structured questionnaire designed to identify the presence of psychiatric disorders by quantifying psychiatric symptoms endorsed by a respondent. It offers a
176
lifetime history of symptoms as well as a diagnosis of current syndrome (a disorder is counted as current if any of its symptoms had been present within the past year). Due to the fully structured, highly standardized nature of the measure, non-clinicians may administer the DIS-IV with high level of reliability. Metric properties of the DIS-IV and previous versions have been studied extensively and showed fair to excellent level of inter-diagnostician reliability (Kappa ranging from .40 to .77 with non-clinician interviewer) with various samples, including substance abusers (e.g., Dascalu et al. 2001), and strong agreement between other DSM instruments (e.g., Hasin and Grant 1987) supporting its good criterion validity (Malgady et al. 1992).
J Psychopathol Behav Assess (2013) 35:173–185
complete (with complete data at both T1 and T2) and incomplete respondents (with complete data at only T1), indicating that attrition was not biased toward a particular clinical group (χ2 02.4, df03, p0.49). Data Analyses Grouping DSM Diagnosis and Trajectories of Change in Diagnosis
Procedure
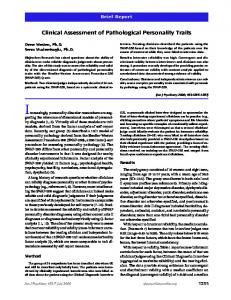
Current DSM diagnoses for both T1 and T2 (determined with the DIS-IV), were first stratified into four main groups at each measurement occasion in view of planned analyses: Substance only (substance dependence without affective/ anxiety disorders); affective/anxiety only (depressive or anxiety diagnoses without substance dependence), comorbid (substance dependence and affective/anxiety diagnoses), and neither (neither substance dependence nor affective/ anxiety diagnosis). Specifically, the substance only group included 7.6 % of the sample at T1 and 3.1 % at T2. The affective/anxiety only group represented 26.7 % at T1 and 15.3 % at T2. The comorbid group represented 8 % of the participants at T1 and 3.1 % at T2. Participant with neither substance dependence nor affective/anxiety diagnosis (neither) included 57.6 % of the participants at T1 and 74 % at T2. Despite the apparent trend of reduction of clinical diagnosis between T1 and T2 (i.e., increase of the prevalence of the neither group), these group distributions mask considerable variability in the observed patterns of change. Figure 1 depicts the four-state transition matrix between DSM
All women who expressed interest in participation were screened to determine eligibility for the main research program (Luthar and Sexton 2007). Women were screened for psychotic features and excluded if they were on antipsychotic medications and/or had a history of psychosis. Before being enrolled in the research program, voluntary informed consent was obtained. After each measurement occasion, participants were compensated monetarily for their participation. The first measurement occasion of this project (T1) occurred in 1996; Participants were contacted by phone and mail to take part to the follow-up (T2) and a large part of the sample returned, after an average of 60 months (5 years). For both measurement occasions, DIS-IV interviews were conducted by trained non-clinician interviewers, and MCMI-III protocol were self-administered. Following the MCMI-III scoring guideline (Millon et al. 2006), only complete and valid test-profiles were used. One profile at T1 and 4 profiles at T2 were invalidated. As a result, 80 % of the parent sample (N0288) presented complete data (i.e., DISIV diagnoses and MCMI scores) at both T1 and T2. Attrition analysis demonstrated that the prevalence of the various clinical groups at T1 were highly similar across
Fig. 1 Simple four-state diagram of transition in the DSM diagnosis groups over time. Values represent transition probabilities. The thickness of the lines is proportional to the probabilities of transition. Autoregressive arrows represent probability of stability. Transition path below .05 are not represented in the diagram
Personality Pathology The MCMI-III (Millon et al. 2006) is a widely used, 175-item, self-report inventory which consists of 24 clinical scales including 14 pathological personality scales. The Clinical Personality Pattern scales which represent mild to moderate personality pathologies include: Schizoid, Avoidant, Depressive, Dependent, Histrionic, Narcissistic, Antisocial, Aggressive (Sadistic), Compulsive, Negativistic, and Masochistic scales. In addition, three severe personality pathology scales are included: Schizotypal, Borderline, and Paranoid. Across contexts (such as substance abusing samples; e.g., Hesse et al. 2012), this instrument displays strong psychometric properties including proper reliability and validity (Millon et al. 2006).
J Psychopathol Behav Assess (2013) 35:173–185
diagnosis over time, revealing patterns of remission, stability, and transition across the clinical groups. For example, participants assigned to the comorbid group at T1 were mostly found in the neither group at T2. Indeed, 48 % of this group was characterized by “remission,” while 35 % “transited” to the group with depression or anxiety disorders without substance dependence (they assigned to the affective/anxiety only group). Finally, only 13 % of the members of the comorbid group at T1 remained in this group at T2. Based on the main patterns of change observed in our data, we proceeded to a second classification of participants into three main forms of change in the clinical group: “stable”, namely participants assigned to the same group at both T1 and T2 (57.8 % of the sample of complete cases); “remission”, participants assigned to a clinical group at T1 (substance only, affective/anxiety only or comorbid) and then assigned to the neither group at T2 (28 %), and “newly diagnosed”, herein, participants with no diagnosis of substance dependence nor affective/anxiety at T1, who fell into one of the three clinical group at T2 (8 %). Underrepresented pathways (including a total of 6.2 % of the trajectories) were not included in analyses using this grouping system. Modeling MCMI-III PD Structure, Longitudinal Invariance, and Latent Change Only the 14 MCMI-III PD scales were used in this study, as we focus on PD organization only. Following recommendations in the literature (Cuevas et al. 2008; Dyce et al. 1997; Rossi et al. 2010), MCMI-III Linearly Independent Scales (LIS) scores were used as the basis of all analyses in this study. LIS scores are computed by averaging the “prototypal” items for each PD scale, as these items are the most central indicators of the personality disorder construct (Millon et al. 2006). The resulting scores have the advantage of reducing artificial colinearity between scales without losing content validity (Rossi et al. 2007). Preliminary analyses indicated that the LIS scores were highly congruent with the original full-scales scores (i.e. computed following the MCMI-III manual) with median correlation of .96 between LIS and full-scale scores at both Time 1 and Time 2. Confirmatory Factor Analyses (CFA) in a structural equation modeling approach using Full Information Maximum Likelihood estimation (FIML) were used to estimate the fit of two-, three-, and four-factor models of the MCMI-III PD structure commonly identified in the literature. The specifications of these models were the same as those described by Rossi and colleagues (2010). At a second stage, the initial models were improved using modification indices suggesting which parameter could be fixed or set free (correlated error terms were allowed only if they were tenable conceptually). The chi-square difference test (Δχ2) was used to
177
estimate the statistical significance of the improvement in fit of the various models. The model fitting the best T1 and T2 data was then extended into a single longitudinal multivariate factor model (e.g., McArdle and Nesselroade 1994) to test for structural invariance over time. In addition, we implemented a multiple-common-factor latent change score (LCS) model (e.g., Ferrer and McArdle 2010; McArdle 2009) allowing estimation of mean-level change in the PPTD factors at a latent level, as well as correlations between these change factors. This approach avoids the problems inherent in using difference scores such as cumulated errors and regression to the mean (McArdle and Nesselroade 1994; McArdle 2009), that are rarely addressed in the personality-stability and change literature (Ferguson 2010). The fit of all models was assessed using the Chi-square tests of fit and four other widely used indexes: The normed fit index (NFI), the comparative fit index (CFI), the root mean square residual (RMR), and the root mean square error of approximation (RMSEA) with its 90 % confidence interval (e.g., Kline 2010). A final set of multivariate analyses of variance (MANOVA) was conducted to examine the typical profile of PPTDs associated with the four clinical groups. Following recent support for the dynamic modeling of psychological processes (Ferrer and McArdle 2010), trajectories of change in the clinical group (stable, remission, and newly diagnosed) were also examined using a MANOVA and Tukey post-hoc tests to further explore the association between change in psychiatric condition over time, with level of change in the PPTD.
Results Preliminary Analyses Internal consistency of the MCMI-III LIS scores was moderate (e.g., Histrionic, Narcissistic) to high (e.g., Avoidant, Depressive), with consistent Cronbach’s alphas coefficients across measurement occasions, ranging from .62 to .89 (MT1 0.70, MT2 0.71). Distributions of the LIS scores suggested possible violation of the assumption of a multivariate normal data distribution required for planned factor analysis. Consequently, normal scores using the Rankit transformation method (Solomon and Sawilowsky 2009) were computed and yielded distributional features much closer to the Gaussian distribution. Subsequently, the properties of the correlation matrices obtained from the 14 MCMI-III LIS normal scores for both T1 and T2 were examined to ensure their suitability for use in the factor analyses. The correlation matrices were not identity matrices (T1 Bartlett’s test of sphericity 0 3177.7, df091, p