Jun 24, 2009 - Department of Computer Science & Engineering. University of ..... is determined, the dynamic performance tuning system can decide whether to ...
Dynamic Performance Tuning for Speculative Threads Yangchun Luo, Venkatesan Packirisamy, Wei-Chung Hsu, and Antonia Zhai
Nikhil Mungre, and Ankit Tarkas
Department of Computer Science & Engineering University of Minnesota - Twin Cities Minneapolis, MN 55455
Department of Electrical & Computer Engineering University of Minnesota - Twin Cities Minneapolis, MN 55455
{yluo,packve,hsu,zhai}@cs.umn.edu
{mungr001,tarka003}@umn.edu
{ if (condition()) { foo(); load *p; ... } else { store *q; goo(); ... } } while (condition2()) do
ABSTRACT
(a) A loop with ambiguous loop-carried data dependences. Thread 1
Time
In response to the emergence of multicore processors, various novel and sophisticated execution models have been introduced to fully utilize these processors. One such execution model is Thread-Level Speculation (TLS), which allows potentially dependent threads to execute speculatively in parallel. While TLS offers significant performance potential for applications that are otherwise non-parallel, extracting efficient speculative threads in the presence of complex control flow and ambiguous data dependences is a real challenge. This task is further complicated by the fact that the performance of speculative threads is often architecture-dependent, input-sensitive, and exhibits phase behaviors. Thus we propose dynamic performance tuning mechanisms that determine where and how to create speculative threads at runtime. This paper describes the design, implementation, and evaluation of hardware and software support that takes advantage of runtime performance profiles to extract efficient speculative threads. In our proposed framework, speculative threads are monitored by hardware-based performance counters and their performance impact is estimated. The creation of speculative threads is adjusted based on the estimation. This paper proposes speculative threads performance estimation techniques, that are capable of correctly determining whether speculation can improve performance for loops that corresponds to 83.8% of total loop execution time across all benchmarks. This paper also examines several dynamic performance tuning policies and finds that the best tuning policy achieves an overall speedup of 36.8% on a set of benchmarks from SPEC2000 suite, which outperforms static thread management by 9.5%.
Thread 3
Thread 2
Thread 4
load 0x84
load 0x56
load 0x64
load 0x88
store 0x88
store 0x76
store 0x62
store 0x92
Thread 5
Thread 7
Thread 6
violation Thread 4 Restart
load . . .
load . . .
load . . .
load 0x88
store . . .
store . . .
store . . .
store 0x92
Processor 1
Processor 2
L1
L1
Processor 3
L1
Processor 4
L1
L2
Memory
(b) Speculatively parallel threads on four cores. L1 caches are extended to buffer speculative states. Figure 1: Loops with potential inter-thread data dependences can be parallelized under TLS.
Categories and Subject Descriptors C.1.2 [Processor Architectures]: Multiple Data Stream Architectures (Multiprocessors)—Multiple-instruction-stream, multipledata-stream processors (MIMD)
General Terms Experimentation, Performance
Keywords Dynamic Optimization, Thread-level speculation, Multicore Permission to make digital or hard copies of all or part of this work for personal or classroom use is granted without fee provided that copies are not made or distributed for profit or commercial advantage and that copies bear this notice and the full citation on the first page. To copy otherwise, to republish, to post on servers or to redistribute to lists, requires prior specific permission and/or a fee. ISCA’09, June 20–24, 2009, Austin, Texas, USA. Copyright 2009 ACM 978-1-60558-526-0/09/06 ...$5.00.
1. INTRODUCTION Multicore processors have been on the roadmap of most major processor manufacturers for some time. Numerous execution models have been proposed to facilitate the utilization of these cores. Many models, such as Thread-Level Speculation (TLS) [20, 1, 10, 5, 8, 40, 11, 13, 29, 35, 41, 44] and transactional memory [15, 38, 14, 12], require support for coarse-grain speculation and speculation failure recovery. Here we focus on one such execution model—Thread-Level Speculation. Under TLS, parallel threads that are potentially dependent on each other are speculatively executed in parallel and the correctness of the execution is verified at runtime. If no dependence is violated, the speculative thread commits; otherwise, it is squashed and re-executed. Speculative threads empower the compiler to parallelize programs that were previously non-parallelizable. The most straightforward way to parallelize a program is to execute multiple iterations of a loop in parallel. With TLS, the loop
in Figure 1(a) can be parallelized by the compiler without proving whether p points to the same memory location as q from a different iteration. Figure 1(b) demonstrates the speculative parallel execution of the loop on a four-processor CMP that supports TLS, where each thread corresponds to a single iteration of the loop. Speculation will succeed as long as no loads (through pointer p) execute out of order with respect to a store to the same address (through pointer q) by a logically earlier thread. Existing work on TLS mostly relies on compilers to statically analyze programs, and then extract speculative threads [23, 48, 49, 47, 16, 46, 30, 17], which we refer to as static thread management. These compilers often analyze extensive profile information to estimate the performance impact of speculative threads and then determine where and how to create speculative threads. Being able to perform global and even inter-procedure analyses, compilers can extract coarse-grain parallelism in which speculative threads may contain several thousand instructions. However, it is difficult and sometimes impossible for compilers to accurately estimate the performance impact of speculative threads even when extensive profile information is available. If improperly deployed, speculative threads not only waste resources, but can also lead to significant performance degradation. We have identified four key issues that make it difficult for the compiler to determine the efficiency of speculative threads: Profiling information cannot accurately represent complex control and data dependences: The performance impact of speculation is determined by the number of useful execution cycles in the speculative threads that can overlap with the execution of the nonspeculative thread. To determine this overlap, the compiler must determine the size of consecutive speculative threads, the cost of speculation failures and the time of their occurrence, the cost of synchronization, and the cost of managing speculation. However, these factors are often difficult to estimate even with accurate profiling information. For example: the rate of speculation failures not only depends on the number of inter-thread data dependences, but also on the timing of its occurrence. For loops with complex control flow, such as the loop shown in Figure 1(a), it is difficult to determine whether the load/store instructions in consecutive iterations will be dependent, and if so, which stores in the later thread will occur before the load in the earlier thread. Probability-based data and control dependence profiling, which is used in many TLS compilers, is insufficient to come up with such an estimation. Performance impact of speculative threads depends on the underlying hardware configuration: Because speculative threads must share the underlying hardware resources, the configuration of the underlying hardware can change the behaviors of these threads. In particular, interaction between the speculative threads and the cache components has a profound impact on performance. On the one hand, speculative threads, even when they fail, can potentially bring data items into the cache and improve the performance of the non-speculative threads. On the other hand, speculative threads can modify data items that are shared with the non-speculative threads and introduce coherence misses that otherwise do not exist. The impact of such cache behavior is difficult for the compiler to determine even with accurate profile information. Speculative threads behaviors vary as input sets change: The performance of speculative threads is often dependent on the characteristics of the input data. TLS takes advantage of probabilistic data dependences by speculatively assuming that these dependences do not exist. This mechanism is beneficial only if these data dependences are infrequent. Frequently occurring data dependences should be synchronized. Choosing the threshold that separates frequent and infrequent dependences is a delicate matter,
since a high threshold leads to excessive speculation failures, and a low threshold leads to serialization of the threads. However, once this threshold is chosen and the set of frequently occurring dependences are synchronized, this decision is compiled into the binary, even if the decision is not proper for some input sets. When extracting speculative threads for BZIP 2 in SPEC2000, we collected profiles using the train input set and decided which dependences to speculate on. When the program executes with the three ref input sets source, graph, and program, we found that the percentage of total execution cycles that are wasted due to speculation failure was 25%, 40%, and 31%, respectively. To summarize, speculative threads that are created to improve performance under one workload can potentially degrade performance when the input set changes. Speculative threads experience phase behavior: For some applications, it has been reported that the same codes may exhibit different performance characteristics as the program enters different phases of execution [33]. We refer to this behavior as phase behavior. In the context of TLS, phase behavior can be manifested as changing the effectiveness of speculative threads—speculative threads that improve performance during certain phases of execution, can potentially degrade performance during other phases of execution. Probabilistic profiles cannot capture this behavior, as speculative decisions that are compiled statically into the binary cannot adapt to this behavior. Phase change is a natural phenomenon in real-world applications, and can occur as a result of ordinary programming constructs. For example, in algorithms that search for the maximum or minimum in a large data set, the frequency of updating the global variables decreases as the algorithm progresses. Thus a loop that is not fit for speculative execution earlier in the program can become a good candidate during later phases of the execution. If the execution of speculative threads can be monitored, it is possible for the runtime system to determine the impact of the above factors. Therefore, dynamically managing speculative threads can be an attractive alternative. The impact of speculative threads on the application performance is multi-fold: they can commit speculative work, move data between various memory and cache components, and compete for shared resources with the non-speculative thread. A crucial task in creating speculative threads is to allocate work to each thread, taking into consideration inter-thread dependences and resource requirements. Since such decisions are not unique and it is difficult for the compiler to make decisions that are optimal for all programs under all workloads on a large variety of machines, we propose to build a runtime system to make such decisions. In particular, for speculative threads that are parallelizing iterations of loops in a loop nest, the runtime system decides which loop level to parallelize. To dynamically tune performance for speculative threads, our proposed framework addresses the following issues: Thread Monitoring: The performance of speculative threads must be collected dynamically. Such profiles can be application-dependent, such as loop iteration count; architecture-dependent, such as memory access latency; or both, such as branch misprediction rate and cache miss rate. The profile can be obtained through either software instrumentation or hardware performance monitor sampling. In this paper, hardware-based performance counters [9, 32] are used. A small piece of code that initializes these counters is executed at the beginning of execution by modifying a libc entry-point routine named libc start main. This mechanism has been proposed by Lu et al. [25]. Thread Evaluation: Once the profile is collected through hardwarebased performance counters, the profile is analyzed to determine whether the speculative threads are effective. The performance im-
pact of speculative threads is often multi-faceted. The interaction between the main and the speculative threads also complicates the estimation of performance. For instance, data brought in by the speculative threads can be used by the main thread but can also displace useful data needed by the main thread. The results of this analysis can be stored in a performance table that can be maintained by either hardware or software. Thread Management: Once the effectiveness of speculative threads is determined, the dynamic performance tuning system can decide whether to create speculative threads and save this decision in a hardware/software decision table. At the beginning of each candidate loop, the runtime system queries the decision table and decides whether a speculative thread should be created.
1.1 Contributions and Future Extensions This paper explores the feasibility and effectiveness of performance tuning systems that dynamically adjust the behavior of speculative threads based on runtime performance counters. Under the context of dynamic performance tuning for TLS, this paper makes the following contributions: • We propose an execution framework that allows the runtime system to collect speculative thread performance profiles and make decisions on exploiting loop level parallelism for TLS on-the-fly. • We propose and evaluate dynamic performance evaluation methodologies that analyze accurate execution cycle breakdown of speculative threads to determine the efficiency of those threads. We also discuss how hardware counters could be programmed and utilized to collect the required execution cycle breakdown. • We propose, implement and evaluate various dynamic performance tuning policies to adjust the exploitation of speculative threads based on the performance profile. By evaluating these policies, we identify important runtime information and compiler annotations that could substantially improve the efficiency of dynamic performance tuning. The rest of this paper is organized as follows: We first describe the compiler and simulation infrastructure in Section 2, then describe how the efficiency of speculative threads can be estimated from execution cycle breakdowns collected using hardware-based performance counters in Section 3. Section 4 describes necessary runtime support for profile collection and decision making. Section 5 evaluate the proposed system with a spectrum of performance tuning policies. Related work is discussed in Section 6. Finally we present our conclusions and future work in Section 7.
2.
EXPERIMENT INFRASTRUCTURE
We have evaluated all fifteen of the SPEC2000 benchmarks written in C and simulated the execution of these benchmarks using ref input sets on a detailed cycle-accurate architectural simulator configurated with four cores, as shown in Figure 1(b). Due to their distinct differences, we treated the PLACE and ROUTE input sets of 175. VPR as two benchmarks, referred as VPR - P and VPR - R in later sections.
2.1 Compilation Infrastructure Our compiler infrastructure is built on the Open64 Compiler [34], an industrial-strength open-source compiler targeting Intel’s Itanium Processor Family. We extended Open64 to extract speculative parallel threads from loops. For static thread management, the compiler estimates the parallel performance of each loop based on
Table 1: Processor parameters Fetch/Issue/Commit Width ROB/LSQ Size Integer Units Floating Point Units Private L1-Data/Inst Cache
6/4/4 128/64 entries 6 units / 1 cycle 4 units / 12 cycles 64KB, 4-way, 32B
Number of Cores Shared L2-Data Cache L1/L2/Memory Latencies Memory Ports Thread Squash/Spawn/Sync
4 2MB, 8-way, 64B 1/18/150 cycles 2 Read, 1 Write 5/5/1 cycles
the cost of synchronization and the probability and cost of speculation failure, using loop nesting profile, edge frequency profile, and data dependence frequency profile. The compiler then chooses to instrument a set of loops that maximize the overall program performance based on such estimations [47]. To facilitate dynamic performance tuning, we simply force the compiler to create a different executable in which every loop is instrumented. Compiler optimization of inter-thread register value communication is applied to those instrumented loops [48].
2.2 Simulation Infrastructure We use a trace-driven, out-of-order superscalar processor simulation infrastructure. The trace-generation portion of this infrastructure is based on the PIN instrumentation tool [28], and the architectural simulation portion is built on SimpleScalar [4]. We not only model the register renaming, the reorder buffer, branch prediction, instruction fetching, branching penalties, and the memory hierarchy performance, but also extend the infrastructure to model different aspects of TLS execution, including explicit synchronization through signal/wait, cost of thread commit/squash, etc. Table 1 shows the architecture parameters of each core in a Chip Multiprocessor. A bus connects private L1 caches and a shared unified L2 cache. The L1 caches are kept coherent with an invalidation-based cache coherence protocol, and the protocol is extended to support TLS [41]. Special hardware supports are integrated to support fast inter-thread communication [21]. Previous work has shown that the compiler is able to schedule instructions so that communication can be overlapped with computation [48, 49]. Thus, overall execution time will not increase linearly with the increase in communication latency. The overhead of dynamic tuning is also taken into consideration, such as the overhead wasted on trying an ineffective loop. To reduce simulation time, we have adopted the SimPoint-based sampling technique [36] with 100 million instructions per sample and up to 10 samples per benchmark.
3. DETERMINING THE PERFORMANCE IMPACT OF SPECULATIVE THREADS Compiler-based speculative extraction techniques [23, 47, 16, 46, 40, 17, 30] estimate the TLS performance for each candidate loop, often with the help of performance or dependence profiles, and then choose a set of loops to maximize the overall performance gain. These techniques often are unable to adapt to performance variations associated with changing input sets, micro-architecturedependent behaviors, and changing phases. Therefore, such techniques may leave substantial room for greater TLS performance. Postponing loop selection decisions until runtime can potentially adapt to these variations, although a runtime mechanism is needed to estimate the efficiency of speculative threads. In this section, we propose a way to quantitatively determine the efficiency of TLS execution by observing its performance characteristics. The pro-
execution stall between sequential and TLS execution is negligible. However, when the thread size is smaller than the ROB size, execution stall may increase. Thus, to accurately predict execution stall in sequential runs, parallel execution stall must be scaled down by a factor that is proportional to the ratio of ROB size over thread size.
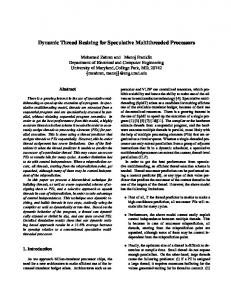
3.1.2 Data Cache Behaviors Figure 2: Execution time breakdown of a hypothetical loop under two execution models: TLS on four processor (TLS4) and sequential execution (SEQ). Sequential execution time of the loop predicted from the cycle breakdown of TLS4: a simple prediction predSEQ-simple and a detailed prediction predSEQ-detail. Bars are normalized to SEQ.
posed techniques can be extended to evaluate the effectiveness of other multi-threaded execution models, as discussed in Section 7.1. Our technique builds on execution cycle breakdowns that can be obtained through hardware-based, programmable performance monitors. Details of these monitors and how to obtain the breakdowns are outlined in Section 4. For our purposes, cycles for TLS execution are broken into six segments, shown in Figure 2: cycles spent graduating instructions (Busy), cycles stalled due to instruction latency (ExeStall), cycles stalled due to instruction fetch penalty (iFetch), cycles stalled due to data cache misses (dCache), cycles wasted due to speculation failures (Squash), and cycles wasted managing TLS execution, including thread spawning, committing, and synchronization (Other). Figure 2 shows the execution time breakdown, normalized to the execution time of the sequential execution, of a loop executing in TLS mode on four cores (TLS4) and executing sequentially (SEQ). Each segment in TLS4 is the aggregated cycles scaled down by four to show the relative speedup compared to SEQ.
3.1 Estimating Sequential Execution Performance from Speculative Execution To isolate the performance impact of the speculative threads, we attempt to predict the sequential execution time from the execution time breakdown of the TLS execution. A straightforward prediction, shown as the predSEQ-simple bar in Figure 2, is the total aggregated cycles from parallel execution subtracted by Squash and Others. To obtain the aggregated cycles, each segment in TLS4 bar is multiplied by four, where four is the total number of cores. In this prediction, Busy is accurately predicted because the amount of useful work done by TLS4 and SEQ is similar; iFetch in sequential execution is similar to that of speculative execution. However, execution stall and cache behaviors can change dramatically when the sequential program is decomposed into multiple threads. To improve our prediction accuracy, a more detailed prediction technique is developed to address the inaccuracies in the ExeStall and dCache segments.
3.1.1 Execution Stall When the original program executes sequentially in one processor, instructions from multiple iterations of the same loop are available for scheduling, and thus the processor is able to effectively exploit instruction-level parallelism (ILP). However, when the same code is decomposed into multiple threads that are distributed to multiple cores, execution stall may increase since fewer instructions are available for scheduling. This effect correlates with the average number of dynamic instructions per thread (thread size). When the thread size is greater than the ROB size, the variance of
Speculative threads have a significant impact on data cache performance. Cache misses seen in TLS execution may or may not occur during sequential execution. We proposed to classify cache misses, and predict whether they would occur during sequential execution. We found that only a subset of these misses should be counted towards the predicted sequential execution time. Consider the case where a speculative thread brings in a data item into L1 Dcache and then the thread is eventually squashed. All the cycles from the thread start to the squashed point is counted toward Squash. There are two possibilities. If the data item is not modified, when the thread re-executes, it will hit in the cache. Since Squash is eventually discarded in the predicted sequential execution time, this miss is inadvertently discarded. This effect may partly explain why the dCache in TLS4 of Figure 2 is less than 1/4 of that in SEQ. To rectify this counting inaccuracy, the dCache segment of a squashed thread should not be counted toward Squash. If the data item is speculatively modified, it will invalidate upon squash. During the re-execution, this data item must be brought to L1 Dcache again. In this case, two cache misses will be counted in the dCache segment. To improve the accuracy of sequential execution time prediction, we must avoid such double counting. When two threads on different cores load the same address, two L1 misses would be counted in total. However, in sequential execution, it is likely that the logically later miss on the second thread will become a hit since the threads are executing on the same core. However, it is still possible for the later miss to occur if the data is evicted from L1 cache before the second access is issued. To accurately predict sequential execution time, it is necessary to distinguish between these two cases. How to differentiate the above scenarios by checking appropriate hardware conditions will be discussed in Section 4.1.1. It is worth pointing out that cache behaviors make it difficult for static analyses to derive the impact of speculative threads accurately. If speculation failure often helps to fetch useful data into the L1 cache, this high failure rate can be benign, but if failed threads often invalidate useful data, even a moderate failure rate can be detrimental.
3.2 Performance Prediction Accuracy Evaluation How accurate is the predicted sequential execution time? We evaluated the prediction accuracy on three increasingly complex schemes: Base corresponds to the simple prediction described in Section 3.1; Base+ExeStall incorporates the execution stall adjustment described in Section 3.1.1; and Base+ExeStall+dCache further incorporates the data cache adjustment. For every loop invocation, three sets of execution times are obtained: the parallel execution cycle (TT LS ), the predicted sequential execution cycle (TpredSEQ ), and the actual sequential execution cycle (TSEQ ). If TpredSEQ and TSEQ are both greater or smaller than TT LS , the prediction is considered correct. Bars in Figure 3 represent the degree of correctness of the prediction, which is the percentage of cycles that are spent executing loops that can be correctly predicted over the total of cycles executing parallelized loops. To understand quantitatively how accurate the predicted sequential execution time TpredSEQ is compared to the real sequential execution time, TSEQ , similarity is calculated for each benchmark. Dissimilarity is the ac-
Figure 3: Degree of correctness of sequential performance prediction for TLS: percentage of loops for which the performance prediction mechanisms are able to correctly determine whether speculative threads are able to improve performance (weighted by the dynamic execution time of the loops). Base corresponds to the simple performance prediction mechanism outlined in Section 3.1; Base+ExeStall incorporates the ILP estimation technique described in Section 3.1.1; Base+ExeStall+dCache incorporates the data cache miss estimation technique descried in Section 3.1.2. Similarity corresponds to quantitative comparison of how close the actual and predicted sequential cycles are. cumulative difference, |TpredSEQ − TSEQ |, between the two execution times over the total sequential execution time, TSEQ , for all loops. Similarity is simply one minus dissimilarity. The Base prediction is inaccurate for many benchmarks (71.2%); the Base+ExeStall prediction only improves the prediction accuracy slightly (72.0%). However, when cache performance is taken into consideration, the prediction accuracy improves significantly (83.8%). Thus we believe that being able to accurately understand the cache performance of TLS execution is key to efficient dynamic TLS performance tuning. The similarity of each benchmark is also shown in Figure 3. We have observed that for most benchmarks, the predicted values (using Base+ExeStall+dCache) are accurate and close to the actual value: the average similarity for all benchmarks is 86.4%.
4.
RUNTIME SUPPORT
In this section, we describe two key runtime supports: using proposed hardware performance monitoring features to collect performance profiles for speculative threads, and managing performance profiles to enable dynamic TLS performance turning.
4.1 Performance Profile with Hardware Performance Monitors The performance impact analysis techniques proposed in Section 3 rely on accurate TLS execution time breakdowns. Obtaining accurate execution time breakdowns in an out-of-order processor core is difficult due to the overlap of multiple on-the-fly instructions. Examining the instructions at the head of ROB gives us some clues [32] to the cause of a stall. In this section, we show how to obtain such execution time breakdowns for TLS execution. Note that our goal is not to build an execution time breakdown for the TLS execution, but a hypothetical breakdown for the predicted sequential execution time as discussed in Section 3. The hardware performance monitors are programmed to attribute execution cycles into the following categories: Busy, cycles spent graduating instructions (aggregated); ExeStall, cycles stalled due to instruction execution delays (aggregated); iFetch, cycles stalled due to instruction fetch penalty (aggregated); dCache, cycles stalled due to data cache misses (aggregated); UsefulInstrution, number of non-TLS instructions committed (aggregated); ThreadCount, number of threads committed (aggregated); and Total, cycles elapsed since the beginning of TLS invocation. For
each data cache miss, we also count the number of cycles needed to serve the miss. We refer to this counter as dCacheServe. Counters are maintained per core. A counter is marked aggregated if its value must be aggregated from all cores. Let us first consider a core whose commit width is one. Total is incremented on every clock cycle. At a given cycle, if the ROB is empty, the iFetch counter is incremented; if the instruction at the head of ROB is able to graduate, the Busy counter is incremented; if the instruction stalled at the head of the ROB is a memory operation, the dCacheServe counter is incremented; if the instruction stalled is a TLS management instruction, such as thread creation/commit instructions or synchronization instructions, no counter is incremented; otherwise, the ExeStall counter is incremented. When a non-TLS-management instruction commits, UsefulInstruction is incremented. For cores with multiple commit width, at each cycle, multiple counters can increase, each corresponding to a retirement slot. The mechanism described here is similar to the performance monitors in IBM POWER5 [32]; with the following extensions: depending on how the cache miss is served, the dCache is incremented differently. Details will be discussed in Section 4.1.1. Counters are maintained per core. To evaluate the effectiveness of TLS execution, counters must be aggregated from all cores. The following steps take place during TLS execution: (i) when a thread is spawned to a core, counters on that core are reset; (ii) when a thread commits (only the non-speculative thread is allowed to commit), all the aggregated counters are forwarded to the next nonspeculative thread and the ThreadCount is incremented; and (iii) when a speculative thread becomes non-speculative, it aggregates the forwarded counters with its own counters.
4.1.1 Counting Cycles for Data Cache Misses The dynamic nature of cache behavior increases the complexity of estimating the cache performance of sequential execution from parallel execution. Section 3.1.2 categorizes four different scenarios where a cache miss should count or dismiss. dCacheServe is programmed to hold the latency for the current on-the-fly cache miss. When the miss is finally serviced, a decision must be made regarding whether the value in dCacheServe should be added to dCache or not and dCacheServe must be reset. Consider the case where a data item used by a thread is actually brought into the cache by another speculative thread and the
latter eventually fails. In this case, cycles spent stalling for load instructions in the failed thread must be counted towards dCache rather than discarded. Thus the dCache counter is preserved when a thread fails. Consider the case where a data item in the L1 cache is invalidated by a message from a speculative thread. If this data item is accessed in the future, it will cause a cache miss. However, this cache miss would not have occurred if the program executed sequentially, and thus the cost for this cache miss should be excluded from dCache. When a miss happens, if a matching tag is found in the cache but with invalid status, indicating a coherence miss occurred, dCacheServe will not add to dCache. Consider the case where a data item is needed by two threads running on two different cores, causing two cache misses. In the case of sequential execution, it may have only one cache miss. To avoid such double counting, we must exclude the cost associated with the latter miss. If the data is brought into the cache in the shared state, dCacheServe will not add to dCache. Finally, consider the same case as the previous one but in which the second miss in sequential execution is a conflict miss, so both misses should be counted. This case can be detected by knowing a cache line is loaded and shared by a logically later thread. So when such a line is evicted in the current thread, we project a cache miss would be required to get the line back in sequential execution. Therefore, a L1 miss (and L2 hit) latency will be added to the dCache counter.
4.2 Decision Making for TLS To evaluate the effectiveness of TLS execution, we analyze the counters of the non-speculative thread and estimate the predicted sequential execution time. These values can be passed to software to evaluate TLS performance: Total is TLS execution time; ThreadSize is computed as the ratio of UsefulInstruction and ThreadCount, and is used to scale down ExeStall as described in Section 3.1.1; the sum of Busy, scaled ExeStall, iFetch, and dCache is the predicted sequential execution time. To decide which loops to parallelize speculatively, a performance table is maintained for the candidate loops. This performance table can be indexed by a unique identification number associated with each loop, such as the address of the instruction that spawns the speculative thread. Each entry in the table contains two entries: the saturation counter, which is incremented if the TLS execution outperforms the predicted sequential execution and decremented otherwise, and a performance profile summary, which contains the cumulative difference in execution time (i.e., cycles) between the TLS execution and the estimated sequential execution. Before a candidate loop is executed, this table is consulted; after a candidate loop is executed in TLS mode, the main thread updates the table by adding the difference between the TLS execution and the predicted sequential execution time to the performance summary. This performance table can be maintained either by software or by hardware (with explicit hardware support). This paper uses hardware-based tables that are maintained on all cores. If the implementation cost is deemed too substantial, we can shift the work to software by adding performance table management code at the end of each loop invocation. The non-speculative thread updates the tables on all cores as the last iteration of a speculatively parallelized loop terminates.
5.
PERFORMANCE EVALUATION
To evaluate the effectiveness of dynamic performance tuning for speculative threads, we experimented with all the SPEC CPU2000 benchmarks written in C. Many benchmarks contain multiple nested loops, and thus the dynamic performance tuning mechanism is re-
quired not only to identify and parallelize loops that can benefit from TLS, but also to select the right level of loop to maximize the overall performance gain. A straightforward mechanism is to first tentatively parallelize each loop, measure the performance impact, and then serialize the ones for which speculative thread execution is ineffective. However, various tuning policies may be used to determine the order in which loops in a loop nest are evaluated and to decide which loop to serialize. Different policies would yield different costs and performances. In this section, we first examine design issues for creating a dynamic tuning system and propose and evaluate several dynamic tuning policies. Effective policies should first identify loops that lead to overall speedup. A loop can have different execution times among different invocations across the program. One example is a loop traversing a linked list: the execution time of the loop is dependent on the length of the linked list, which may vary from one list to another. Another example is a loop with conditional break-out statements. For such loops, performance estimation based on one invocation could be misleading. Consider a loop with 6 invocations, for example; the first one takes a long time to execute and TLS is 2000 cycles faster than sequential execution, while the other 5 invocations have short execution times, and TLS is 100 cycles slower. With the 6 invocations, TLS leads to an overall speedup of 2000 − 5 ∗ 100 = 1500 cycles. However, if deprived of cycle numbers, this loop could be considered a poor candidate for TLS because for 5 out of 6 invocations, TLS yields lower performance. Identifying loops that could lead to overall speedup requires quantitative evaluation of the impact of speculative threads. Furthermore, effective policies should identify a set of loops that lead to maximum performance benefits. In many benchmarks, it is common to have multiple nesting loop levels that benefit from speculative threads. Since the optimal parallel loops are most likely neither the outermost nor innermost loop, finding the set of optimal loops is essential to dynamic tuning policies. Finally, effective policies should adapt to program phase changes. When a program enters a different phase, loop behaviors can change substantially. Loops that are previously serialized could potentially benefit from TLS in the new phase. Therefore, an adaptive tuning policy may want to re-evaluate and re-select the best performing loops when phase changed. To achieve the above design goals, we examine and evaluate the following four policies: Simple: This policy follows an Inside-Out search order to evaluate the benefits of TLS at each level of a loop nest. Each level runs in a speculatively parallelized mode for several invocations, and once the number of times TLS is worse than sequential execution exceeds a threshold, the loop is serialized and the search continues until it reaches the outermost level. Otherwise, the current loop is continuously parallelized until such a threshold is reached, and the search for the loop nest may end at the current loop level. Although this policy could use the Outside-In search order instead, outer loops are much larger than inner loops and attempting outer loops would significantly prolong the time needed to reach the best level. In the extreme case, the outermost loop covers the entire program execution, so by the time the outermost loop level is evaluated, the execution of the program is almost done. Quantitative: Simple is prone to serializing a loop prematurely, while the loop could lead to overall speedup. Loop invocations with different execution times should not be treated equally. This policy quantitatively evaluates every loop invocation and uses the cycles saved from sequential execution as the weights of different invocations. Under this policy, a loop is serialized only if both the cycle-saving becomes negative and the number of times TLS is slower than sequential execution exceeds a threshold.
Figure 4: Performance impact of dynamic speculative threads performance tuning. Innermost corresponds to parallelizing the innermost loops. The other four bars correspond to the four tuning policies described in the text. The speedup is normalized to the original sequential execution (SEQ). Quantitative+Static: Both Simple and Quantitative stop searching once a loop level that could benefit from TLS is reached. Since multiple loop levels can all benefit from TLS, those searching mechanisms cannot guarantee reaching the level that has best performance benefit. Although an exhaustive search would find the best level, it would take too much time and may not be cost-effective, as search time is part of run time. This policy incorporates static analysis through compiler annotations to search for the best loop level. It starts from the level suggested by the compiler, and if this level is indeed better for TLS, the search is over; otherwise, this loop level is serialized and the search begins from the innermost level. Quantitative+StaticHint: Quantitative+Static can potentially find the best level if static analysis is accurate. Moreover, to protect against the case when the compiler’s choice is wrong, this new policy evaluates both the compiler-annotated loop level and the neighboring levels quantitatively to increase the chance of selecting the best loop level.
5.1 Performance Impact of Different Tuning Policies Figure 4 contrasts the speedup compared to sequential execution (SEQ) among parallelizing the innermost loop level (Innermost) and the four increasingly sophisticated tuning policies. All the overall speedup numbers are summarized by geometric mean. Although Simple generally improves performance, it is worse than Innermost for GAP, GZIP, MCF, PARSER , VPR - P, and VPR - R. A close examination of the execution traces reveals that Simple missed some profitable inner levels due to premature serialization. Simple has an overall speedup of 1.165x, slightly higher than Innermost (1.152x).
5.1.1 Simple vs. Quantitative Quantitative weights different loop invocations by the cycles they saved from sequential execution, and is more accurate than Simple in identifying profitable loops. Quantitative has an overall speedup of 1.229x, better than Simple. Thus it generally outperforms Simple, especially for GZIP, MCF, VPR - P, and VPR - R. Yet Quantitative is worse than Simple for ART and MESA because Quantitative finds an inner level for which TLS is beneficial and ends searching, whereas Simple happens to serialize the inner level and reaches an outer level, which is even more profitable in TLS.
5.1.2 Quantitative vs. Quantitative+Static Quantitative+Static incorporates compiler annotations to evaluate the potentially best loop level, which may not be reached by the Quantitative policy. Quantitative+Static selects better loop levels for ART, GCC , TWOLF, and VPR - P than Quantitative, but it greatly
degrades AMMP, GZIP, and MCF. The performance degradation in MESA remains unsolved. A close examination reveals that static analysis information annotated by the compiler for these benchmarks is inaccurate and sub-optimal loop levels are targeted; Quantitative+Static respects the static decision and does not attempt to look at other levels. Overall, Quantitative+Static has a speedup of 1.229x, on par with the Quantitative policy.
5.1.3 Quantitative+Static vs. Quantitative+StaticHint Quantitative+StaticHint uses static analysis as guidance and evaluates both the compiler-annotated loop level and its surrounding loop levels. The compiler-annotated loop will be compared to its inner loops, but if the annotated level is the innermost, it will also be compared with the immediate outer loop level. In both cases, this policy can select a loop level that outperforms the compiler’s annotated loop level. With this policy, inaccurate static loop selections are overridden in GZIP and MCF, so the performance is similar to Quantitative. (The slight slowdown in MCF is due to tentatively parallelizing a sub-optimal loop for comparison.) At the same time, TWOLF and VPR - P enjoy the benefit of accurate static analysis. More importantly, for benchmarks AMMP, ART, GCC, and MESA, loop levels with better performance are discovered and parallelized, which yields better results than both Quantitative and Quantitative+Static. In Section 5.3, detailed case studies will illustrate how this policy finds a better loop level than suggested by the compiler for a few benchmarks. Across all the benchmarks, Quantitative+StaticHint generally yields the best performance among all tuning policies, with an average speedup to sequential execution of 1.368x. To summarize, these four increasingly sophisticated tuning policies attempt to reach the design goals stated at the beginning of this section. Performance gradually improves, rising from a baseline of 1.165x to the most sophisticated level of 1.368x.
5.2 Performance Comparison with Static Approach This section contrasts the performance of our most successful policy (Quantitative+StaticHint) with the performance of static loop selection (Static). Before presenting a detailed comparison, we first explain the overhead introduced to TLS. To parallelize a loop, necessary special instructions (thread spawning, synchronization instructions such as signal and wait, and thread committing) are generated. Such extra instructions are TLS overheads. For static analysis, the compiler selects only a subset of loops to insert such in-
(a) Speedup of static and dynamic approaches compared to the original sequential execution (SEQ), as well as to their respective sequential versions (staticSEQ and dynamicSEQ).
(b) Execution time of the parallelized binary running sequentially. In staticSEQ, statically selected loops are parallelized; in dynamicSEQ all loops are parallelized. This measures the parallel code overheads. The higher the bar, the worse the overhead. Figure 5: Performance comparison between Static loop selection and the most successful dynamic loop selection (Quantitative+StaticHint). structions, but for dynamic policies, all the loops are instrumented so that any loop may be selected for TLS. When the code is running in sequential mode, such TLS specific instructions are executed as NOPs, but will incur extra cycles. If a program has a lot of small loops that are instrumented but not selected for TLS, the slowdown due to overhead can be significant. We regard this overhead as parallel code overhead for TLS. In Figure 5(a), Static and Quantitative+StaticHint are both normalized to the execution time of the real sequential executable where no instrumentation are made. Quantitative+StaticHint outperforms Static in most of the benchmarks and by a large margin for AMMP, ART, EQUAKE , GCC , MCF, and MESA . Exceptions are BZIP 2, CRAF TY, GAP, PERLBMK , and VORTEX . Initial investigation indicates the slow down may be caused by such parallel code overhead. The overall speedup of Static is 1.249x; Quantitative+StaticHint outperformed it by 9.5%. To further understand the performance impact from such overhead, we normalize the TLS runs to the sequential execution of their respective parallelized code. For example, we run the static and dynamic parallel code sequentially, and their execution time is shown in staticSEQ and dynamicSEQ. The performance impact due to overhead can be observed in Figure 5(b), where the higher the bar, the greater the overhead. In Figure 5(a), Static/staticSEQ, and Quantitative+StaticHint/dynamicSEQ are chosen to normalize to their corresponding baselines, and the degradation due to such overhead is greatly mitigated. Overall, Static/staticSEQ and Quantitative+StaticHint/dynamicSEQ increase the speedup to their sequential executions to 1.272x and 1.459x, respectively. By varying the baselines, our dynamic approach outperforms that static approach by 14.6%. Parallel code overhead can be mitigated in several ways. Us-
ing simple heuristics, the compiler or programmer can filter out some loops first. For example, loops with tight dependencies (such as pointer chasing or short reduction) are unlikely to benefit from TLS. Another way is to have the compiler generate two versions of every loop, one sequential and one parallel, and let the runtime system select the right version to invoke. A runtime re-optimization system can also eliminate such overhead for all loops not selected for TLS.
5.3 Case Studies In this section, we examine in more detail on benchmarks where dynamic tuning performs much better than static loop selection and explain why this can only be achieved through runtime decisionmaking. Many cases have similar behaviors, so we present the case for AMMP and ART in this section.
5.3.1
AMMP The performance improvement of AMMP from Static to Quantitative+StaticHint in Figure 5(a) comes from the different loop levels selected by them. The two different loop level selections are located in source file rectmm.c. The outer loop starts at line 562 and the inner loop starts at line 995. We named loops by their starting line number. Their code snippets and execution time breakdowns are shown in Figure 6(a). The bars are labeled with loop name and its execution mode. For example, 995 SEQ and 995 TLS4 correspond to loop 995 running sequentially and in parallel, respectively. Bars are normalized to sequential executions with respect to the same loop. The static loop selection believes the outer loop 562 has a greater performance benefit than the inner loop 995. However, loop 562 incurs frequent speculation failures (i.e., is squashed), which cannot be predicted by the compiler. Although
for( inode = 0; inode < nx*ny*nz; inode ++) (line# 562) {/* loop over all mm nodes */ ... for( i=0; i< imax; i++) (line# 995) { a2 = (*atomall)[i]; for( j=0; j< a1->dontuse; j++) (line# 998) { if( a2 == a1->excluded[j]) goto SKIPNEW;} ... SKIPNEW: j = j; } /* end of loop 995 */ }/* end of loop 562 */
(a)
AMMP
code snippet (rectmm.c) and performance characteristics of loops inside the snippet.
for (ti=0;ti